

An Alternative Explanation for Difficulties with Speech in Background Talkers: Abnormal Fusion of Vowels Across Fundamental Frequency and Ears
- PMID: 33877470
- PMCID: PMC8329143
- DOI: 10.1007/s10162-021-00790-7
An Alternative Explanation for Difficulties with Speech in Background Talkers: Abnormal Fusion of Vowels Across Fundamental Frequency and Ears
Erratum in
-
Correction to: An Alternative Explanation for Difficulties with Speech in Background Talkers: Abnormal Fusion of Vowels Across Fundamental Frequency and Ears.J Assoc Res Otolaryngol. 2021 Jul;22(4):463. doi: 10.1007/s10162-021-00802-6. J Assoc Res Otolaryngol. 2021. PMID: 34272623 Free PMC article. No abstract available.
Abstract
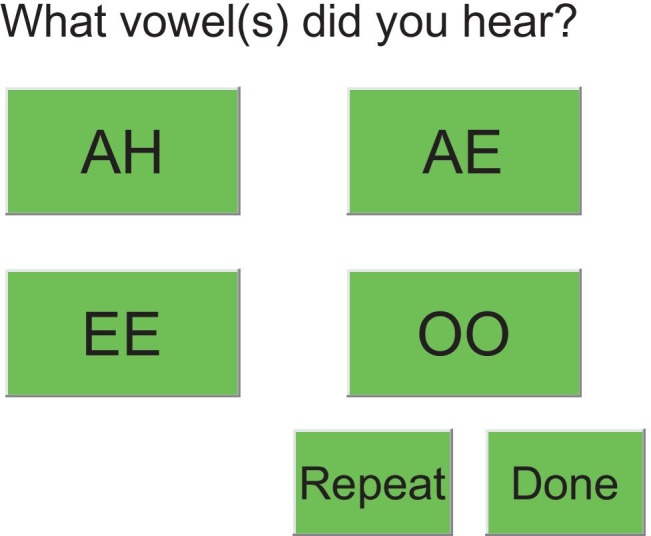
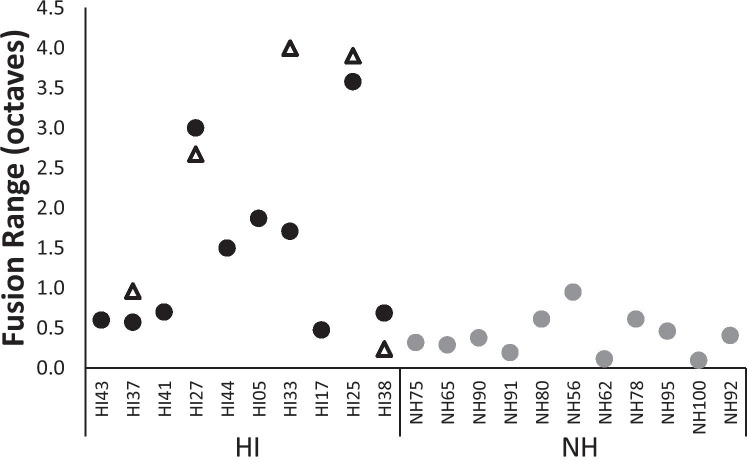
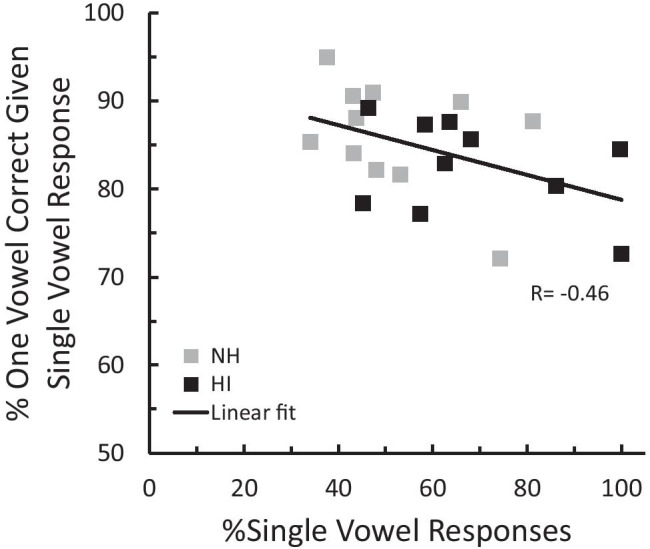
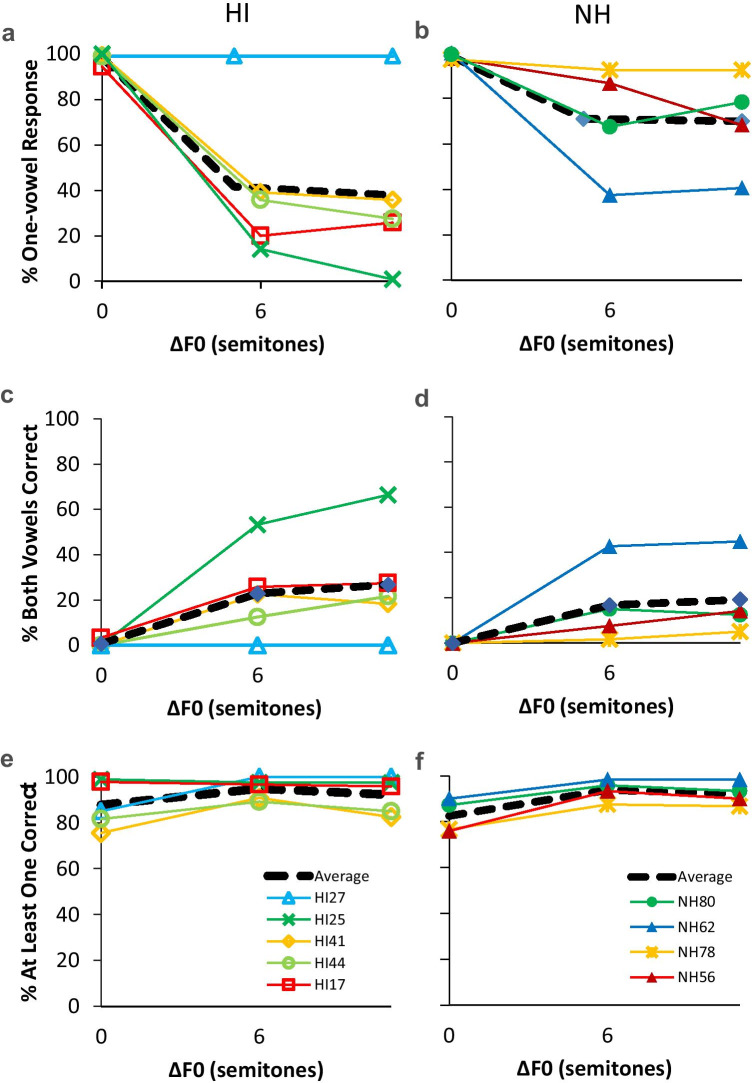
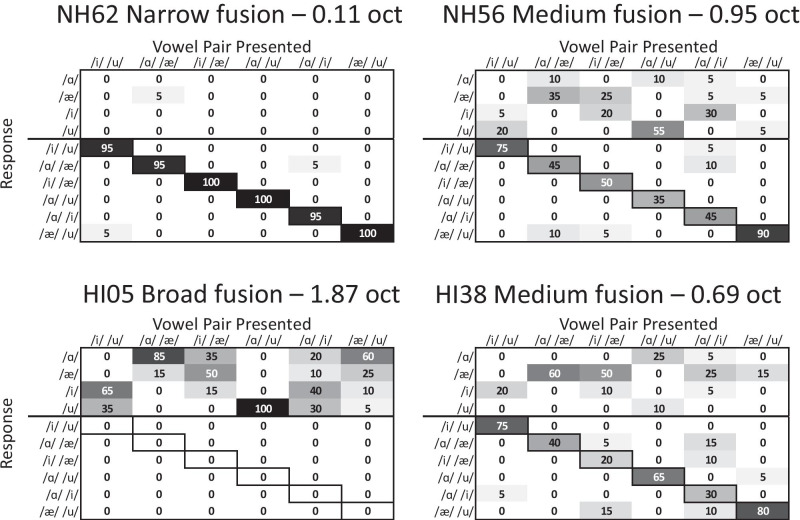
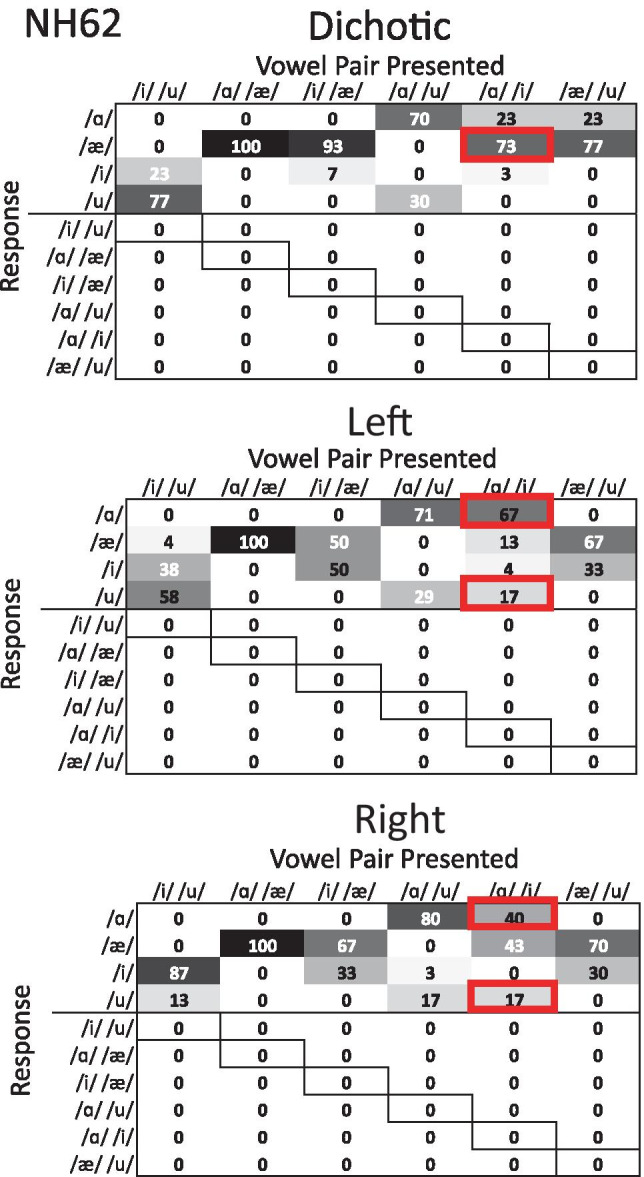
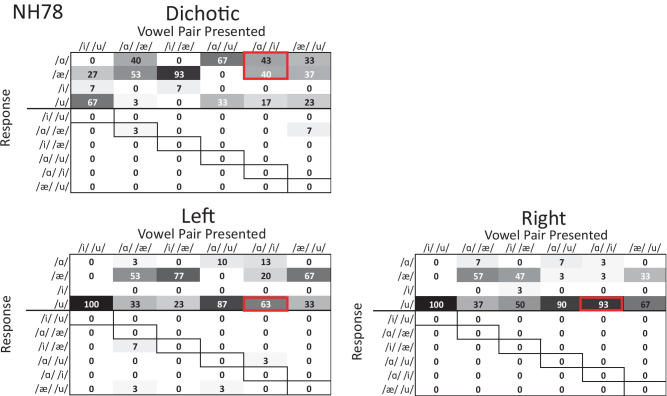
Normal-hearing (NH) listeners use frequency cues, such as fundamental frequency (voice pitch), to segregate sounds into discrete auditory streams. However, many hearing-impaired (HI) individuals have abnormally broad binaural pitch fusion which leads to fusion and averaging of the original monaural pitches into the same stream instead of segregating the two streams (Oh and Reiss, 2017) and may similarly lead to fusion and averaging of speech streams across ears. In this study, using dichotic speech stimuli, we examined the relationship between speech fusion and vowel identification. Dichotic vowel perception was measured in NH and HI listeners, with across-ear fundamental frequency differences varied. Synthetic vowels /i/, /u/, /a/, and /ae/ were generated with three fundamental frequencies (F0) of 106.9, 151.2, and 201.8 Hz and presented dichotically through headphones. For HI listeners, stimuli were shaped according to NAL-NL2 prescriptive targets. Although the dichotic vowels presented were always different across ears, listeners were not informed that there were no single vowel trials and could identify one vowel or two different vowels on each trial. When there was no F0 difference between the ears, both NH and HI listeners were more likely to fuse the vowels and identify only one vowel. As ΔF0 increased, NH listeners increased the percentage of two-vowel responses, but HI listeners were more likely to continue to fuse vowels even with large ΔF0. Binaural tone fusion range was significantly correlated with vowel fusion rates in both NH and HI listeners. Confusion patterns with dichotic vowels differed from those seen with concurrent monaural vowels, suggesting different mechanisms behind the errors. Together, the findings suggest that broad fusion leads to spectral blending across ears, even for different ΔF0, and may hinder the stream segregation and understanding of speech in the presence of competing talkers.
Keywords: binaural fusion; concurrent vowel; dichotic; hearing loss.
© 2021. Association for Research in Otolaryngology.
Figures


Similar articles
-
Fusion of dichotic consonants in normal-hearing and hearing-impaired listenersa).J Acoust Soc Am. 2024 Jan 1;155(1):68-77. doi: 10.1121/10.0024245. J Acoust Soc Am. 2024. PMID: 38174963 Free PMC article.
-
Onset Asynchrony: Cue to Aid Dichotic Vowel Segregation in Listeners With Normal Hearing and Hearing Loss.J Speech Lang Hear Res. 2022 Jul 18;65(7):2709-2719. doi: 10.1044/2022_JSLHR-21-00411. Epub 2022 Jun 21. J Speech Lang Hear Res. 2022. PMID: 35728021 Free PMC article.
-
Double-vowel perception in listeners with cochlear hearing loss: differences in fundamental frequency, ear of presentation, and relative amplitude.J Speech Lang Hear Res. 2005 Feb;48(1):236-52. doi: 10.1044/1092-4388(2005/017). J Speech Lang Hear Res. 2005. PMID: 15938067
-
Two Ears Are Not Always Better than One: Mandatory Vowel Fusion Across Spectrally Mismatched Ears in Hearing-Impaired Listeners.J Assoc Res Otolaryngol. 2016 Aug;17(4):341-56. doi: 10.1007/s10162-016-0570-z. Epub 2016 May 24. J Assoc Res Otolaryngol. 2016. PMID: 27220769 Free PMC article.
-
Sixty Years of Frequency-Domain Monaural Speech Enhancement: From Traditional to Deep Learning Methods.Trends Hear. 2023 Jan-Dec;27:23312165231209913. doi: 10.1177/23312165231209913. Trends Hear. 2023. PMID: 37956661 Free PMC article. Review.
Cited by
-
Level differences impact the fusion of concurrent vowels dissimilarly within versus across ears.JASA Express Lett. 2022 Sep;2(9):094401. doi: 10.1121/10.0013996. Epub 2022 Sep 7. JASA Express Lett. 2022. PMID: 36097604 Free PMC article.
-
Fusion of dichotic consonants in normal-hearing and hearing-impaired listenersa).J Acoust Soc Am. 2024 Jan 1;155(1):68-77. doi: 10.1121/10.0024245. J Acoust Soc Am. 2024. PMID: 38174963 Free PMC article.
-
Onset Asynchrony: Cue to Aid Dichotic Vowel Segregation in Listeners With Normal Hearing and Hearing Loss.J Speech Lang Hear Res. 2022 Jul 18;65(7):2709-2719. doi: 10.1044/2022_JSLHR-21-00411. Epub 2022 Jun 21. J Speech Lang Hear Res. 2022. PMID: 35728021 Free PMC article.
-
A one-man bilingual cocktail party: linguistic and non-linguistic effects on bilinguals' speech recognition in Mandarin and English.Cogn Res Princ Implic. 2024 Jun 5;9(1):35. doi: 10.1186/s41235-024-00562-w. Cogn Res Princ Implic. 2024. PMID: 38834918 Free PMC article.
-
Sequential auditory grouping reduces binaural pitch fusion in listeners with normal hearing, hearing aids, and cochlear implantsa).J Acoust Soc Am. 2024 Nov 1;156(5):3217-3231. doi: 10.1121/10.0034366. J Acoust Soc Am. 2024. PMID: 39535240
References
-
- Boersma P, Weenink D. Praat: doing phonetics by computer [Computer program] Version. 2016;6:22.
Publication types
MeSH terms
Grants and funding
LinkOut - more resources
Full Text Sources
Other Literature Sources
Research Materials
