. 2021:29:786-795.
doi: 10.1109/TNSRE.2021.3074154. Epub 2021 May 3.

Optimizing Exoskeleton Assistance for Faster Self-Selected Walking

Optimizing Exoskeleton Assistance for Faster Self-Selected Walking

Seungmoon Song et al. IEEE Trans Neural Syst Rehabil Eng. 2021.

Abstract

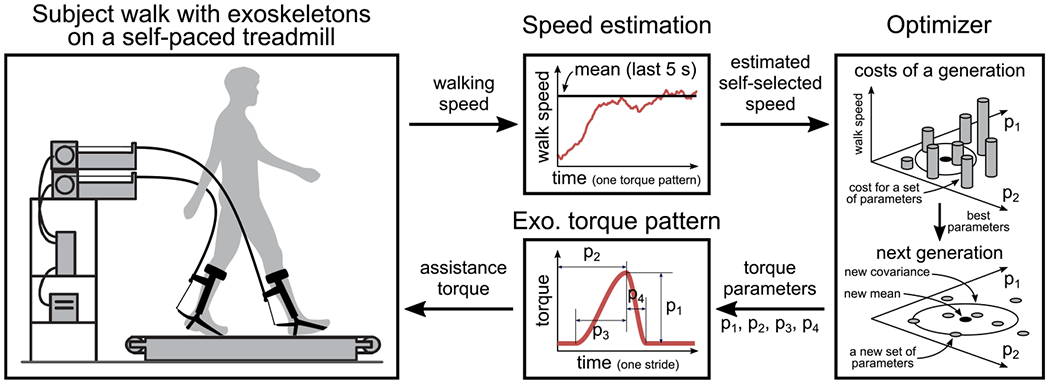
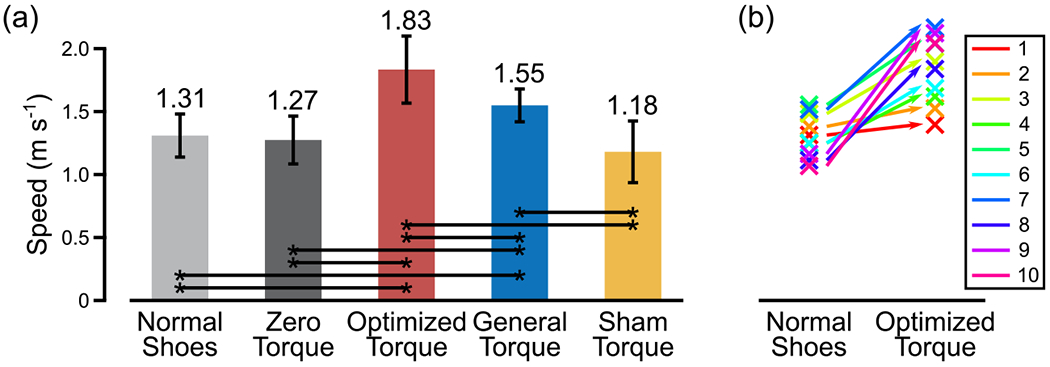
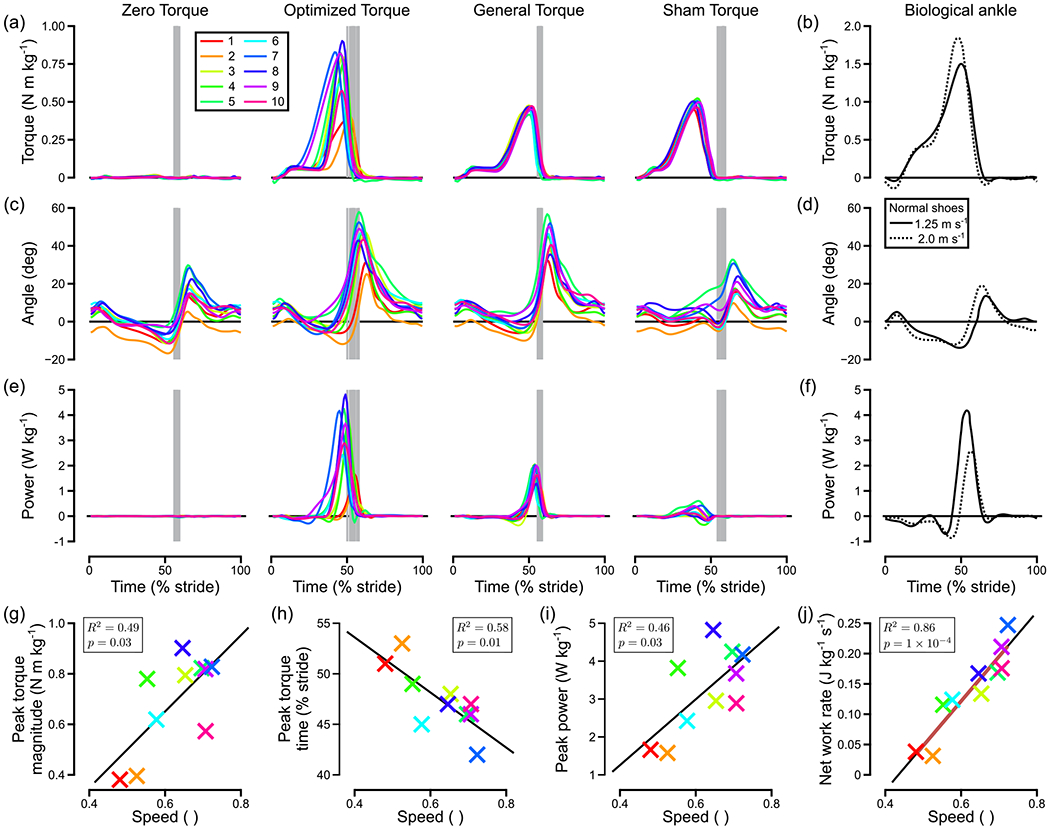
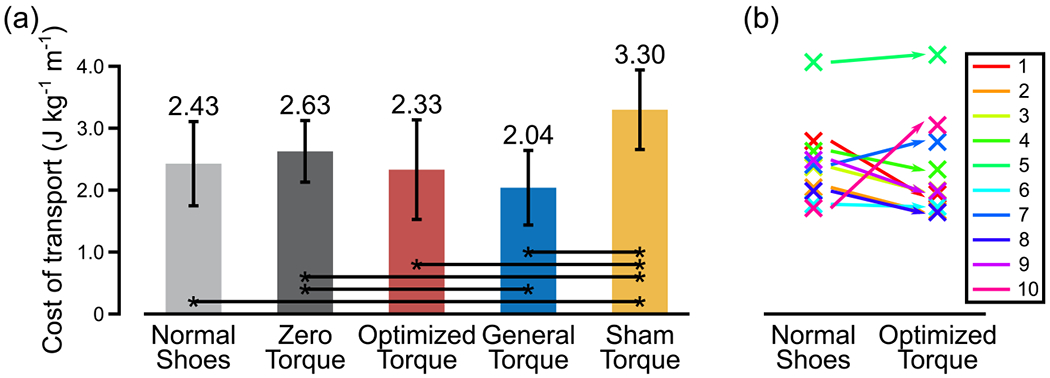
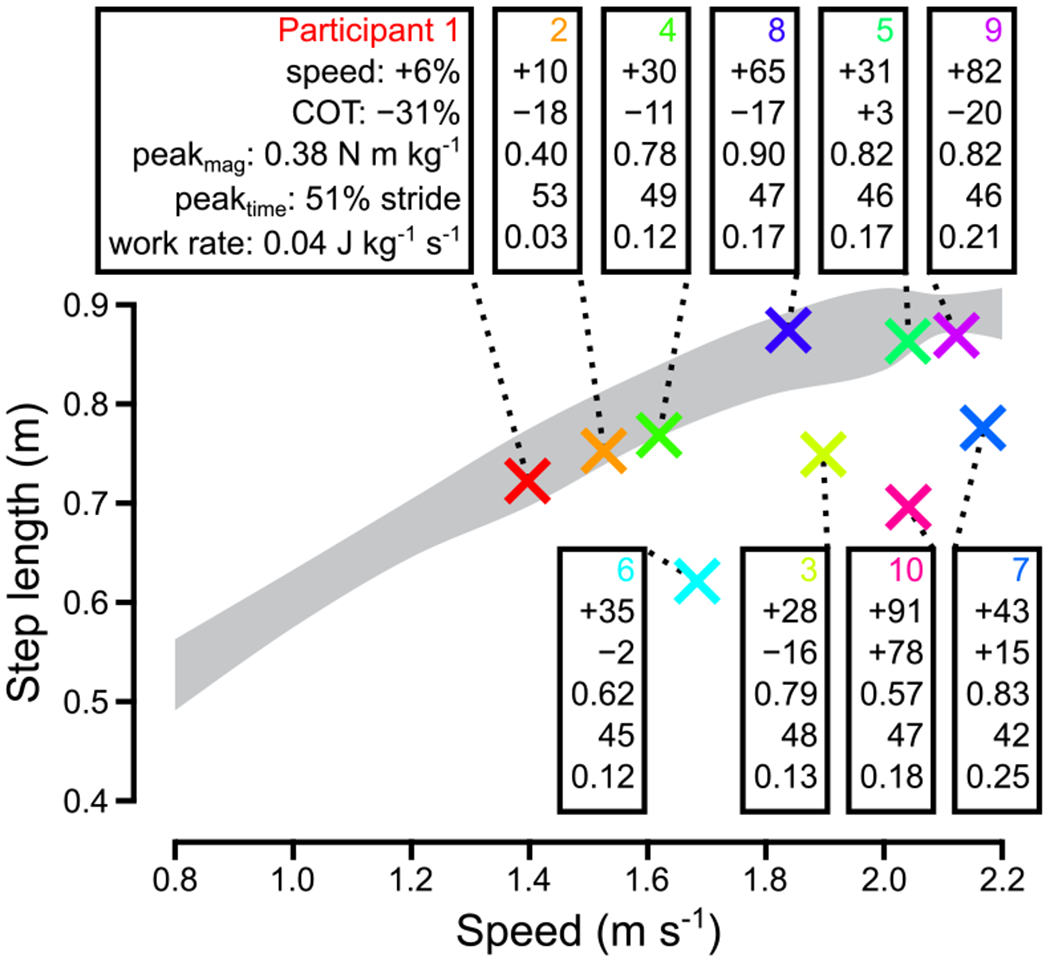
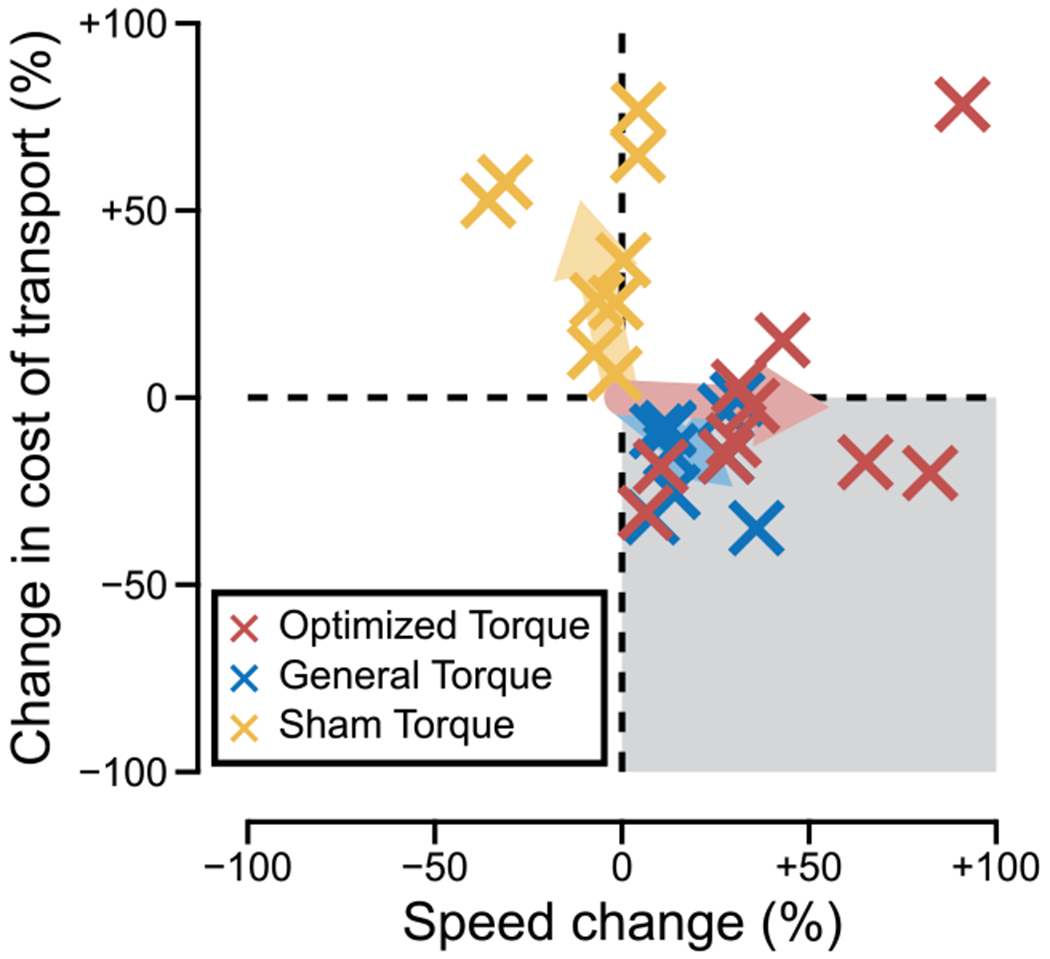
Self-selected walking speed is an important aspect of mobility. Exoskeletons can increase walking speed, but the mechanisms behind these changes and the upper limits on performance are unknown. Human-in-the-loop optimization is a technique for identifying exoskeleton characteristics that maximize the benefits of assistance, which has been critical to achieving large improvements in energy economy. In this study, we used human-in-the-loop optimization to test whether large improvements in self-selected walking speed are possible through ankle exoskeleton assistance. Healthy participants (N =10) were instructed to walk at a comfortable speed on a self-paced treadmill while wearing tethered ankle exoskeletons. An algorithm sequentially applied different patterns of exoskeleton torque and estimated the speed-optimal pattern, which was then evaluated in separate trials. With torque optimized for speed, participants walked 42% faster than in normal shoes (1.83 ms-1 vs. 1.31 ms-1; Tukey HSD, p = 4 ×10⁻⁸ ), with speed increases ranging from 6% to 91%. Participants walked faster with speed-optimized torque than with torque optimized for energy consumption (1.55 ms-1) or torque chosen to induce slow walking (1.18 ms-1). Gait characteristics with speed-optimized torque were highly variable across participants, and changes in metabolic cost of transport ranged from a 31% decrease to a 78% increase, with a decrease of 2% on average. These results demonstrate that ankle exoskeletons can facilitate large increases in self-selected walking speed, which could benefit older adults and others with reduced walking speed.


Figures

Fig. 1.
Fig. 1.
Human-in-the-loop optimization approach used to estimate speed-optimal exoskeleton torque patterns. The box on the left represents the experimental setup, in which a participant walked on a self-paced treadmill while wearing tethered ankle exoskeletons. The boxes at right depict the optimization process conceptually. The exoskeletons applied a torque pattern (bottom center) defined by four control parameters (p1: peak magnitude, p2: peak time, p3: rise time, and p4: fall time). For each torque pattern, speed was estimated as the average treadmill speed in the final 5 s of a 1 min trial. After a set of torque patterns had been evaluated, forming one generation, the optimizer used the results to create a new generation for evaluation.
Fig. 2.
Fig. 2.
Self-selected walking speed. (a) Mean (bars) and standard deviation (whiskers) of self-selected walking speed under each condition. Lines with asterisks denote statistically significant differences (Tukey HSD, α = 0.05). (b) Changes in walking speed between Normal Shoes and Optimized Torque conditions for individual participants. Participant numbers are in order of percent change in speed, where Participant 1 showed the smallest increase (6%) and Participant 10 showed the largest (91%). Participant numbers are consistent with Figs. 3 and 4.
Fig. 3.
Fig. 3.
Exoskeleton mechanics. (a) Ankle exoskeleton torque measured during walking with Zero Torque, Optimized Torque, General Torque, and Sham Torque. Torques are normalized to body mass. X-axes represent heel-strike to heel-stride, and the vertical gray lines indicate toe-off, which varied across participants. (b) Biological ankle torque during normal and fast walking in normal shoes reported in [36]. Note the different scale of the y-axis from that of exoskeleton torques. (c) Exoskeleton joint angle measured during walking. Exoskeleton joint angle may not be identical to biological ankle angle because of misalignment between the axes of rotation [32]. An angular threshold for applying torque was set based on each participant’s range of motion for safety. (d) Biological ankle angle during normal and fast walking in normal shoes reported in [36]. (e) Exoskeleton ankle power calculated by multiplying torque by joint velocity and normalized to body mass. (f) Biological ankle power during normal and fast walking in normal shoes reported in [36]. (g)–(j) Correlation between self-selected walking speed and mechanics of optimized exoskeleton assistance (peak torque magnitude, peak torque time, peak power magnitude, and network rate). Walking speed is nondimensionalized as v^=v/gl (g: gravitational acceleration, l: leg length) to compensate for different leg lengths. The black lines and boxes show the fitted linear models and their square of correlation coefficients (R2) and p-values (p). Network rate is calculated as the time integral of power normalized to body mass divided by stride time. The correlation analysis between all the exoskeleton mechanics values and self-selected walking speed and speed changes from Normal Shoes are reported in Table S1.
Fig. 4.
Fig. 4.
Metabolic cost of transport. (a) Mean (bars) and standard deviation (whiskers) of the cost of transport measured during walking with Normal Shoes, Zero Torque, Optimized Torque, General Torque, and Sham Torque. Lines with asterisks denote statistically significant differences (Tukey HSD, α = 0.05). (b) Changes in the cost of transport between Normal Shoes and Optimized Torque conditions for individual participants. Responses ranged from a 31% decrease to a 78% increase.
Fig. 5.
Fig. 5.
Step length versus walking speed for individual participants. Each data point indicates average step length and walking speed with Optimized Torque for one participant. Boxes provide the change in speed relative to Normal Shoes, change in cost of transport relative to Normal Shoes, peak torque magnitude with Optimized Torque (peakmag), peak time with Optimized Torque (peaktime), and network rate for the associated participant. The gray shaded area indicates ±1 standard deviation for healthy adults in normal shoes reported in [41].
Fig. 6.
Fig. 6.
Change in self-selected walking speed and cost of transport. Arrows show the mean changes for each condition. The gray shaded area indicates increase in speed and reduction in cost of transport, which would be desirable for practical exoskeleton assistance.

Similar articles

Cited by

References

    1. Esquenazi A, Talaty M, and Jayaraman A, “Powered exoskeletons for walking assistance in persons with central nervous system injuries: A narrative review,” PM&R, vol. 9, no. 1, pp. 46–62, January. 2017. - PubMed
    1. Riener R, “The cybathlon promotes the development of assistive technology for people with physical disabilities,” J. Neuroeng. Rehabil, vol. 13, no. 1, p. 49, December. 2016. - PMC - PubMed
    1. Malcolm P, Derave W, Galle S, and De Clercq D, “A simple exoskeleton that assists plantarflexion can reduce the metabolic cost of human walking,” PLoS ONE, vol. 8, no. 2, Feb. 2013, Art. no. e56137. - PMC - PubMed
    1. Mooney LM and Herr HM, “Biomechanical walking mechanisms underlying the metabolic reduction caused by an autonomous exoskeleton,” J. Neuroeng. Rehabil, vol. 13, no. 1, December. 2016. - PMC - PubMed
    1. Zhang J et al., “Human-in-the-loop optimization of exoskeleton assistance during walking,” Science, vol. 356, no. 6344, pp. 1280–1284, June. 2017. - PubMed

Publication types