. 2021 Apr;18(177):20210063.
doi: 10.1098/rsif.2021.0063. Epub 2021 Apr 21.

Managing the risk of a COVID-19 outbreak from border arrivals

Affiliations

Managing the risk of a COVID-19 outbreak from border arrivals

Nicholas Steyn et al. J R Soc Interface. 2021 Apr.

Abstract

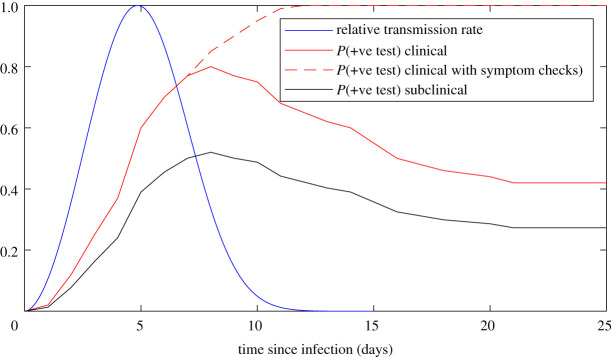
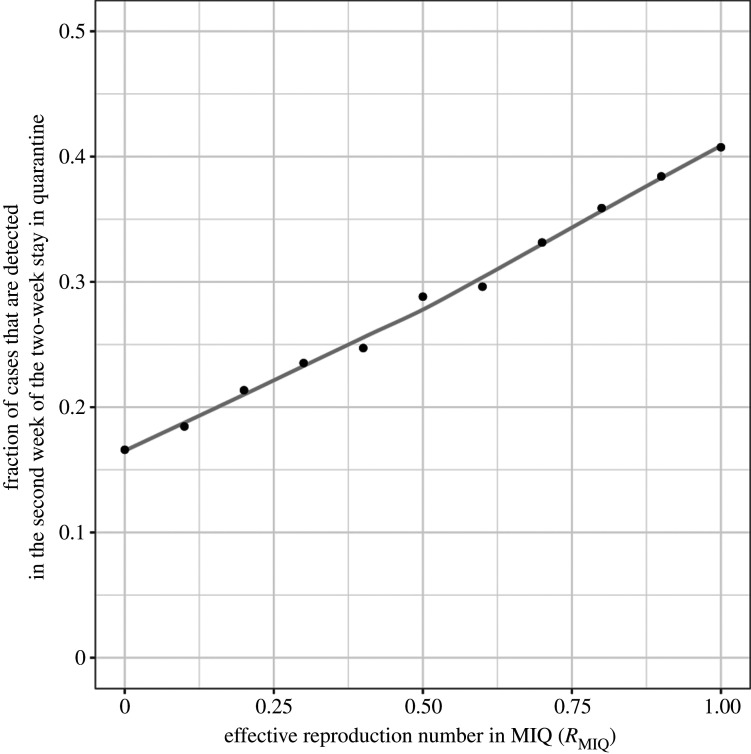
In an attempt to maintain the elimination of COVID-19 in New Zealand, all international arrivals are required to spend 14 days in government-managed quarantine and to return a negative test result before being released. We model the testing, isolation and transmission of COVID-19 within quarantine facilities to estimate the risk of community outbreaks being seeded at the border. We use a simple branching process model for COVID-19 transmission that includes a time-dependent probability of a false-negative test result. We show that the combination of 14-day quarantine with two tests is highly effective in preventing an infectious case entering the community, provided there is no transmission within quarantine facilities. Shorter quarantine periods, or reliance on testing only with no quarantine, substantially increases the risk of an infectious case being released. We calculate the fraction of cases detected in the second week of their two-week stay and show that this may be a useful indicator of the likelihood of transmission occurring within quarantine facilities. Frontline staff working at the border risk exposure to infected individuals and this has the potential to lead to a community outbreak. We use the model to test surveillance strategies and evaluate the likely size of the outbreak at the time it is first detected. We conclude with some recommendations for managing the risk of potential future outbreaks originating from the border.

Keywords: infectious disease outbreak; managed isolation and quarantine; stochastic model.


Figures

Figure 1.
Figure 1.
Model transmission rate relative to peak transmission rate (blue), probability of testing positive by RT–PCR test for clinical cases (solid red), probability of testing positive by RT–PCR test with additional symptom checks by a health professional (dashed red) and probability of testing positive by RT–PCR test for subclinical infections (black), as a function of time since infection. The transmission rate function is a Weibull distribution with the mean 5.0 days and standard deviation 1.9 days [14]. The probability of testing positive by RT–PCR test is based on the results of [13]. The addition of symptom checks is assumed to increase the probability of testing positive due to the diagnosis of probable cases based on clinical symptoms.
Figure 2.
Figure 2.
The probability per infected arrival of an individual being released into the community while (a) infectious (within 14 days of exposure) or (b) very infectious (within 5 days of exposure) under four different quarantine and testing policies, and for different rates of transmission within quarantine facilities: no transmission (RMIQ = 0), moderate transmission (RMIQ = 0.1) and high transmission (RMIQ = 0.5).
Figure 3.
Figure 3.
The proportion of cases detected in quarantine that are detected in the second week of a two-week stay is an increasing function of the transmission rate in quarantine facilities, measured by the within-quarantine reproduction number RMIQ. Results are for the 14-day quarantine regime with scheduled day 3 and day 12 testing.
Figure 4.
Figure 4.
Expected number of infected individuals in the community (in addition to the seed case) when the first case is detected, under (a) high community awareness and (b) low community awareness. This decreases significantly with increased testing of frontline workers and improved community awareness. Expected value (×) and interquartile range from 10 000 simulations (error bars) are shown. Note that all error bars extend down to zero, meaning that at least 25% of simulations produced zero additional infections.
Figure 5.
Figure 5.
The probability of an outbreak dying out before it is detected (not detected), being detected in the original frontline worker (seed case) or being detected in a secondary case or later, under different testing regimes and (a) high community awareness and (b) low community awareness. When there is a regular testing regime for frontline workers, the probability of an outbreak being detected in the seed case is high.
Figure 6.
Figure 6.
Expected number of infected individuals in the community (in addition to the seed case) when the outbreak is first detected depending on whether it is first detected in the seed case or in a secondary or later case, under different testing regimes and (a) high community awareness and (b) low community awareness. Outbreaks detected in a secondary rather than seed case will be significantly larger. Expected value (×) and interquartile range from 10 000 simulations (error bars) are shown.
Figure 7.
Figure 7.
Risk of an infected individual having travelled from region A to region B before the outbreak is first detected as a function of the travel rate (daily probability of an individual in region A travelling to region B). The different curves show different levels of community awareness (red, high awareness; blue, low awareness) and different detection settings (first detected in frontline worker, solid; first detected elsewhere, dashed). Horizontal black bars indicate an illustrative range of travel rates for three New Zealand regional scenarios: outbreak detected in the North Island, risk of an infected individual having travelled to the South Island (NI → SI); outbreak detected in the South Island, risk of an infected individual having travelled to the North Island (SI → NI); outbreak detected in the Auckland region, risk of an infected individual having travelled outside the Auckland region (Akl → other). Assumed travel volumes per day: between the North and South Islands 7000–8500; between Auckland and the rest of New Zealand 35 000–45 000. Population sizes: North Island 3.75 million; South Island 1.25 million; Auckland region 1.6 million.

References

    1. World Health Organization. 2020. Coronavirus disease 2019 (COVID-19): situation report, 51. Geneva, Switzerland: World Health Organization.
    1. Baker MG, Wilson N, Anglemyer A. 2020. Successful elimination of Covid-19 transmission in New Zealand. N. Engl. J. Med. 383, e56. (10.1056/NEJMc2025203) - DOI - PMC - PubMed
    1. Cousins S. 2020. New Zealand eliminates COVID-19. Lancet 395, 1474. (10.1016/S0140-6736(20)31097-7) - DOI - PMC - PubMed
    1. Clifford S, et al. . 2020. Strategies to reduce the risk of SARS-CoV-2 re-introduction from international travellers. medRxiv. (10.1101/2020.07.24.20161281) - DOI
    1. Golding N, et al. . 2020. Estimating temporal variation in transmission of SARS-CoV-2 and physical distancing behaviour in Australia. Melbourne, Australia: Doherty Institute.

Publication types

LinkOut - more resources