. 2021 Apr 29;184(9):2471-2486.e20.
doi: 10.1016/j.cell.2021.03.011. Epub 2021 Apr 19.

The bone microenvironment invigorates metastatic seeds for further dissemination

Affiliations

The bone microenvironment invigorates metastatic seeds for further dissemination

Weijie Zhang et al. Cell. .

Abstract

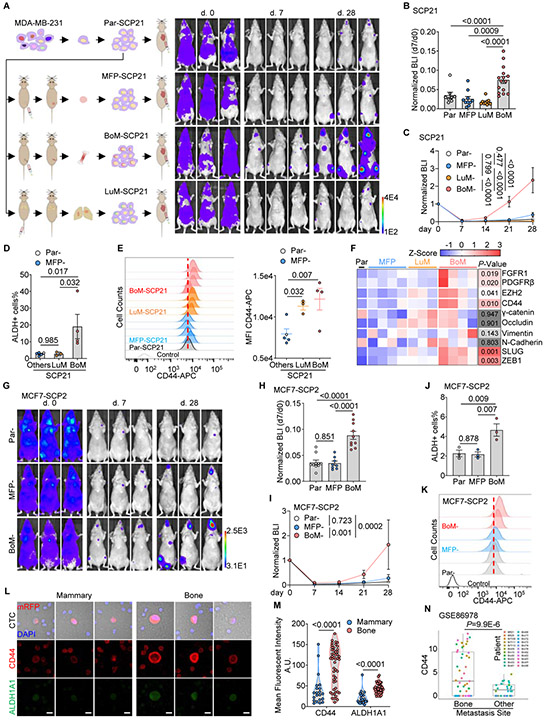
Metastasis has been considered as the terminal step of tumor progression. However, recent genomic studies suggest that many metastases are initiated by further spread of other metastases. Nevertheless, the corresponding pre-clinical models are lacking, and underlying mechanisms are elusive. Using several approaches, including parabiosis and an evolving barcode system, we demonstrated that the bone microenvironment facilitates breast and prostate cancer cells to further metastasize and establish multi-organ secondary metastases. We uncovered that this metastasis-promoting effect is driven by epigenetic reprogramming that confers stem cell-like properties on cancer cells disseminated from bone lesions. Furthermore, we discovered that enhanced EZH2 activity mediates the increased stemness and metastasis capacity. The same findings also apply to single cell-derived populations, indicating mechanisms distinct from clonal selection. Taken together, our work revealed an unappreciated role of the bone microenvironment in metastasis evolution and elucidated an epigenomic reprogramming process driving terminal-stage, multi-organ metastases.

Keywords: EZH2; bone metastasis; circulating tumor cells; disseminated tumor cells; epigenomic reprograming; evolving barcodes; organ tropism; plasticity; secondary metastasis; stemness.


Conflict of interest statement

Declaration of interests The authors declare no competing interests.

Figures

Figure 1.
Figure 1.. Multi-organ metastases in mice with bone lesions
(A) Diagram of intra-iliac artery (IIA) injection and representative bioluminescent images (BLI) showing the in vivo distribution of tumor cells after IIA injection of 1E5 MDA-MB-231 fLuc-mRFP cells. . (B-C) Representative ex vivo BLI images (B), and PET-μCT (C) on hindlimbs and other tissues of the same animal with MDA-MB-231 cells inoculated in the right hindlimb after 8 weeks. R.H, Right Hindlimb; Lu, Lung; L.H, Left Hindlimb; Li, Liver; Ki, Kidney; Sp, Spleen; Br, Brain; Ve, Vertebrae; F.L, Forelimbs; Ri, Ribs; St, Sternum; Cr, Cranium. (D-E) Representative immunofluorescent images of tumor lesions in various bones (D) and other organs (E). To obtain complete views of entire organs, smaller fields were acquired in tiles by mosaic scanning and then stitched by Zen. Scale bar, 20 μm. (F-H) Representative BLI images of animals and tissues after IIA injection of 2E5 prostate cancer cells PC3 (F), 1E5 ER+ breast cancer cells MCF7 (G), and 1E5 murine mammary carcinoma cells AT-3 (H) at the indicated time. (I) Diagram of intra-femoral injection (IF) (Left) and representative ex vivo BLI images of tissues from animals received 1E5 MDA-MB-231 cells (Middle) or AT-3 cells (Right) via IF injection. (J-K) Heat map of ex vivo BLI intensity and status of metastatic involvement on various types of tissues from animals carried MDA-MB-231 (J) and AT-3 (K) bone tumors. Columns, individual animal; rows, various tissues or status of multi-site metastases; Gray, no detectable lesion. N (# of mice): MDA-MB-231, 16 (IIA), 11 (IF); AT-3, 10 (IIA), 10 (IF). P values were assessed by Fisher’s exact test on the ratio of metastasis while by Mann-Whitney test on the tumor burden. See also Figure S1.
Figure 2.
Figure 2.. Bone microenvironment promotes further metastasis
(A) Diagram of intra-iliac vein (IIV) injection, and representative BLI images of animals and tissues 8 weeks after IIV injection of 1E5 MDA-MB-231 cells. (B) Diagram of mammary fat pad (MFP) implantation, and representative BLI images of animals and tissues 8 weeks after MFP implantation of 1E5 MDA-MB-231 cells. (C-D) Comparison of metastatic pattern and tumor burden (C) and the ratio of multi-site metastasis (D) in animals with bone (IIA/IF), lung (IIV) or mammary (MFP) tumors of MDA-MB-231 cells. N (# of mice) = 27 (Bone); 18 (MFP); 10 (Lung). (E-F) Comparison of metastatic pattern and tumor burden (E) and the ratio of multi-site metastasis (F) in animals with bone (IIA/IF), lung (IIV) or mammary (MFP) tumors of AT-3 cells. N (# of mice) = 20 (Bone); 11 (MFP); 9 (Lung). (G-H) Comparison of metastatic pattern and tumor burden (G) and the ratio of multi-site metastasis (H) in animals with bone (IIA), lung (IIV) or mammary (MFP or MIND) tumors of MCF7 cells. N (# of mice) = 8 (Bone); 10 (MFP); 13 (MIND); 9 (Lung). P values were assessed by Chi-square test in C-H on the ratio of metastasis; by uncorrected Dunn’s test following Kruskal-Wallis test in C, E and H on the tumor burden. See also Figure S2.
Figure 3.
Figure 3.. Cross-seeding and parabiosis experiments support the promoting effects of bone microenvironment on further dissemination
(A) Experimental design of cross-seeding experiment between mammary and bone tumors of mRFP or EGFP tagged MDA-MB-231 cells. Upper, mRFP (IIA), EGFP (MFP); lower, EGFP (IIA), mRFP (MFP). (B) Representative confocal images showing the cross-seeding between bone and mammary tumors. Scale bar, 20 μm. N (# of mice) = 5 for each arm. (C) Incidence of cross-seeding between bone and mammary tumors. (D) Experimental design of parabiosis models to compare the metastatic capacity of bone and mammary tumors. N (# of mice) = 17 (BoM); 19 (MFP). (E) Representative BLI images of metastatic lesions in recipient mice parabiotic with mice bearing bone metastases. (F) Ratio of recipients with metastasis in bone and mammary tumor groups, as determined by BLI imaging. (G)Representative immunofluorescent images on tissues from recipients of bone tumor group. To obtain complete views of entire organs, smaller fields were acquired in tiles by mosaic scanning and then stitched by Zen. Scale bar, 20 μm. Tissues from 6 animals were examined. P value was assessed by Fisher’s exact test in C and F. See also Figure S3.
Figure 4.
Figure 4.. In vivo barcoding of spontaneous metastases with hgRNAs
(A) Principle of the evolving barcode system comprised of hgRNAs and inducible Crispr-Cas9. (B) Ratio of unmutated barcode and Shannon entropy in MDA-MB-231 cells upon multiple rounds of doxycycline treatment in vitro. (C) Schematics showing the rationale of using evolving barcodes to infer the evolution of metastatic lesions and the timing of seeding events. Barcode diversity decreases during the seeding process. Children metastases inherit a subset of signature barcodes from parental tumors. Upon Cas9 activation, barcodes start evolving and regain diversity. Diversity of barcodes can therefore infer the relative timing of seeding, and phylogenetically related metastases share a subset of signature barcodes. (D-E) Design of in vivo barcoding experiment (D) and representative BLI images (E) of metastatic lesions from MDA-MB-231 tumors. (F) Feature matrix of mutation events in MDA-MB-231 metastatic samples. See also Figure S4 and Supplementary Table 1.
Figure 5.
Figure 5.. NMF analysis of evolving barcodes delineates metastatic spread
(A-B) Plots of NMF rank survey, consensus matrix, basis components matrix and mixture coefficients matrix of 200 NMF runs on the barcodes from MDA-MB-231 metastatic lesions. (C) Body map depicting the basis composition of MDA-MB-231 metastatic lesions. (D) Chord diagrams illustrating the composition flow of barcode mutations between primary tumors and selected MDA-MB-231 metastatic lesions. (E) Correlation plot of Shannon entropy and tumor burden on MDA-MB-231 samples. The tumor burden was indicated by human genomic content determined by q-PCR. Spearman r and p value was indicated. See also Figure S5.
Figure 6.
Figure 6.. Bone-entraining boosts the metastatic capacity of single cell-derived cancer cells
(A) Experimental design (left) and representative BLI images (right) to test the metastatic capacity of mammary, lung, or bone-entrained SCP21s. (B) Normalized whole-body BLI intensity 7 days after intra-cardiac (IC) injection of same number of MFP-, LuM-, BoM- or Par-SCP21 cells. (C) Colonization kinetics of MFP-, LuM-, BoM- and Par-SCP21 cells after IC injection. N (# of mice) = 8 (Par); 10 (MFP); 15 (BoM); 10 (LuM). (D) Percentage of ALDH+ population in MFP-, LuM-, BoM- and Par-SCP21 cells by flow cytometry. (E) Histogram (left) and median fluorescent intensity (MFI) (right) of surface CD44 protein in MFP-, LuM-, BoM- and Par-SCP21 cells by flow cytometry. (F) Expression levels of proteins in Par- and organ-entrained SCP21s. Protein levels were quantified and converted into Z-score from three or four western blottings. (G-I) Representative BLI images (G), normalized BLI intensity at day 7 (H), and the colonization kinetics (I) of MFP-, BoM-, and Par- MCF7-SCP2 cells after I.C. injection. N (# of mice) = 10 (Par); 8 (MFP); 10 (BoM). (J-K) Percentage of ALDH+ population (J) and expression of surface CD44 (K) in MFP-, BoM-, and Par- MCF7-SCP2 cells by flow cytometry. N (# of repeats) = 3 (J); 2 (K). (L-M) Representative fluorescent images (L) and quantification (M) of CD44 and ALDH1A1 expression on CTCs from NRG mice bearing MDA-MB-231 cells derived mammary or bone tumors. CTCs were pooled from 5 blood samples. Scale bar, 10 μm. (N) Expression levels of CD44 mRNA in CTCs from breast cancer patients with bone metastases or other metastases (GSE86978). Data are represented as mean ± SEM in B, C, D, E, H, I and J. P values were assessed by Fisher’s LSD test following one-way ANOVA test in B, D, E, H, and J; by Fisher’s LSD test post two-way ANOVA test in C and I; by student t-test in F; by Mann-Whitney test in M and N. See also Figure S6.
Figure 7.
Figure 7.. Secondary metastasis from bone lesions is dependent on EZH2 mediated epigenomic reprograming
(A) Levels of EZH2 signature genes (GSVA) in bone entrained and other SCP21 cells. (B) Levels of EZH2 signature genes in bone entrained-SCP21 cells after different passages in vitro. (C) Percentage of ALDH1+ population in bone entrained-SCP21 cells at different passages. (D) Representative western blotting of proteins in bone entrained-SCP21 cells after different passages. (E-G) The schematic diagram and representative BLI images (E), normalized BLI intensity at day 7 (F), and the colonization kinetics (G) of BoM-SCP21 cells with in vitro EPZ011989 (EPZ) treatment before IC injection. Non-treated BoM-SCP21 cells were used as control. N (# of mice) = 15 (-EPZ); 9 (+EPZ). (H) Comparison of ALDH1+ cells in EPZ treated and non-treated BoM-MCF7-SCP2 cells by flow cytometry. N (# of replicate) =3. (I-K) Representative BLI images (I), normalized BLI intensity at day 7 (J), and the colonization kinetics (K) of BoM-MCF7-SCP2 cells with in vitro treatment of EPZ before IC injection. Non-treated BoM-MCF7-SCP2 cells were used as control. N (# of mice) = 10 (-EPZ); 7 (+EPZ). (L) Experimental design assessing the multi-site metastases from bone lesions with inducible depletion of EZH2. (M) Growth kinetics of the primary bone lesions in mice receiving doxycycline or control water, assessed by in vivo BLI imaging. BLI intensities at right hindlimbs were normalized to the mean intensity at day 0. N (# of mice) = 10 for each arm. (N) Heat map of ex vivo BLI intensity and status of metastatic involvement in tissues from animals with EZH2 depleted or control bone metastases. Data are represented as mean ± SEM in F, G, J, K, and M. P values were assessed by student t-test in A, F, and J; by test for linear trend following repeat measure one-way ANOVA in B and C; by LSD test following two-way ANOVA in G, K and M; by ratio paired t-test in H; by Fisher’s exact test on the ratio of metastatic involvement and Mann-Whitney test on BLI intensity in N. See also Figure S7.

Comment in

References

    1. Aceto N, Bardia A, Wittner BS, Donaldson MC, O’Keefe R, Engstrom A, Bersani F, Zheng Y, Comaills V, Niederhoffer K, et al. (2018). AR expression in breast cancer CTCs associates with bone metastases. Mol. Cancer Res 16, 720–727. - PMC - PubMed
    1. Afgan E, Baker D, Batut B, Van Den Beek M, Bouvier D, Ech M, Chilton J, Clements D, Coraor N, Grüning BA, et al. (2018). The Galaxy platform for accessible, reproducible and collaborative biomedical analyses: 2018 update. Nucleic Acids Res. 46, W537–W544. - PMC - PubMed
    1. Al-Hajj M, Wicha MS, Benito-Hernandez A, Morrison SJ, and Clarke MF (2003). Prospective identification of tumorigenic breast cancer cells. Proc. Natl. Acad. Sci. U. S. A 100, 3983–3988. - PMC - PubMed
    1. Alix-Panabières C, Vendrell J-P, Pellé O, Rebillard X, Riethdorf S, Müller V, Fabbro M, and Pantel K (2007). Detection and Characterization of Putative Metastatic Precursor Cells in Cancer Patients. Clin. Chem 53, 537–539. - PubMed
    1. Andor N, Harness JV, Müller S, Mewes HW, and Petritsch C (2014). Expands: Expanding ploidy and allele frequency on nested subpopulations. Bioinformatics 30, 50–60. - PMC - PubMed

Publication types

MeSH terms

Substances