. 2021 May 17;56(10):1437-1451.e3.
doi: 10.1016/j.devcel.2021.03.026. Epub 2021 Apr 19.

Aging-dependent regulatory cells emerge in subcutaneous fat to inhibit adipogenesis

Affiliations

Aging-dependent regulatory cells emerge in subcutaneous fat to inhibit adipogenesis

Hai P Nguyen et al. Dev Cell. .

Abstract

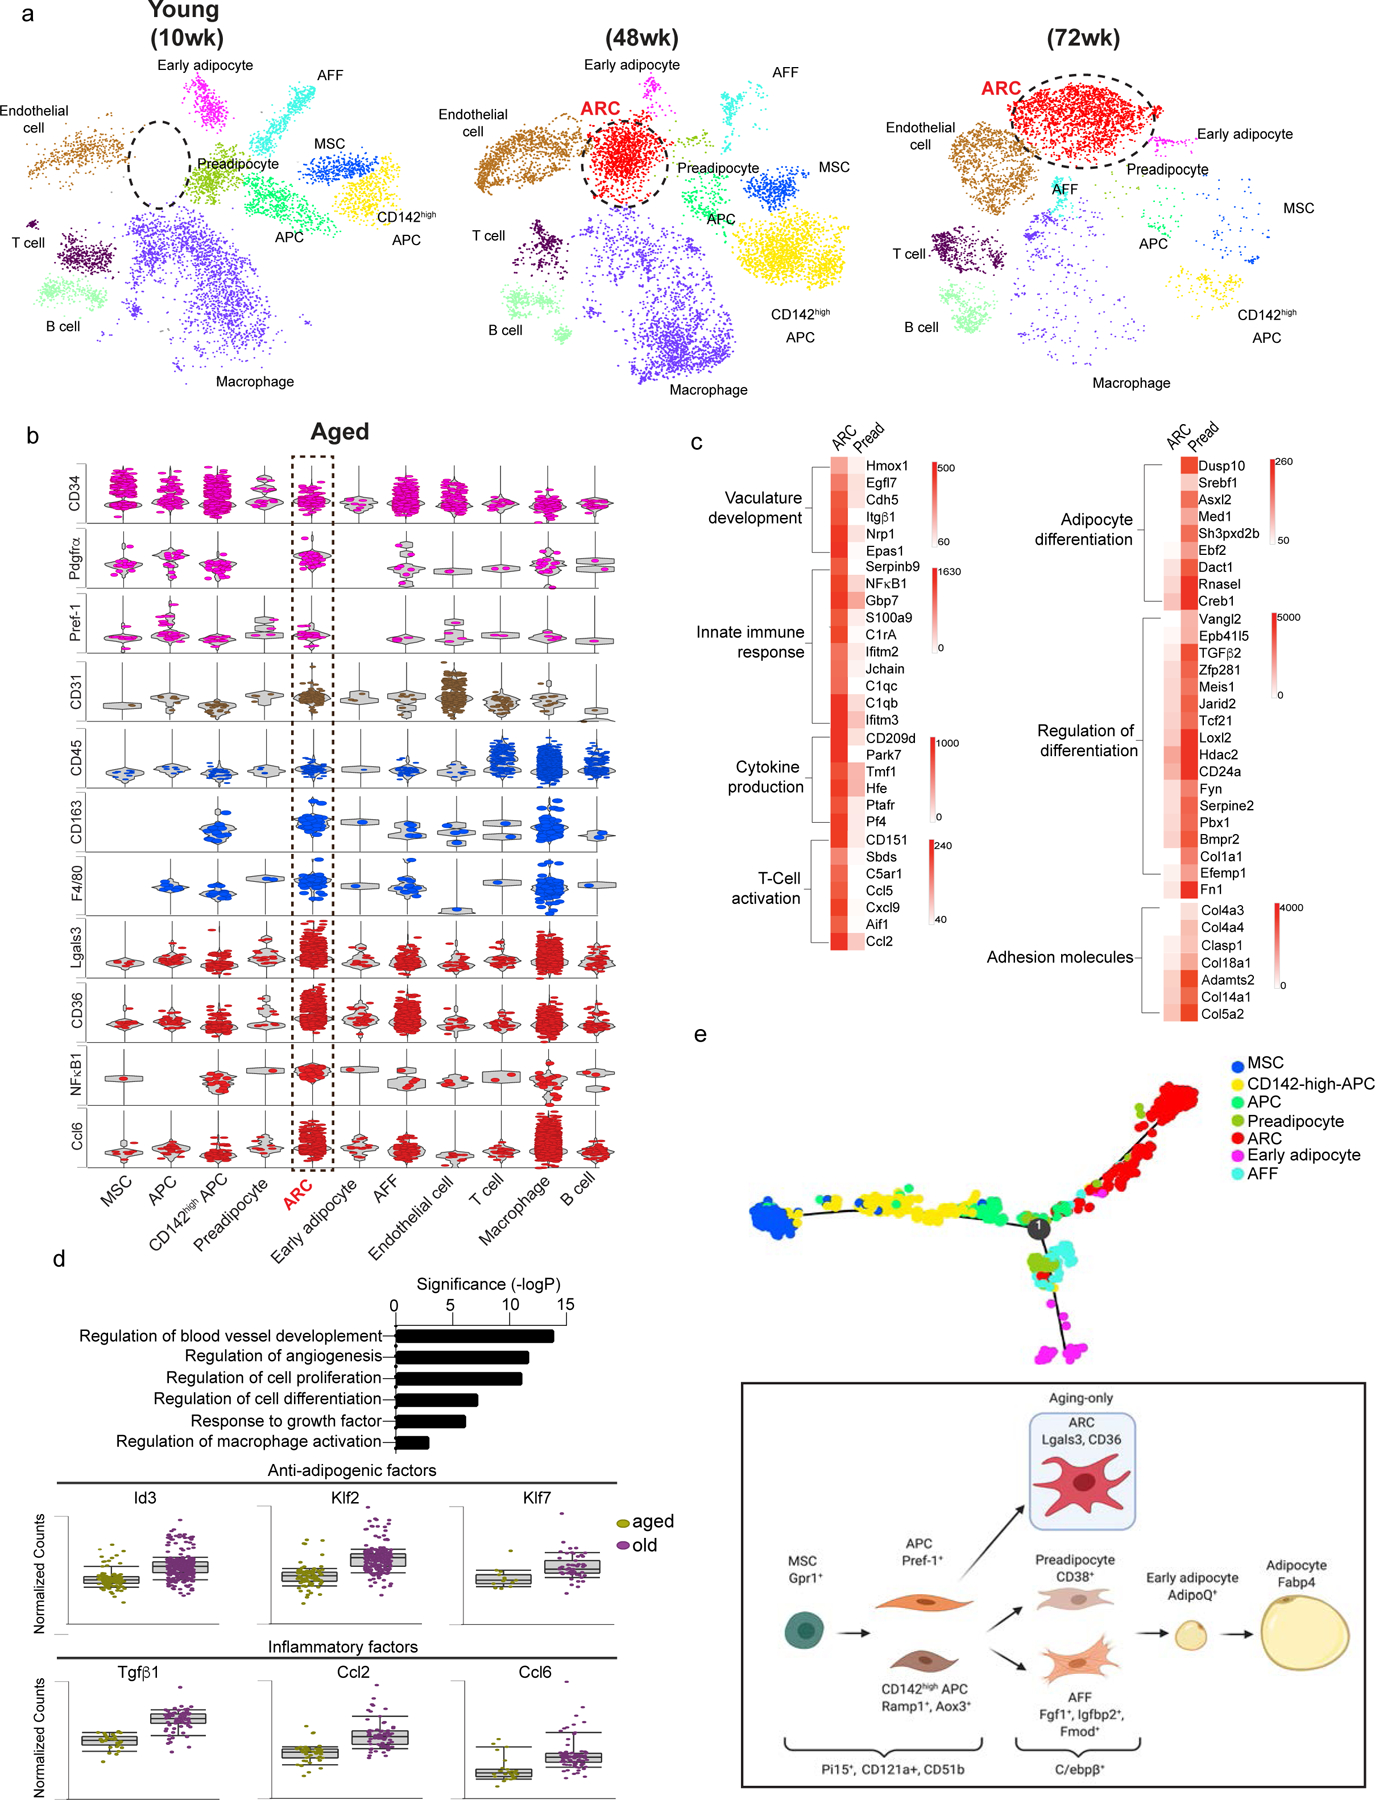
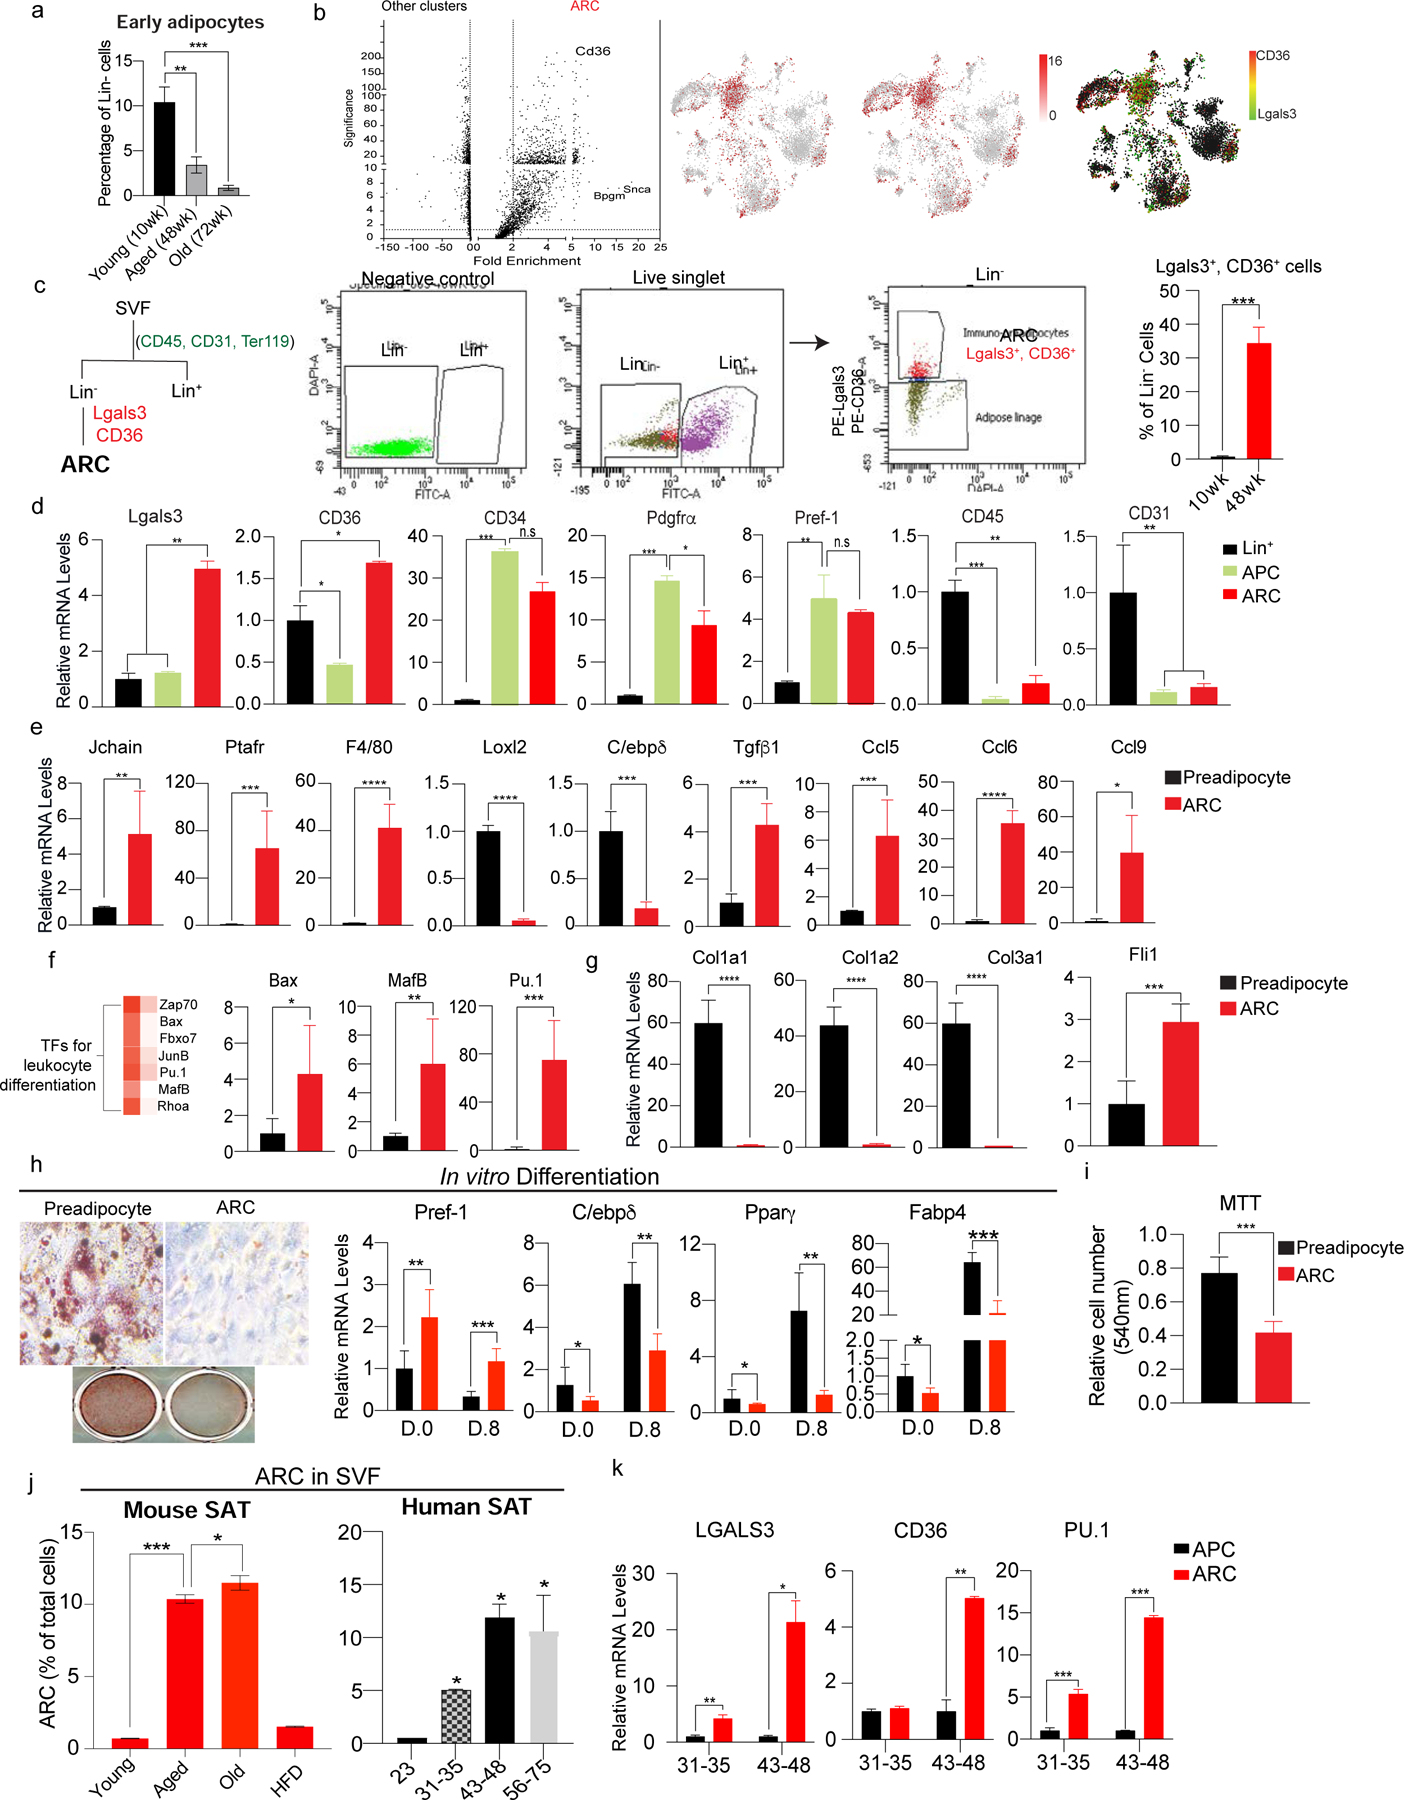
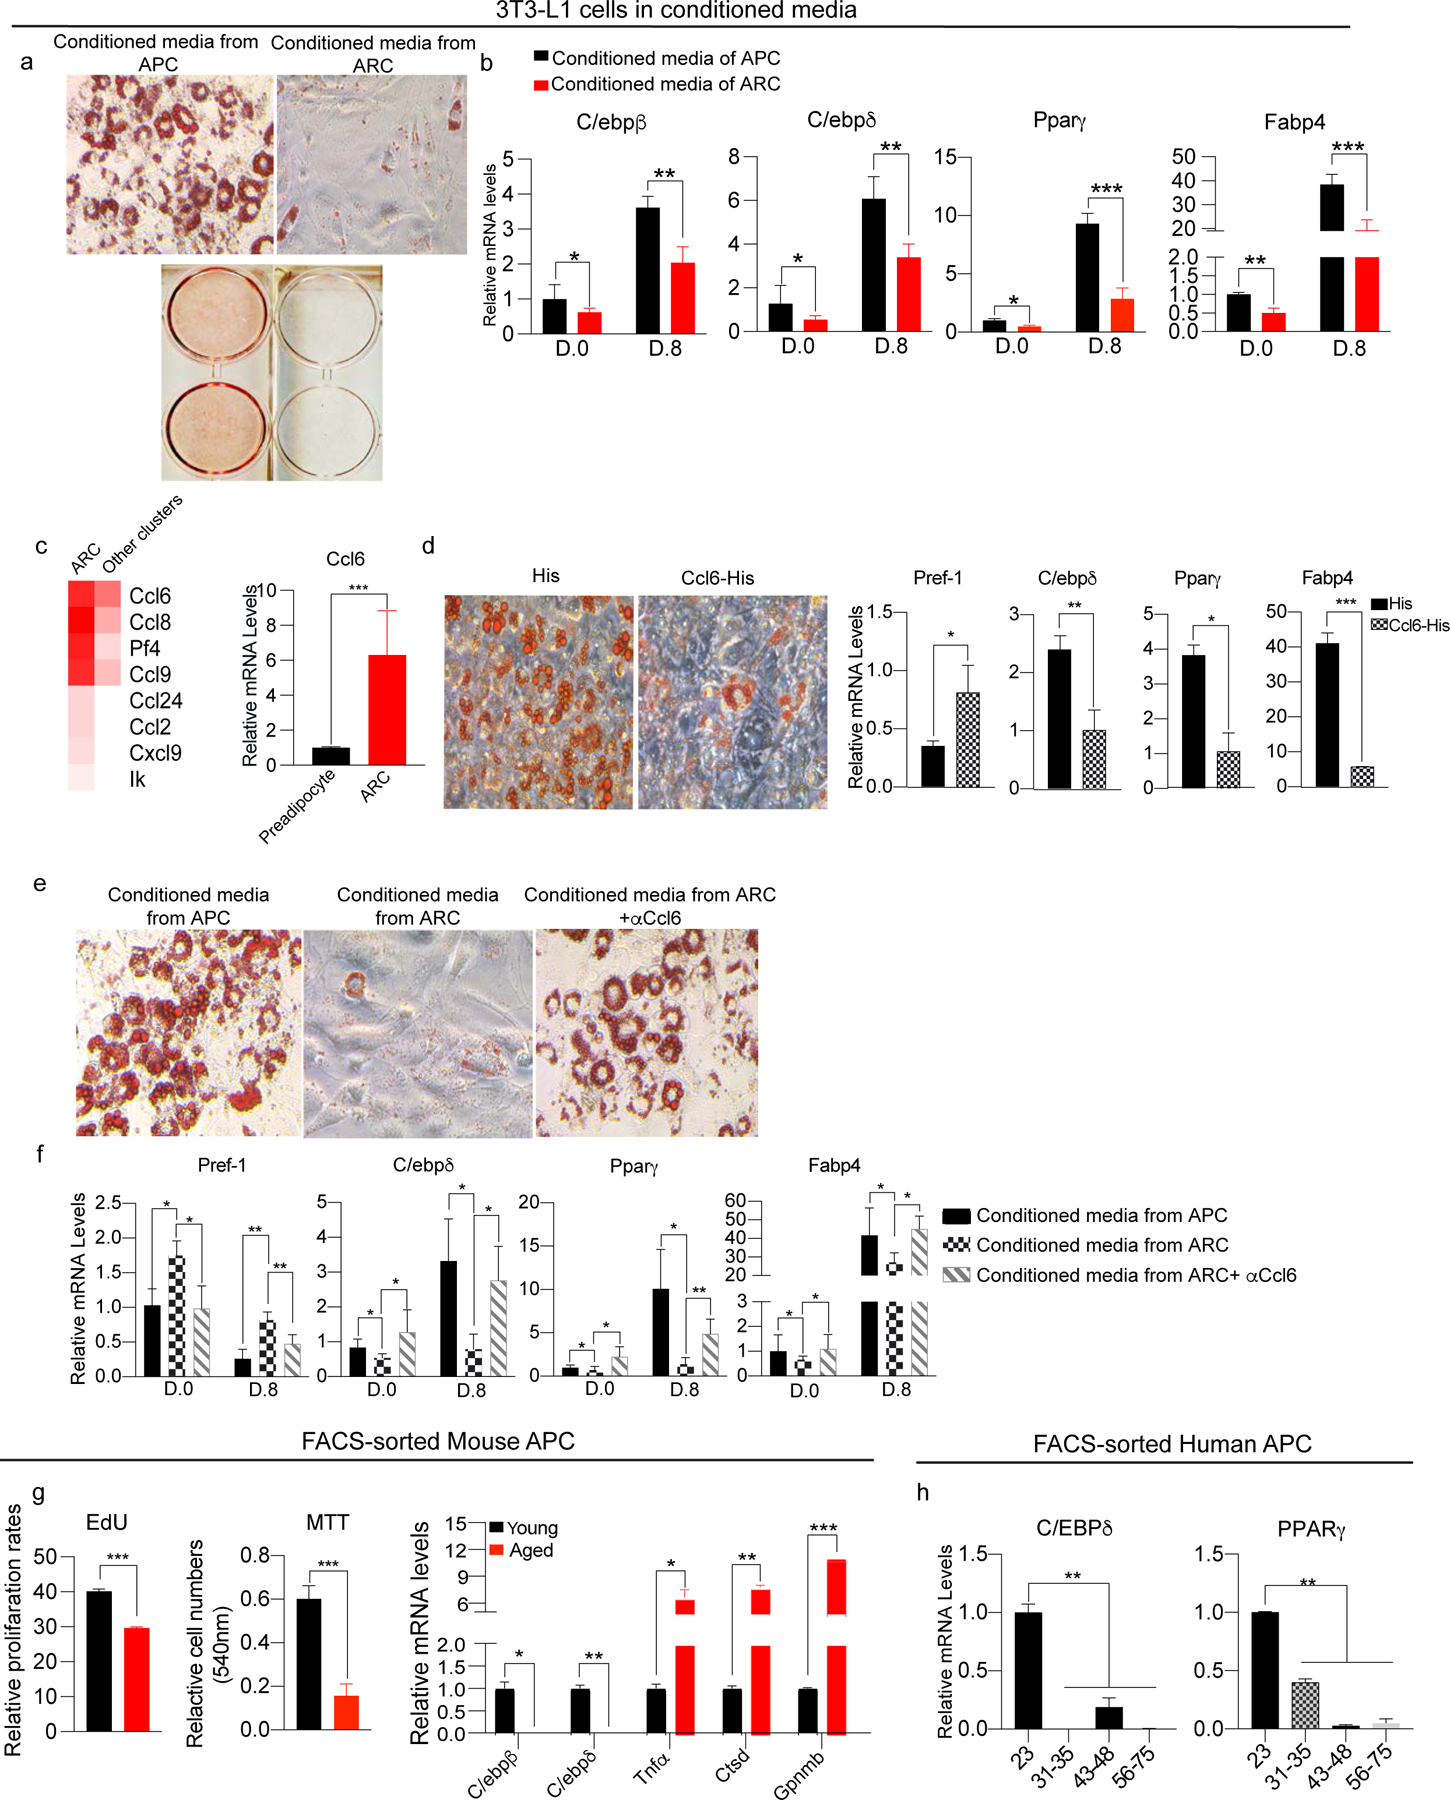
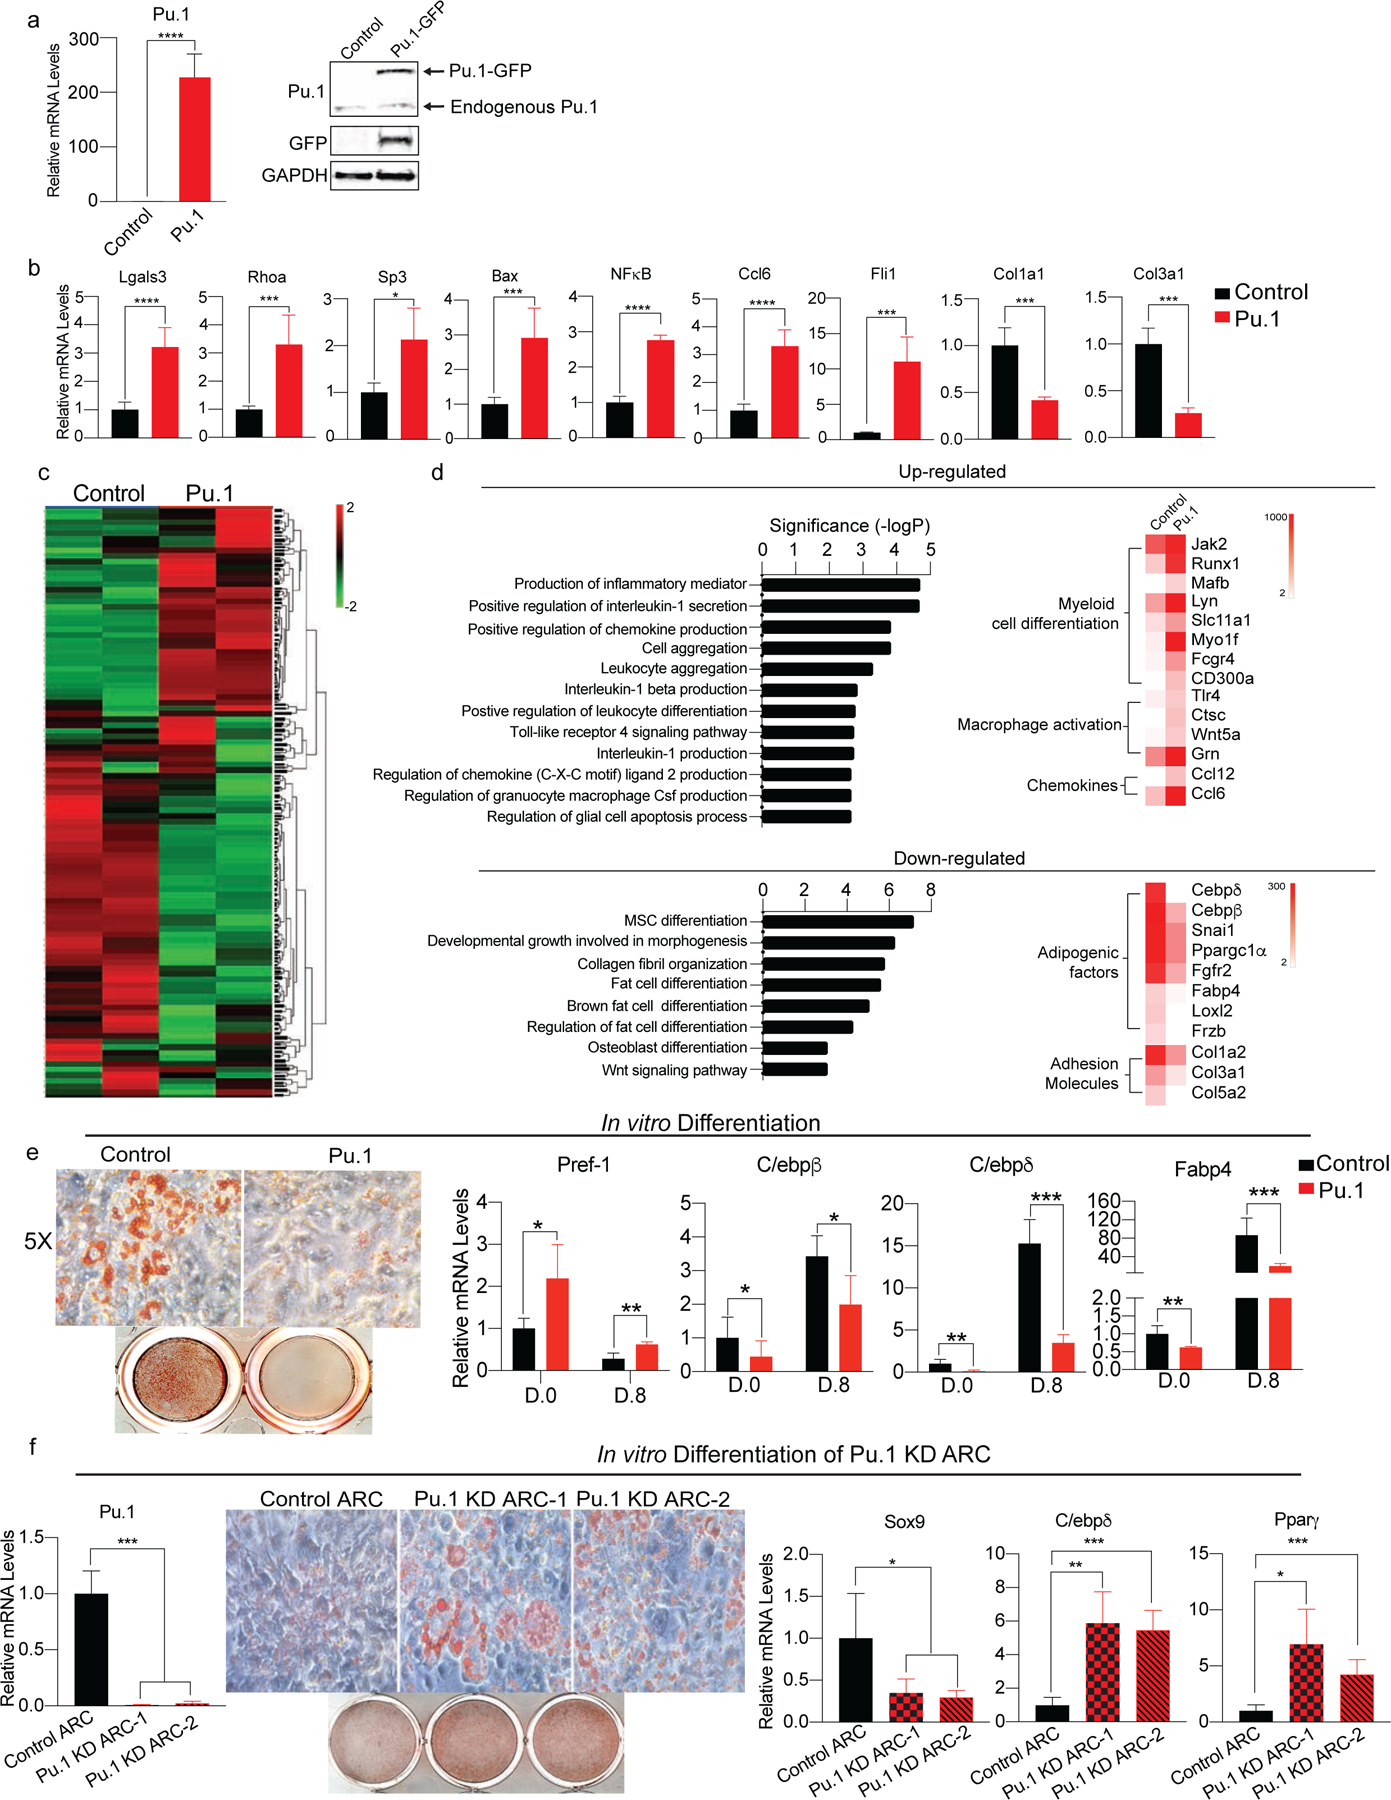
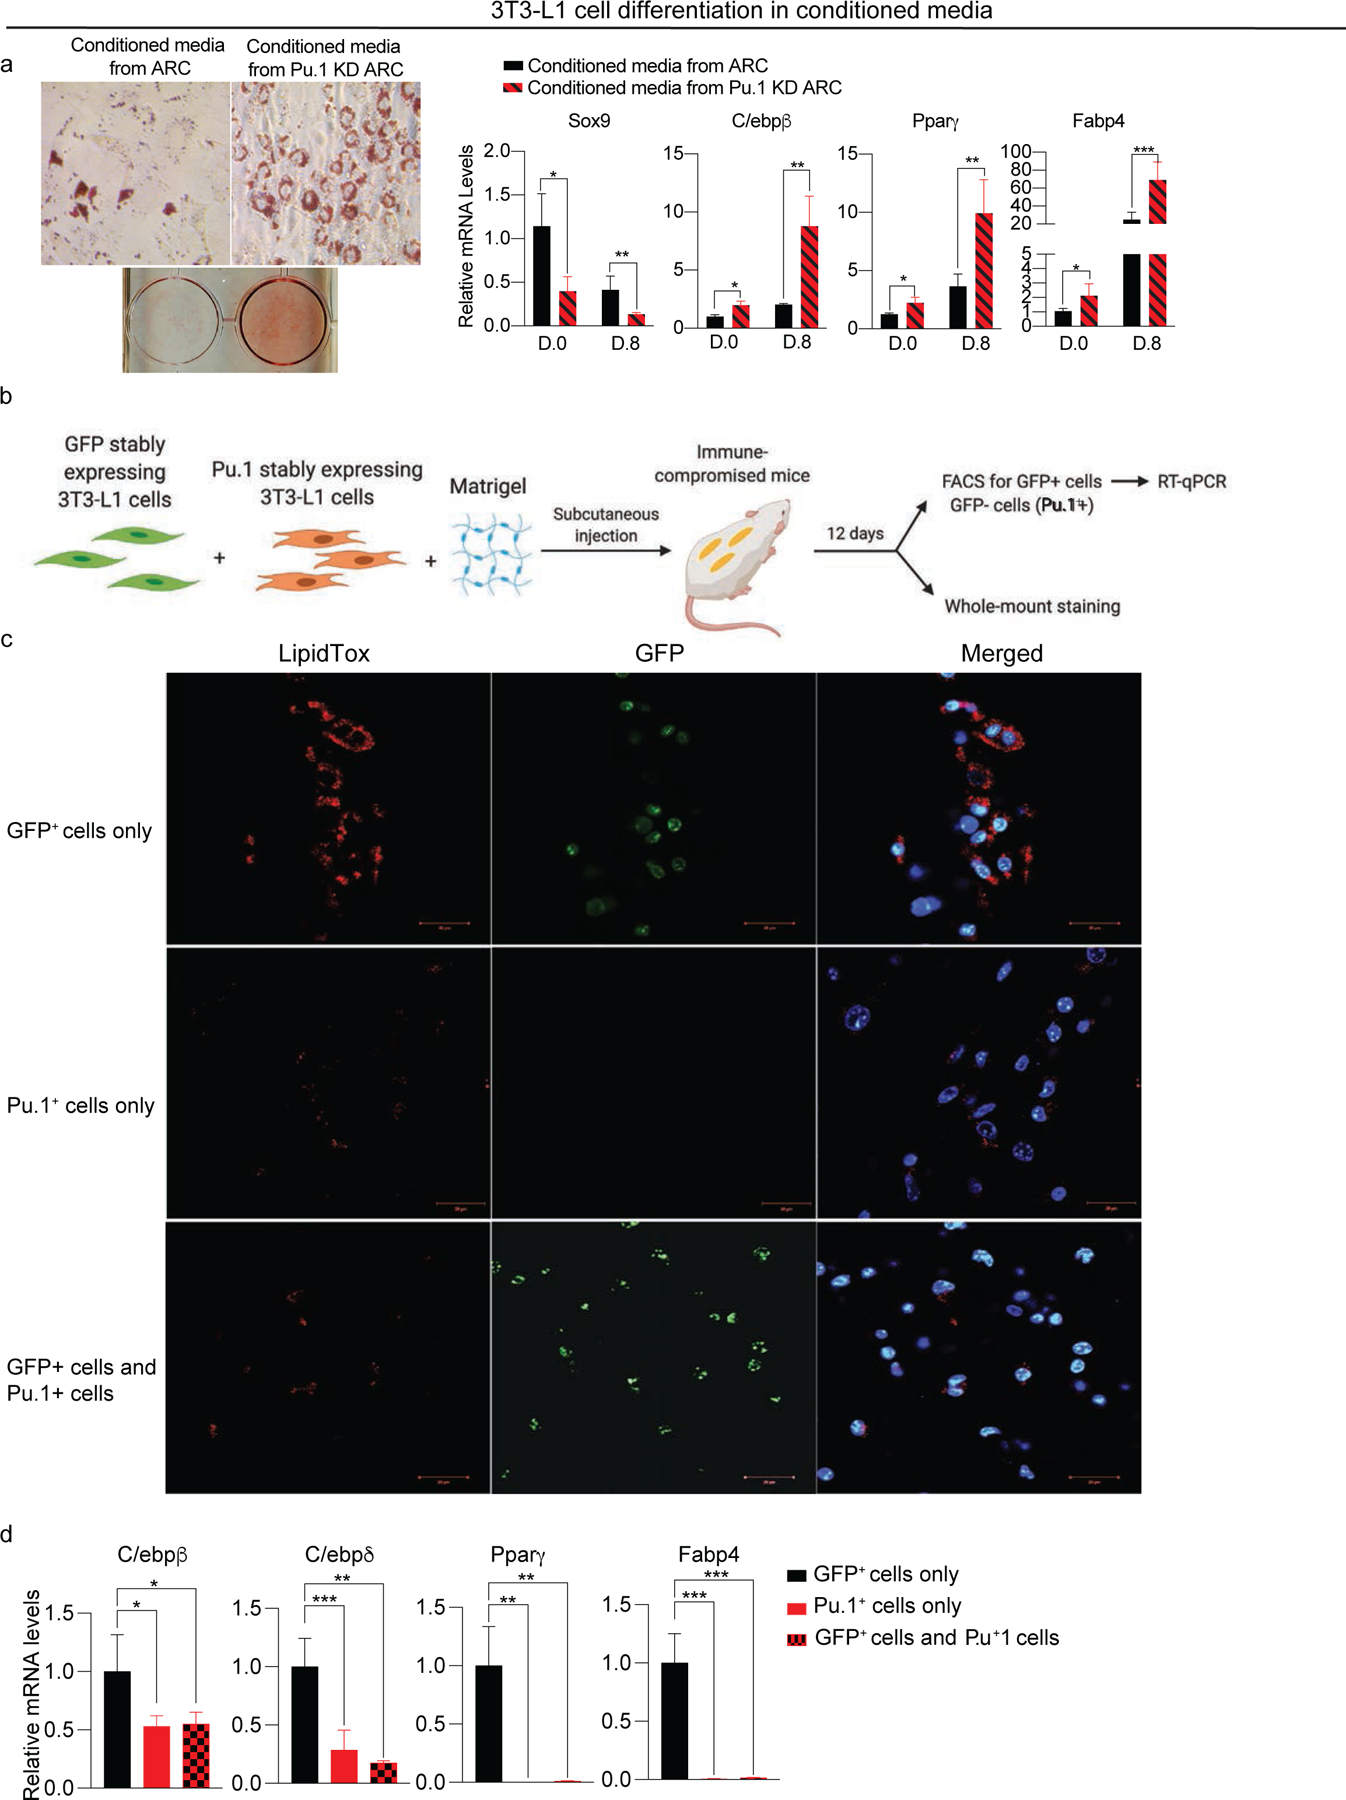
Adipose tissue mass and adiposity change throughout the lifespan. During aging, while visceral adipose tissue (VAT) tends to increase, peripheral subcutaneous adipose tissue (SAT) decreases significantly. Unlike VAT, which is linked to metabolic diseases, including type 2 diabetes, SAT has beneficial effects. However, the molecular details behind the aging-associated loss of SAT remain unclear. Here, by comparing scRNA-seq of total stromal vascular cells of SAT from young and aging mice, we identify an aging-dependent regulatory cell (ARC) population that emerges only in SAT of aged mice and humans. ARCs express adipose progenitor markers but lack adipogenic capacity; they secrete high levels of pro-inflammatory chemokines, including Ccl6, to inhibit proliferation and differentiation of neighboring adipose precursors. We also found Pu.1 to be a driving factor for ARC development. We identify an ARC population and its capacity to inhibit differentiation of neighboring adipose precursors, correlating with aging-associated loss of SAT.

Keywords: adipogenesis; adipose precursors; adipose tissue; aging; subcutaneous adipose tissue.


Conflict of interest statement

Declaration of interests The authors declare no competing interests.

Figures

Figure 1.
Figure 1.. Emergence of Aging-dependent Regulatory Cells (ARC) in subcutaneous adipose tissue in aged mice
(a) tSNE-plot showing SVF populations isolated from iWAT of 10 (young), 48 (aged), and 72 (old) wk-old mice with ARC circled in red. (b) Normalized gene expression values as violin plots of adipose lineage, endothelial, immune and inflammatory genes, and top genes expressed in ARC from aged mice. (c) Heatmap of differentially expressed genes that are >2-fold higher (left) and <2-fold lower (right) in ARC compared to preadipocytes. (d) Enriched pathways in old ARC are similar to ARC from aged mice. (e) In silico cell trajectory of adipose-lineage populations. (f) Schematic model depicting the lineage hierarchy of adipose-lineage cell populations. See also figure S1 and S1b.
Figure 2.
Figure 2.. Isolation of ARC by Lgals3 and CD36 and their impairment in adipogenic differentiation
(a) FACS analysis for early adipocytes using FABP4 in iWAT of young (10wk), aged (48wk), and old (72wk) mice (n=6). (b) (Left) Volcano plot of differential gene expression of ARC compared to other clusters in SVF of iWAT of aged mice. (Right) tSNE-plot showing co-localization of Lgals3 and CD36 in the ARC cluster. (c) (Left) FACS gating strategy for isolation of ARC by FACS. ARC cells were isolated from Lin cells with Lgals3 and CD36. (Right) Percentage of Lgals3+ and CD36+ cells in Lin cells of iWAT of young and aged mice (n=6). (d) RT-qPCR of FACS-sorted ARC, APC, and Lin+ cells. ARC markers: Lgals3 and CD36, adipose progenitor markers: CD34, Pdgfrα, and Pref-1, Immune cell marker: CD45, and endothelial cell marker: CD31 (n=4–6). (e) RT-qPCR of FACS-sorted ARC and preadipocytes for genes involved in inflammation (Jchain, Prafr, and F4/80), regulation of adipocyte differentiation (Loxl2 and C/ebpδ), and chemokine production (Ccl5, Ccl6, Ccl9) (n=6). (f) (Left) Heatmap of enriched transcription factors regulating leukocyte differentiation in ARC vs other clusters. (Right) RT-qPCR of FACS-isolated ARC and preadipocyte transcription factors, including Bax, MafB, and Pu.1. (g) RT-qPCR of FACS-sorted ARC and preadipocyte for adhesion molecules, such as Col1a, Col2a, and Col3a1 and transcription factor, Fli1 (n=6). (h) In vitro adipocyte differentiation of isolated preadipocytes using CD38 and ARC. (Left) Oil Red O staining, and (Right) RT-qPCR for Pref-1, C/ebpδ, Pparγ, and Fabp4 (n=8). (i) MTT assay comparing cell numbers of cultured FACS-isolated preadipocytes and ARC (n=8). (j) FACS analysis of the percentage of ARC in iWAT of young, aged, old, and HFD-fed mice (n=4). (k) (Left) FACS analysis of the percentage of ARC in SAT of humans. (Right) RT-qPCR of LGALS3, CD36, and PU.1 (n=6). Data are represented as mean ± S.D. *≤0.05, **≤0.01, ***≤0.001. See also Figure S2.
Figure 3.
Figure 3.. ARC secrete cytokines to inhibit proliferation and differentiation of neighboring adipose precursors
(a) Oil Red O staining of differentiated 3T3-L1 cells cultured in conditioned media from either FACS-isolated APCs or ARC. (b) RT-qPCR of 3T3-L1 cells cultured in conditioned media from either FACS-isolated APCs or ARC, for C/ebpβ, C/ebpδ, Pparγ, and Fabp4 (n=6). (c) (Left) Heatmap of enriched chemokines in ARC. (Right) RT-qPCR for Ccl6 (n=4–6). (d) Adipocyte differentiation of 3T3-L1 cells cultured with either His-peptide or recombinant Ccl6 in media. (Left) Oil Red O staining, (Right) RT-qPCR for Pref-1, C/ebpδ, Pparγ, and Fabp4 (n=8). (e) Adipocyte differentiation of 3T3-L1 cells cultured in APC, ARC, or ARC media with Ccl6 neutralizing antibody. Oil Red O staining in each condition post-induction of adipocyte differentiation. (f) RT-qPCR for Pref-1, C/ebpδ, Pparγ, and Fabp4 of adipocyte differentiation of 3T3-L1 cells cultured in APC, ARC, or ARC media with Ccl6 neutralizing antibody (n=6). (g) (Left) FACS analysis of EdU incorporation into APCs from iWAT of young and aged mice. Cell numbers were measured after 48hr culturing by MTT assay. (Right) RT-qPCR of adipogenic genes, C/ebpβ and C/ebpδ as well as inflammatory genes, Tnfα, Ctsd, and Gpnmb in FACS-isolated young and aged APCs (n=4–6). (h) RT-qPCR of C/ebpβ and Pparγ in FACS-isolated APCs by Pdgfrα and Pref-1 of different age groups isolated from human SAT by FACS (n=4). Data are represented as mean ± S.D. *≤0.05, **≤0.01, ***≤0.001. See also figure S3.
Figure 4.
Figure 4.. The Role of Pu.1 in generation and function of ARC
(a) Pu.1 was overexpressed in 3T3-L1 cells. (Left) RT-qPCR for Pu.1, (Right) immunoblotting for Pu.1 and GFP (n=6–8). (b) RT-qPCR for genes enriched in ARC such as Lgals3, Rhoa, Sp3, Bax, NFκB1, Ccl2, Ccl5, and Fli1 as well as collagen genes decreased in ARC such as Col1a1, Col1a2, and Col3a1 (n=6). (c) RNA-seq of Pu.1 overexpressing 3T3-L1 cells. Heatmap of global gene expression profile (n=3). (d) (Top) Upregulated pathways and representative genes. (Bottom) Downregulated pathways and representative genes. (e) In vitro adipocyte differentiation of Pu.1 overexpressing 3T3-L1 cells. (Left) Oil Red O staining, (Right) RT-qPCR for Pref-1, C/ebpβ, C/ebpδ, and Fabp4 (n=6). (f) In vitro adipocyte differentiation of Pu.1 KD ARC. (Left) RT-qPCR for Pu.1 in control ARC and Pu.1 KD ARC. (Right) Oil Red O staining and RT-qPCR for Sox9, C/ebpδ, and Pparγ (n=4–8). Data are represented as mean ± S.D. *≤0.05, **≤0.01, ***≤0.001. See also figure S4.
Figure 5.
Figure 5.. Pu.1 stably expressing cells are differentiation-defective and inhibit adipogenesis of nearby preadipocytes in vivo
(a) Adipocyte differentiation of 3T3-L1 cells cultured in conditioned media from ARC or Pu.1 KD ARC. (Left) Oil Red O staining, (Right) RT-qPCR for Sox9, C/ebpβ, Pparγ, and Fabp4 (n=6). (b) Schematic of the implantation experiment (n=4). (c) Whole-mount staining of implants with LipidTox (Red), DAPI (blue) and GFP (Green). (d) RT-qPCR for C/ebpβ, C/ebpδ, Pparγ, and Fabp4 (n=8). Data are represented as mean ± S.D. *≤0.05, **≤0.01, ***≤0.001.

Comment in

References

    1. ALT EU, SENST C, MURTHY SN, SLAKEY DP, DUPIN CL, CHAFFIN AE, KADOWITZ PJ & IZADPANAH R 2012. Aging alters tissue resident mesenchymal stem cell properties. Stem Cell Res, 8, 215–25. - PubMed
    1. ARNER P 1995. Differences in lipolysis between human subcutaneous and omental adipose tissues. Ann Med, 27, 435–8. - PubMed
    1. ASANO Y, MARKIEWICZ M, KUBO M, SZALAI G, WATSON DK & TROJANOWSKA M 2009. Transcription factor Fli1 regulates collagen fibrillogenesis in mouse skin. Mol Cell Biol, 29, 425–34. - PMC - PubMed
    1. BANERJEE SS, FEINBERG MW, WATANABE M, GRAY S, HASPEL RL, DENKINGER DJ, KAWAHARA R, HAUNER H & JAIN MK 2003. The Kruppel-like factor KLF2 inhibits peroxisome proliferator-activated receptor-gamma expression and adipogenesis. J Biol Chem, 278, 2581–4. - PubMed
    1. BERRY DC, JIANG Y & GRAFF JM 2016. Emerging Roles of Adipose Progenitor Cells in Tissue Development, Homeostasis, Expansion and Thermogenesis. Trends Endocrinol Metab, 27, 574–585. - PMC - PubMed

Publication types