. 2021 Aug 1:236:118069.
doi: 10.1016/j.neuroimage.2021.118069. Epub 2021 Apr 18.

Brain network mechanisms of visual shape completion

Affiliations

Brain network mechanisms of visual shape completion

Brian P Keane et al. Neuroimage. .

Abstract

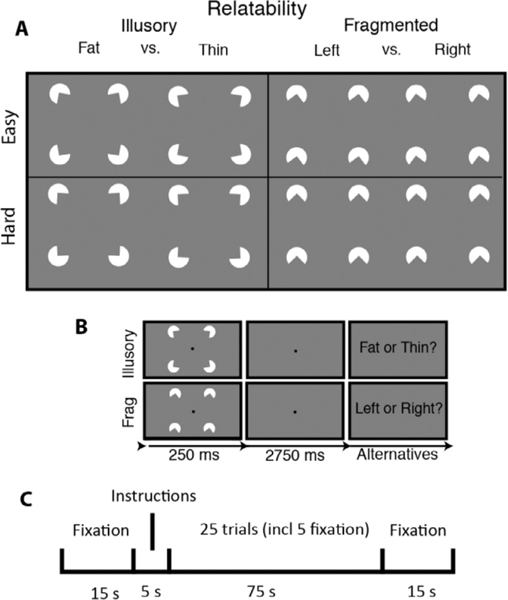
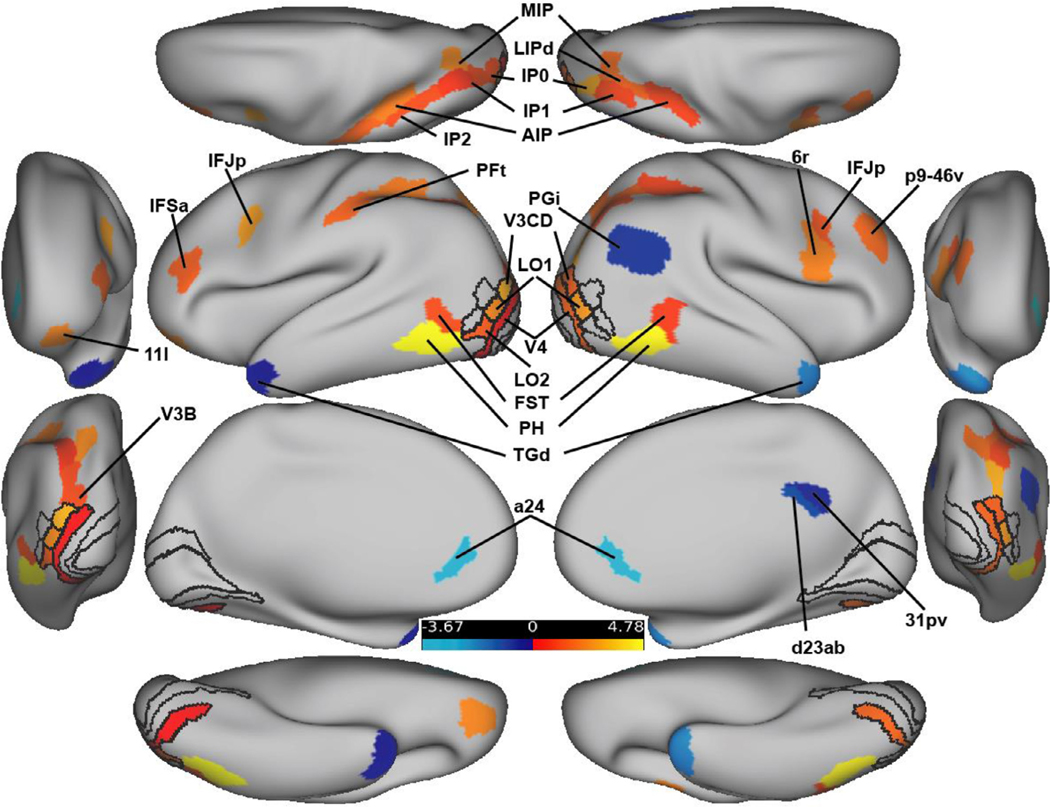
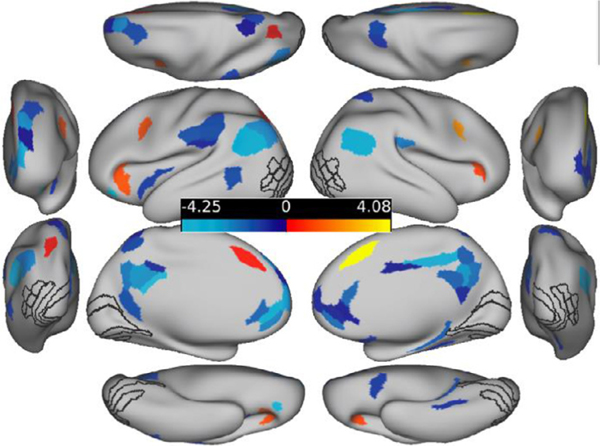
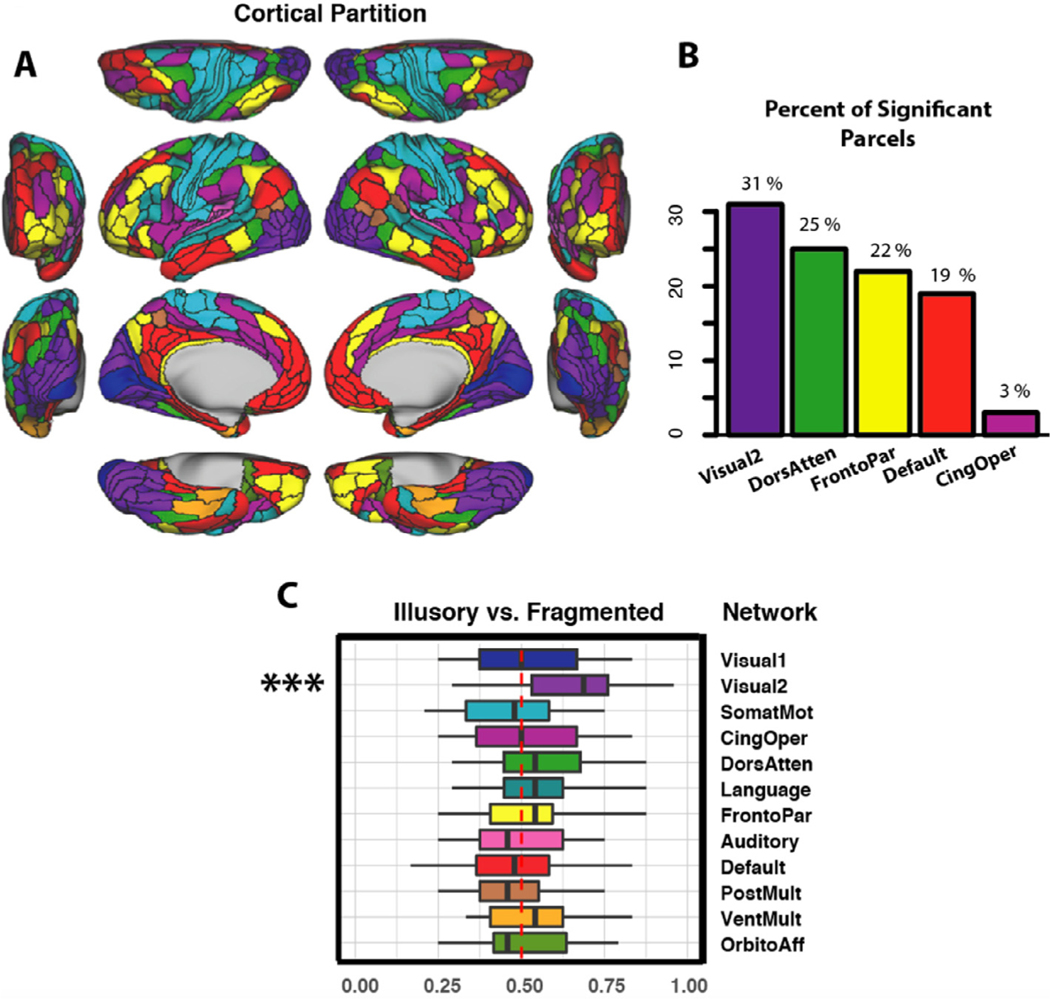
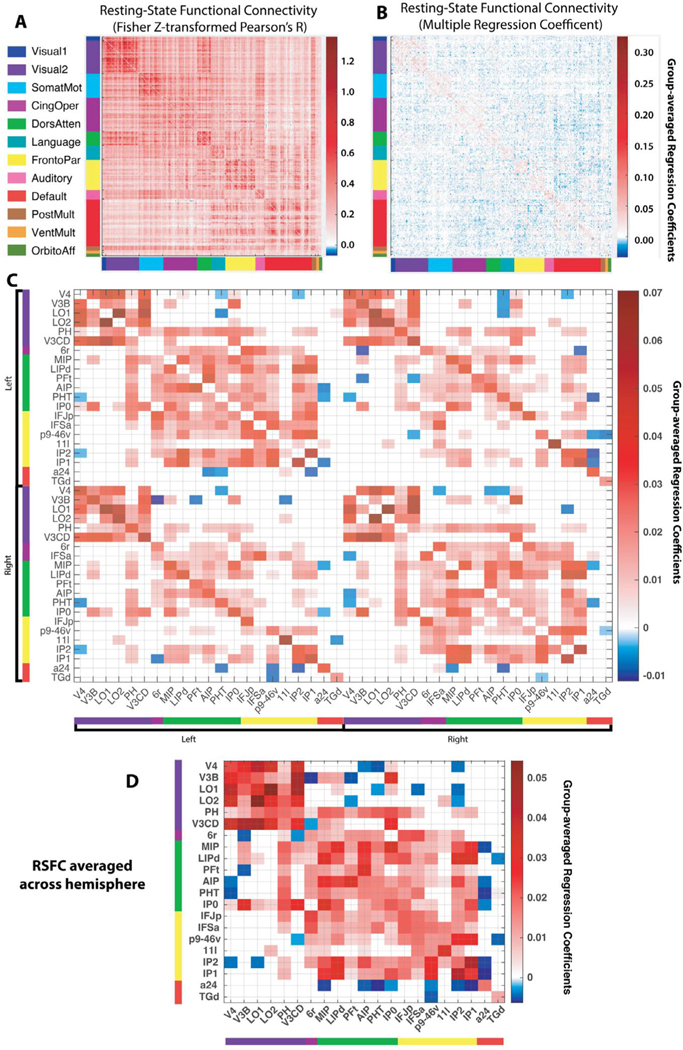
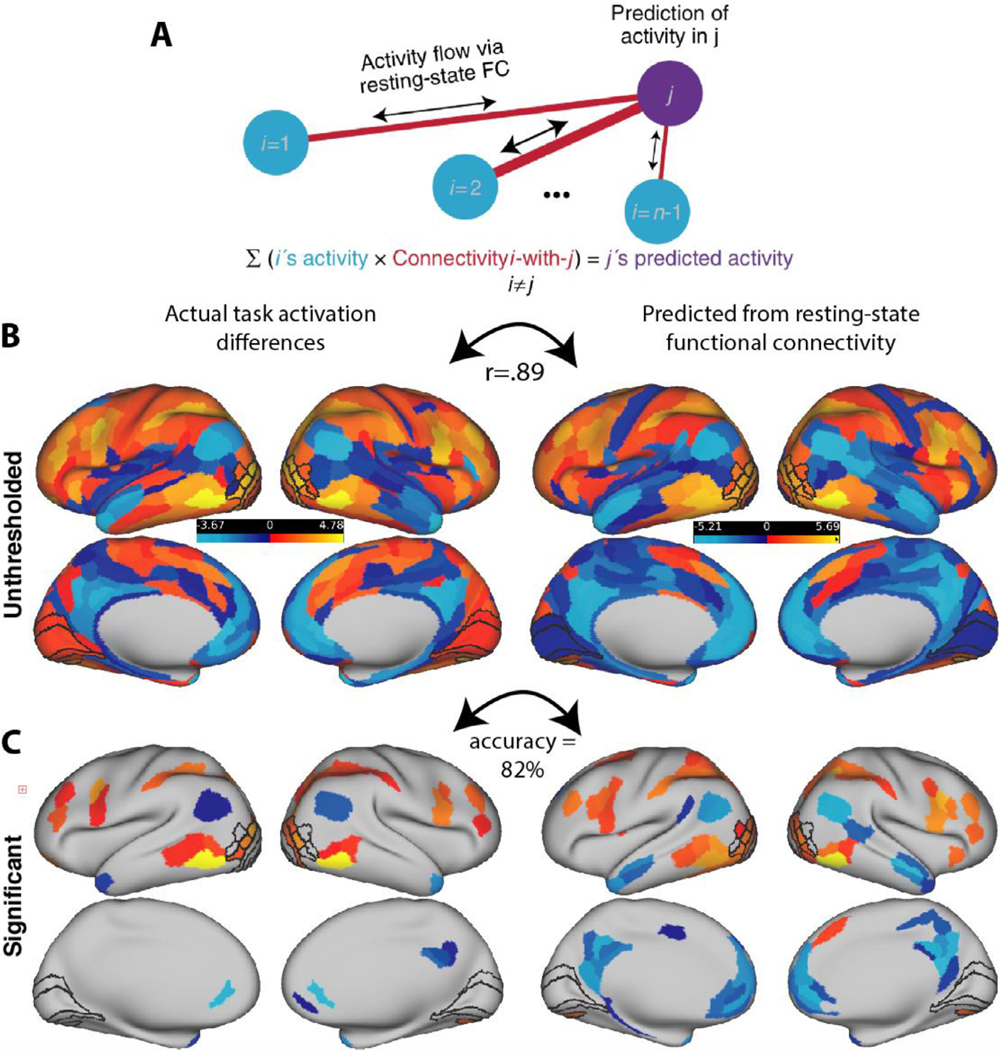
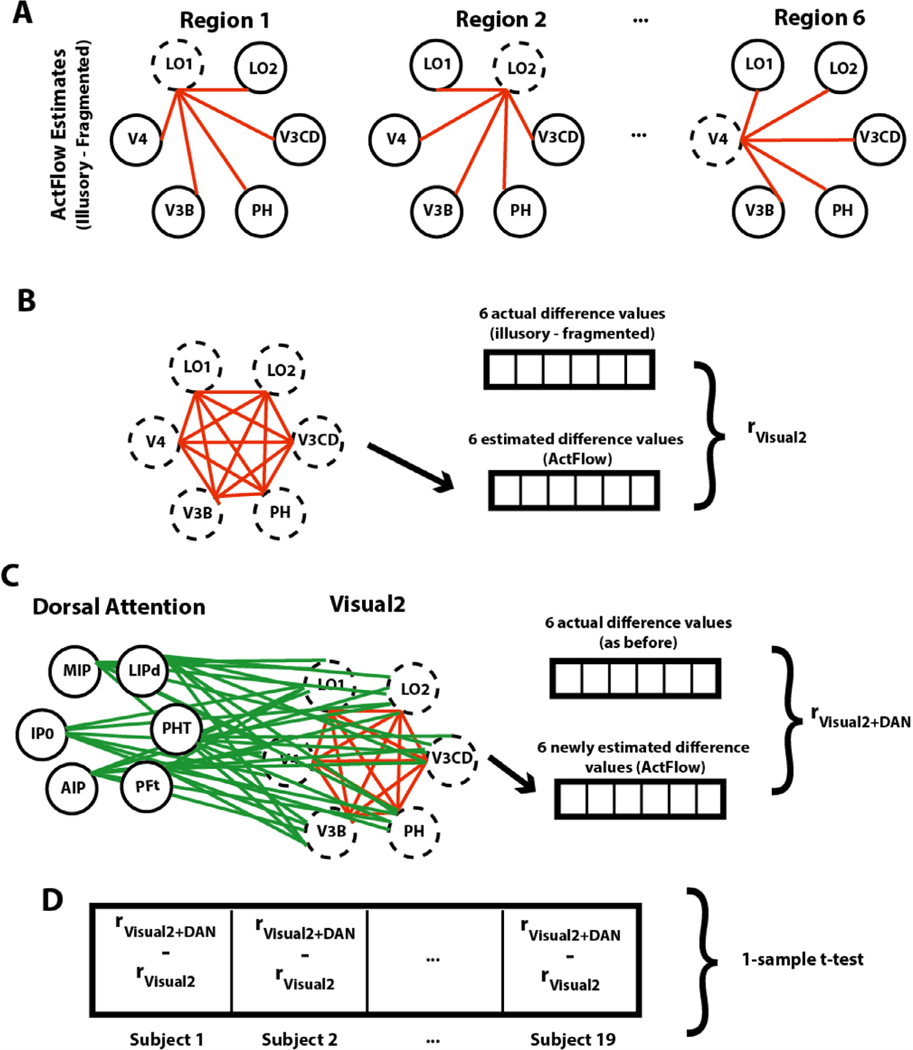
Visual shape completion recovers object shape, size, and number from spatially segregated edges. Despite being extensively investigated, the process's underlying brain regions, networks, and functional connections are still not well understood. To shed light on the topic, we scanned (fMRI) healthy adults during rest and during a task in which they discriminated pac-man configurations that formed or failed to form completed shapes (illusory and fragmented condition, respectively). Task activation differences (illusory-fragmented), resting-state functional connectivity, and multivariate patterns were identified on the cortical surface using 360 predefined parcels and 12 functional networks composed of such parcels. Brain activity flow mapping (ActFlow) was used to evaluate the likely involvement of resting-state connections for shape completion. We identified 36 differentially-active parcels including a posterior temporal region, PH, whose activity was consistent across 95% of observers. Significant task regions primarily occupied the secondary visual network but also incorporated the frontoparietal, dorsal attention, default mode, and cingulo-opercular networks. Each parcel's task activation difference could be modeled via its resting-state connections with the remaining parcels (r=.62, p<10-9), suggesting that such connections undergird shape completion. Functional connections from the dorsal attention network were key in modelling task activation differences in the secondary visual network. Dorsal attention and frontoparietal connections could also model activations in the remaining networks. Taken together, these results suggest that shape completion relies upon a sparsely distributed but densely interconnected network coalition that is centered in the secondary visual network, coordinated by the dorsal attention network, and inclusive of at least three other networks.

Keywords: Area PH; Dorsal attention network; Frontoparietal network; Kanizsa shapes; Resting-state functional connectivity; Secondary visual network; Subjective contours.


Figures

Fig. 1.
Fig. 1.. Stimuli, trial sequence, and block arrangement for the visual shape completion experiment.
(A) Sectored circles (pac-men) were oriented to generate visually completed shapes (illusory condition) or fragmented configurations that lacked interpolated boundaries (fragmented condition). There were two difficulty conditions corresponding to the amount by which the pac-men were individually rotated to create the response alternatives. (B) After briefly seeing the target, subjects responded. (C) Each half of a run consisted of a fixation screen, a 5 second instructional screen, 25 trials of a single task condition (including 5 fixation trials), and then another fixation screen.
Fig. 2.
Fig. 2.
FDR-corrected activation difference amplitudes (Z-normalized) for all parcels for the illusory – fragmented contrast. ROIs are shown with black outlines. The anterior and posterior views are shown laterally; the dorsal and ventral views are shown at the top and bottom. Hot colors indicate regions that were more active for the illusory versus fragmented task; cool colors indicate the reverse.
Fig 3.
Fig 3.. Task activation differences for hard - easy trials (collapsed across illusory/fragmented).
Opposite to the illusory-fragmented contrast, we found that harder trials generally elicited less activation throughout the brain relative to easier trials and the location of these significant activations overlapped little with the activations shown in Fig. 2. The illusory/fragmented a priori ROIs (black outlines) are shown for comparison purposes only and did not contain significant parcels.
Fig. 4.
Fig. 4.
(A) The Cole-Anticevic Brain Network partition. We considered whether parcel-wise activation patterns in the cortical networks could individually classify task betas as deriving from the illusory or fragmented condition; these included the primary visual, secondary visual, somatomotor, cingulo-opercular, dorsal attention, language, frontoparietal, auditory, default, posterior multimodal, ventral multimodal, and orbito-affective networks. Networks are color coded to match the parcels in panels B and C. (B) The percentage of significantly modulated parcels that belonged to each network for the illusory/fragmented contrast. (C) Classification accuracy for the illusory/fragmented comparison. The red dot-ted line shows chance performance, the box segments denote median scores, the box hinges correspond to the 25th and 75th percentiles, and the box whiskers extend to the largest or smallest value (but no further than 1.5x the interquartile range). Only the secondary visual network could significantly predict illusory/fragmented activations (∗∗∗pcorr<.001). (See Supplementary materials for the exact parcels incorporated by this network).
Fig. 5.
Fig. 5.. Resting-state functional connectivity (RSFC) matrices.
(A) Pearson correlation between the resting-state time series of all parcel pairs (360 × 360 parcels). Parcels are sorted into previously established (color-coded) functional connectivity networks (Ji et al., 2019) (see also Fig. 4 A). The block-like structure along the diagonal exemplifies the stronger connectivity within relative to between each network. (B) An RSFC matrix computed via multiple regression (see Methods). The blue/red colors indicate the degree to which a given parcel time series was predicted by all remaining parcels. Note that this matrix is much sparser than the correlational matrix since it eliminates many of the indirect connections between parcels (Cole et al., 2016). (C) Thresholded (FDR-corrected) resting-state connections between significantly modulated task regions (see text), which are ordered first by hemisphere and then by network. Compared to the full matrix in panel B, this pared down matrix had about 1 percent the number of possible connections (matrix elements) and triple the proportion of (FDR-corrected) significant connections. (D) Averaging the connection weights across hemisphere increased the proportion even further (from 43% to 60%), highlighting the broadly symmetric connectivity patterns. Note that one parcel, IFSa, was split between the frontoparietal (left hemisphere) and 10cingulo-opercular networks (right), and was assigned to the frontoparietal network in this plot since only the frontoparietal parcel was significant in the task activation analysis.
Fig. 6.
Fig. 6.. Activity flow mapping for visual shape completion.
(A) For each subject, the task activation differences (illusory-fragmented) in a held-out parcel (j) is given by the dot product between the activation differences in the remaining parcels (regions i) and the resting-state connection strengths (betas) between i and j. (B) Unthresholded z-normalized activation differences (illusory – fragmented) as compared to those that were predicted via ActFlow using resting state. (C) When a task activation analysis was applied to the data predicted from ActFlow, statistical significance (or lack thereof) was correctly determined for 82% of the 360 parcels (see also Fig. 2). This suggests that the connection weights derived from resting state were reflective of the actual connections used during shape completion.
Fig. 7.
Fig. 7.. Gauging contributions of the dorsal attention network to the secondary visual network (Visual2).
(A) For a given subject, task activation differences for each significant Visual2 parcel were estimated (dotted circles) using actual task activation differences in the remaining parcels (solid circles) and their resting-state connections (red lines). For illustration purposes, only one hemisphere is shown. (B) ActFlow accuracy was defined as the correlation between actual and estimated task activation differences, across the Visual2 parcels. (C) Task activation differences were again estimated via ActFlow, except that, this time, the connections and activation differences from the significant dorsal attention regions could also contribute. (D) The difference between the original and re-calculated estimates was computed for each subject (after a Fisher Z-transform) and compared to zero across subjects. Only the dorsal attention network could significantly improve ActFlow estimates in the secondary visual network. (For interpretation of the references to colour in this figure legend, the reader is referred to the web version of this article.)

References

    1. Anticevic A, Cole MW, Murray JD, Corlett PR, Wang X-J, Krystal JH, 2012. The role of default network deactivation in cognition and disease. Trends Cogn. Sci. (Regul Ed) 16, 584–592. doi: 10.1016/j.tics.2012.10.008. - DOI - PMC - PubMed
    1. Bar M, 2003. A cortical mechanism for triggering top-down facilitation in visual object recognition. J. Cogn. Neurosci 15, 600–609. doi: 10.1162/089892903321662976. - DOI - PubMed
    1. Beck J, 1966. Effect of orientation and of shape similarity on perceptual grouping. Percept. Psychophys 1, 300–302.
    1. Benjamini Y, Hochberg J, 1995. Controlling the false discovery rate: a practical and powerful approach to multiple testing. J. R. Stat. Soc. Ser. B-Methodol 57, 289–300.
    1. Bhandari R, Kirilina E, Caan M, Suttrup J, De Sanctis T, De Angelis L, Keysers C, Gazzola V, 2020. Does higher sampling rate (multiband + SENSE) improve group statistics - an example from social neuroscience block design at 3T. Neuroimage 213, 116731. doi: 10.1016/j.neuroimage.2020.116731. - DOI - PMC - PubMed

Publication types