. 2021 Jul 10:510:79-92.
doi: 10.1016/j.canlet.2021.04.004. Epub 2021 Apr 17.

Dual blockade of EGFR and CDK4/6 delays head and neck squamous cell carcinoma progression by inducing metabolic rewiring

Affiliations

Dual blockade of EGFR and CDK4/6 delays head and neck squamous cell carcinoma progression by inducing metabolic rewiring

Sanjib Chaudhary et al. Cancer Lett. .

Abstract

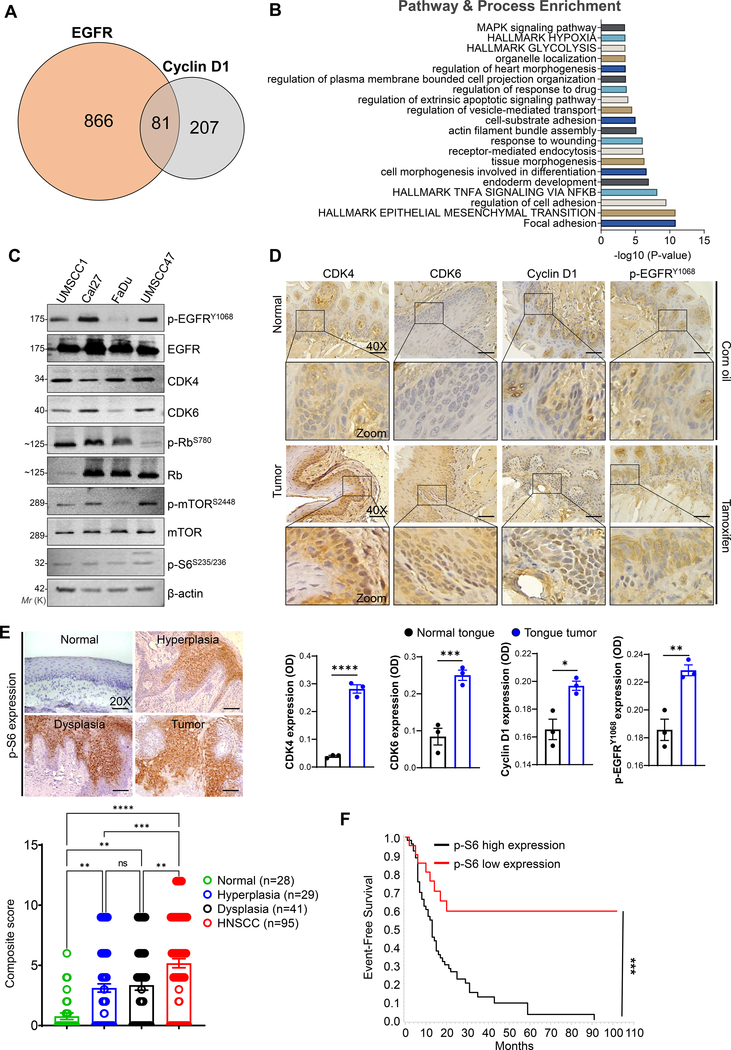
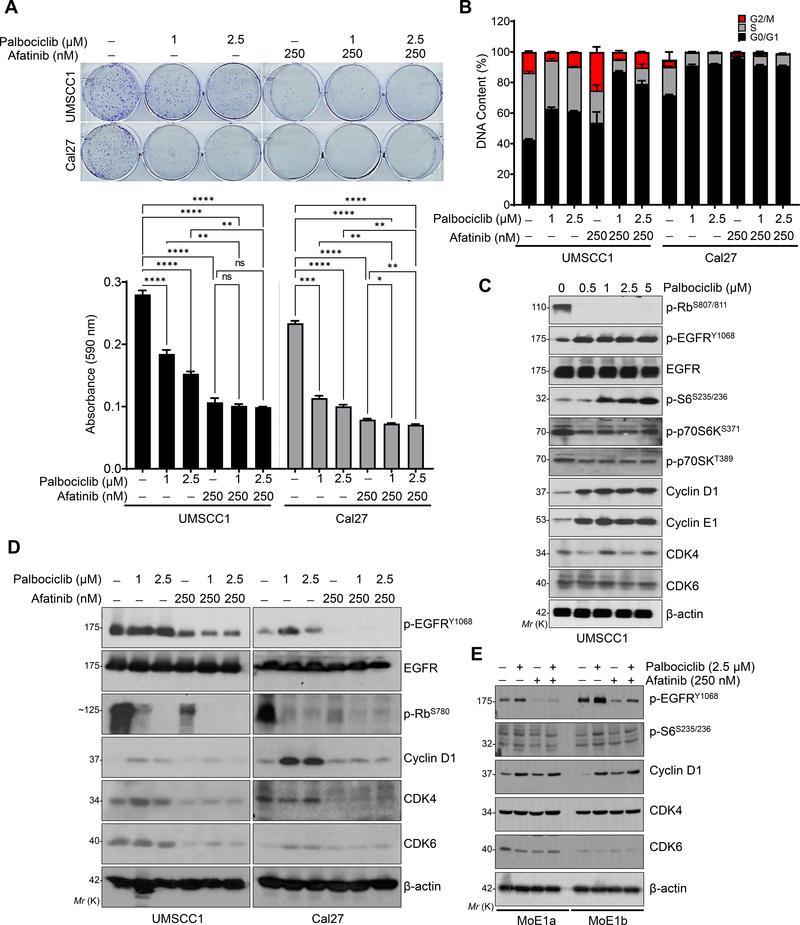
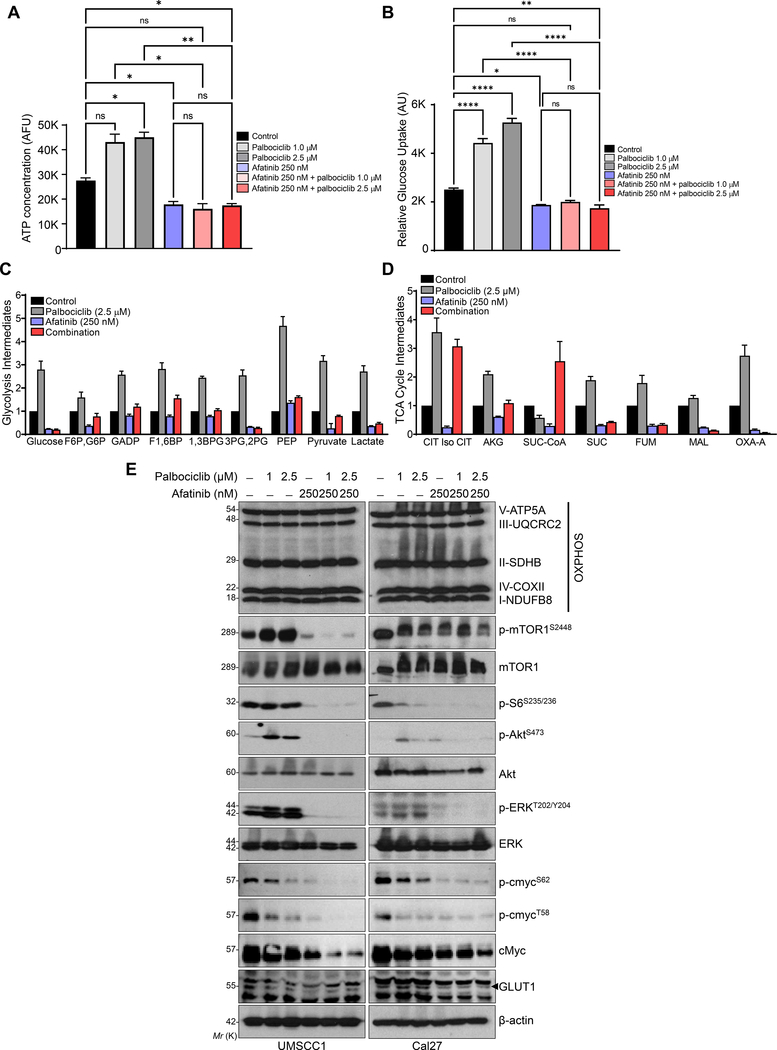
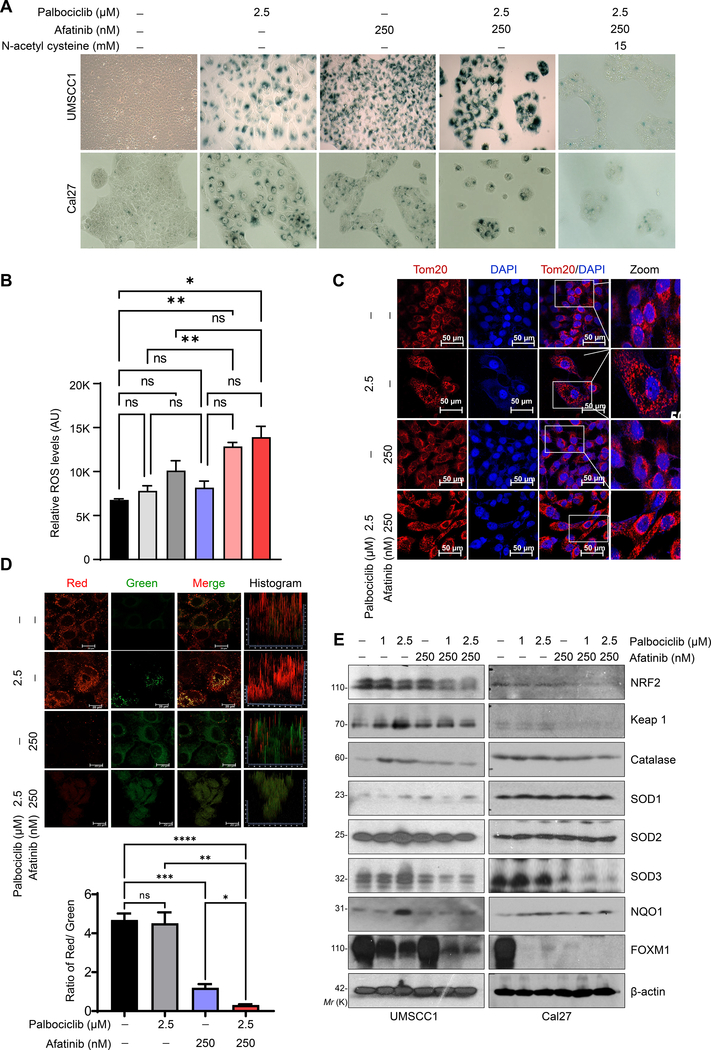
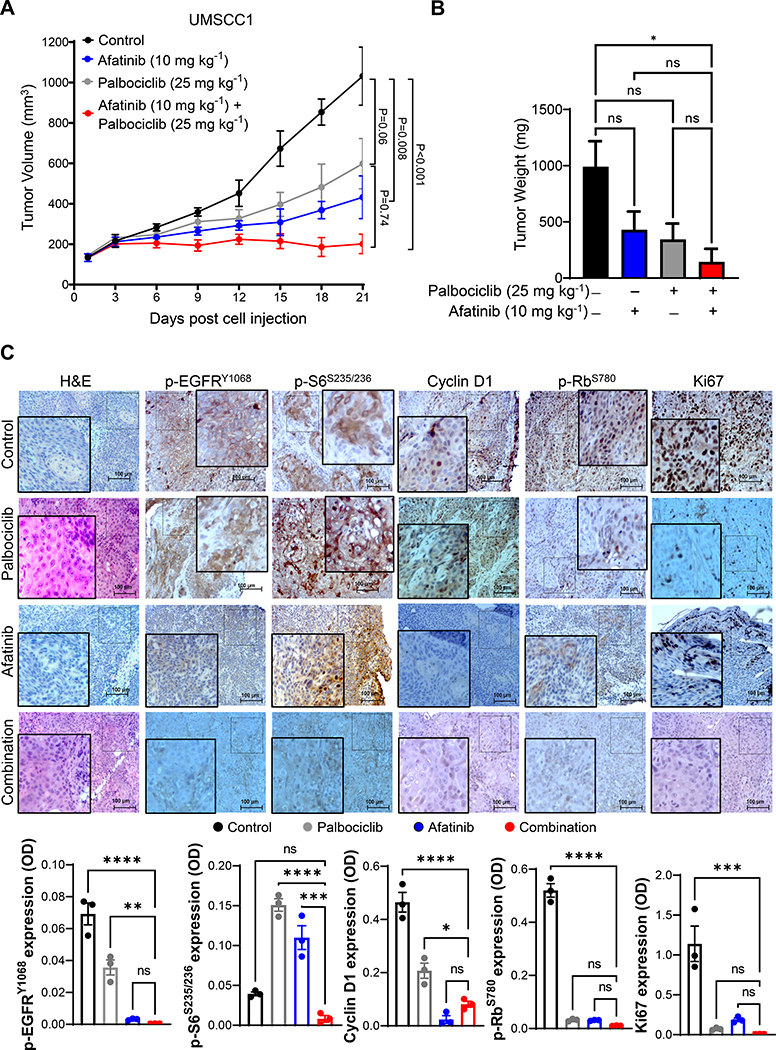
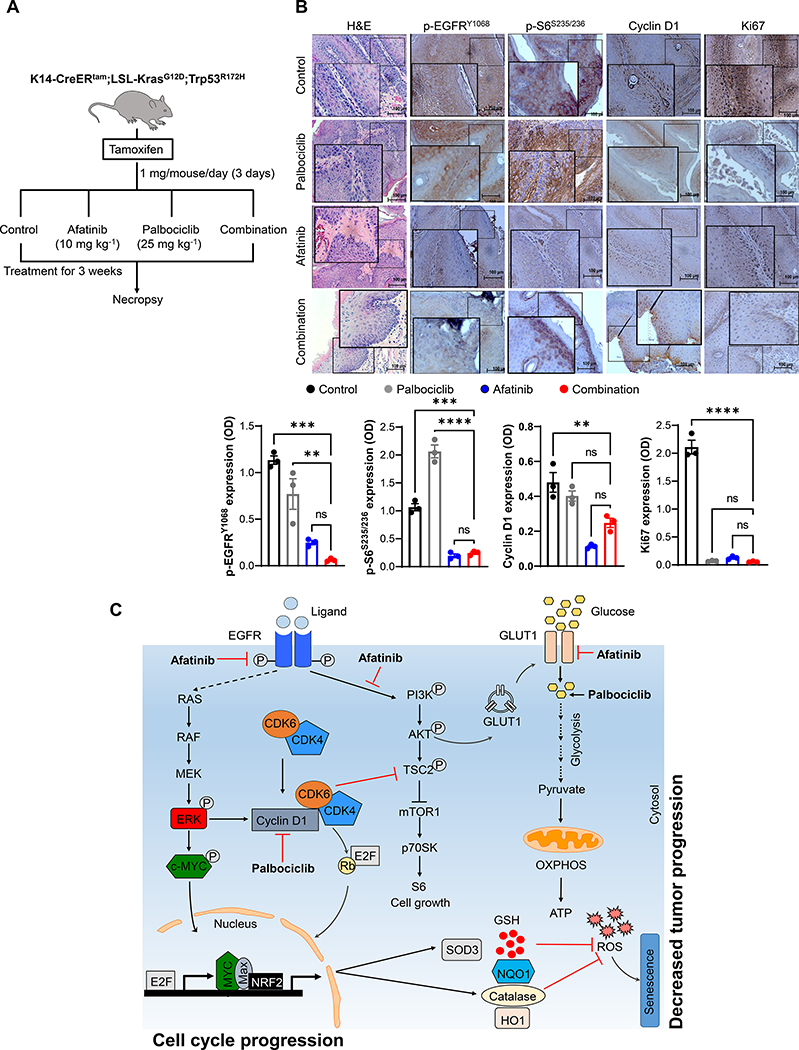
Despite preclinical success, monotherapies targeting EGFR or cyclin D1-CDK4/6 in Head and Neck squamous cell carcinoma (HNSCC) have shown a limited clinical outcome. Here, we aimed to determine the combined effect of palbociclib (CDK4/6) and afatinib (panEGFR) inhibitors as an effective strategy to target HNSCC. Using TCGA-HNSCC co-expression analysis, we found that patients with high EGFR and cyclin D1 expression showed enrichment of gene clusters associated with cell-growth, glycolysis, and epithelial to mesenchymal transition processes. Phosphorylated S6 (p-S6), a downstream effector of EGFR and cyclin D1-CDK4/6 signalling, showed a progressive increase from normal oral tissues to leukoplakia and frank malignancy, and associated with poor outcome of the patients. This increased p-S6 expression was drastically reduced after combination treatment with afatinib and palbociclib in the cell lines and mouse models, suggesting its utiliy as a prognostic marker in HNSCC. Combination treatment also reduced the cell growth and induced cell senescence via increasing reactive oxygen species with concurrent ablation of glycolytic and tricarboxylic acid cycle intermediates. Finally, our findings in sub-cutaneous and genetically engineered mouse model (K14-CreERtam;LSL-KrasG12D/+;Trp53R172H/+) studies showed a significant reduction in the tumor growth and delayed tumor progression after combination treatment. This study collectively demonstrates that dual targeting may be a critical therapeutic strategy in blocking tumor progression via inducing metabolic alteration and warrants clinical evaluation.

Keywords: Cyclin D1-CDK4/6; EGFR; HNSCC; Mouse model; Senescence.


Conflict of interest statement

Conflict of interests

SKB is one of the co-founders of Sanguine Diagnostics and Therapeutics, Inc. AKG has received consulting fees from AstraZeneca, Jazz Pharmaceuticals, G1 Therapeutics, Blueprint Medicines, Genentech, Flagship Biosciences, Mirati Therapeutics and research support form Takeda. AKG also serve on a DSMC for YMAbs. Other authors disclose no potential conflicts of interest.

Figures

Fig. 1.
Fig. 1.. Hyperactivation of EGFR and cyclin D1-CDK4/6 signaling in HNSCC.
a. Venn diagram showing co-expressed genes with EGFR (947 genes) and cyclin D1 (288 genes) in TCGA HNSCC patients extracted from the cBioPortal (https://www.cbioportal.org/). Eighty-one genes are common across the two gene sets. b. Gene set enrichment analysis (https://metascape.org/gp/) based on pathway and processes indicate the gene clusters associated with EGFR and cyclin D1 in regulating the hallmarks of glycolysis, epithelial to mesenchymal transition, and cell growth, etc., c. Western blot analysis of EGFR and CDK4/6 signaling proteins in whole cell lysates (20–40 μg) loaded in 8–12 % SDS-PAGE. β-actin used as a loading control. d. Immunohistochemistry in normal (corn oil injected) and tumor tissues (tamoxifen injected) obtained from the genetically engineered mice model (K14-CreERtam;LSL-KrasG12D;Trp53R172H). Representative immunohistochemistry images were photographed by Leica ICC50E (40X). p-EGFR (Tyr-1068), cyclin D1, CDK4, and CDK6 was analyzed in the tissues (n=3) using ImageJ (IHC Profiler plugin) [22]. The quantification of positive staining (OD) of the respective proteins are provided (bottom panel). Optical density (OD) = log (max density/mean intensity). e, f. Representative immunohistochemistry images of p-S6 (Ser-235/236) analyzed in normal (n=28), leukoplakia (n=70) [hyperplasia (n=29), dysplasia (n=41)], and HNSCC (n=95)]. Staining represented as a composite score [intensity score × percentage positive cells]. Event-free survival of HNSCC patients based on p-S6 expression. Data represent mean ± SEM. Unpaired two-tailed t-test (d & f) and Ordinary one-way ANOVA with Tukey’s multiple comparisons test (e). **P < 0.01, ***P < 0.001, ****P < 0.0001, and ns=non-significant.
Fig. 2.
Fig. 2.. Afatinib and palbociclib in-combination decrease the proliferation of HNSCC cells by inducing cell cycle arrest.
a. Representative images of colony formation assay after 15–21 days of treatments with palbociclib (1 and 2.5 μM), afatinib (250 nM) or combination (palbociclib- 1 & 2.5 μM and afatinib- 250 nM) in UMSCC1 and Cal27 cell lines. Quantification was performed (absorbance at 590 nm) after dissolving the colonies (0.5% crystal violet staining) with 10% acetic acid and represented as bar diagram (bottom panel). b. Distribution of DNA content (in percentage) by Flow cytometry analysis (UMSCC1 and Cal27) after palbociclib (1 and 2.5 μM), afatinib (250 nM) and combination treatments for 48 h. c. Western blot of p-Rb (Ser-807/811), p-EGFR (Tyr-1068), p-S6 (Ser-235/236) and cyclin D1 in the whole cell lysates after dose-dependent treatment with palbociclib (0.5 μM to 5 μM) for 48 h. d. Western blot in whole cell lysates after various treatments [palbociclib (1 & 2.5 μM), afatinib (250nM) and combination (palbociclib- 1 & 2.5 μM and afatinib- 250 nM) for 48 h in UMSCC1 and Cal27. Combination treatment affects p-EGFR (Tyr-1068), p-S6 (Ser-235/236), cyclin D1, CDK4, and CDK6 expression. e. Western blot after treatments as described (d), after 48 h treatment in the immortalized normal oral epithelial cell lines, MoE1a and MoE1b. β-actin as a loading control. Data represent mean ± SEM (n=3). One-way ANOVA and Tukey’s multiple comparisons test (a). *P < 0.05, **P < 0.01, ***P < 0.001, ****P < 0.0001, and ns=non-significant.
Fig. 3.
Fig. 3.. Combination treatment induces metabolic alteration in HNSCC.
a. UMSCC1 cell line treated with palbociclib (1 & 2.5 μM), afatinib (250 nM) and combination (palbociclib- 1 & 2.5 μM and afatinib- 250 nM) for 48 h. Cellular ATP measured with ATP Detection Assay Kit-Luminescence kit and concentration represented as bar diagram. b. Relative glucose uptake measured with Glucose Uptake Cell-Based Assay Kit after treatments described in (a). c, d. Glycolysis and Tricarboxylic acid cycle (TCA cycle) intermediates were measured by Mass spectrometry after 48 h of treatment [afatinib-250 nm, palbociclib-2.5 μM, and combination (afatinib-250 nm & palbociclib-2.5 μM)] in UMSCC1 cells. Data represented as relative fold change of intermediates in glycolysis: glucose, glucose 6P (G6P), fructose 1,6BP (F6P), Glyceraldehyde 3-phosphate (GADP), Fructose 1,6-bisphosphate (F1,6BP), 1,3-Bisphosphoglycerate (1,3BPG), Glyceraldehyde 3-phosphate (3PG), 2-phosphoglycerate (2PG), Phosphoenolpyruvate (PEP), pyruvate, and lactate; and TCA cycle: Citrate, Iso-citrate (CIT Iso CIT), alpha-ketoglutarate (AKG), Succinyl Co-A (Suc-CoA), Succinate (SUC), fumarate (FUM), malate (MAL), and Oxaloacetate-A (OXA-A). e. Western blot in whole cell lysates showing OXPHOS/electron transport chain proteins, p-mTOR1 (Ser-2448), p-AKT (Ser-473), p-ERK (Thr-202/Tyr-204) after treatments as described (a) in UMSCC1 and Cal27. β-actin as a loading control. Data represent mean ± SEM. ANOVA followed by Tukey’s multiple comparisons test (a & b). Statistical significance *P < 0.05, **P < 0.01, ****P < 0.001, and ns=non-significant.
Fig. 4.
Fig. 4.. Combination treatment induces senescence through ROS generation in HNSCC.
a. Representative image of SA-β-gal staining indicates cell senescence in UMSCC1 and Cal27 cells after palbociclib (2.5 μM), afatinib (250 nM) or combination (palbociclib- 2.5 μM and afatinib- 250 nM) for 48 h. Treatment with N-acetyl cysteine (15 mM) for 2–4 h prior to combination treatment (right panel). b. Intracellular levels of reactive oxygen species (ROS) measured with Fluorometric Intracellular Ros Kit after 48 h of treatment [palbociclib (1 & 2.5 μM), afatinib (250 nM) and combination (palbociclib- 1 & 2.5 μM and afatinib- 250 nM)]. c. Immunofluorescence of mitochondrial Tom20 staining in UMSCC1 after treatment [afatinib-250 nm, palbociclib-2.5 μM, and combination (afatinib-250 nm & palbociclib-2.5 μM)] for 48 h. d. Active mitochondria as shown by JC-1 red/green staining. Quantification of ratio of red/green (bottom panel). e. Western blot of ROS scavenging proteins after treatment described (b) in UMSCC1 and Cal27. Data represent mean ± SEM. n=2. ANOVA followed by Tukey’s multiple comparisons test between groups (b & d). *P < 0.05, **P < 0.01, ***P < 0.001, ****P < 0.0001, and ns=non-significant.
Fig. 5.
Fig. 5.. Combination therapy decreases the growth of HNSCC xenografts.
a. Tumor volume and weight of UMSCC1 xenograft after treatments with afatinib (10 mg/kg/day), palbociclib (25 mg/kg/day), and combination or vehicle for 21 days. Data represent mean tumor volume ± SEM. n=5 mice/group. b. Tumor weights of UMSCC1 xenografts (four groups) in milligrams after treatments. c. Representative immunohistochemistry image of p-EGFR (Tyr-1068), p-S6 (Ser-235/236), cyclin D1, p-Rb (Ser-780), and Ki67 of xenografts (n=3). Image scale = 100 μm. IHC quantifications (OD) are provided in the bottom panel. Data represent mean ± SEM. ANOVA followed by Tukey’s multiple comparisons test was used between groups (a-c). *P < 0.05, **P < 0.01, ***P < 0.001, ****P < 0.0001, and ns=non-significant. OD=optical density.
Fig. 6.
Fig. 6.. Combination treatment delays HNSCC progression in a GEM model.
a. Schema of drug treatment strategy in GEM model (left panel). Ten days after Cre activation, KKP mice (K14-CreERtam;LSL-KrasG12D;Trp53R172H) treated with palbociclib (25 mg/kg/day), afatinib (10 mg/kg/day), combination or vehicle control for 21 days. Mice sacrificed and oral tissues analyzed by H&E. b. Immunohistochemistry of p-EGFR (Tyr-1068), p-S6 (Ser-235/236), cyclin D1, and Ki67 in KKP tumors after treatments (n=3). Image scale = 100 μm. The positive staining (OD) of the respective proteins is provided (bottom panel). c. Current proposed model of how combination therapy block tumor progression. Targeting CDK4/6 with palbociclib activates Rb to induce cell cycle arrest. However, palbociclib also activates EGFR to increases cyclin D1 and E1 levels. And afatinib inhibits EGFR signaling and decreases cyclin D1, cyclin E1, and p-S6 (Ser-235/236) expression. In contrast, combination treatment reduces the glucose uptake and inhibits both glycolysis and TCA cycle with no change in OXPHOS. Furthermore, decreased SOD3, NQO1, NRF2, and catalase levels by combination lead to increased ROS levels, mitochondrial dysfunction and metabolic alteration, resulting in cellular senescence with an overall decrease in tumor growth and development. Data represent mean ± SEM. ANOVA followed by Tukey’s multiple comparisons test was used between groups (b). **P < 0.01, ***P < 0.001, ****P < 0.0001, and ns=non-significant. OD=optical density.

Comment in

References

    1. Sigismund S, Avanzato D, Lanzetti L, Emerging functions of the EGFR in cancer, Molecular oncology, 12 (2018) 3–20. - PMC - PubMed
    1. Sasaki T, Hiroki K, Yamashita Y, The role of epidermal growth factor receptor in cancer metastasis and microenvironment, Biomed Res Int, 2013 (2013) 546318. - PMC - PubMed
    1. Macha MA, Rachagani S, Chaudhary S, Sayed Z, Jones DT, Batra SK, Receptor Tyrosine Kinase Signaling Pathways as a Goldmine for Targeted Therapy in Head and Neck Cancers, Gene Regulation and Therapeutics for Cancer, 163.
    1. Chaudhary S, Dam V, Ganguly K, Sharma S, Atri P, Chirravuri-Venkata R, Cox JL, Sayed Z, Jones DT, Ganti AK, Ghersi D, Macha MA, Batra SK, Differential mutation spectrum and immune landscape in African Americans versus Whites: A possible determinant to health disparity in head and neck cancer, Cancer Letters, 492 (2020) 44–53. - PMC - PubMed
    1. Alao JP, The regulation of cyclin D1 degradation: roles in cancer development and the potential for therapeutic invention, Molecular cancer, 6 (2007) 24. - PMC - PubMed

Publication types

MeSH terms