. 2021 Apr 20;19(1):112.
doi: 10.1186/s12951-021-00855-y.

Autophagy blockade synergistically enhances nanosonosensitizer-enabled sonodynamic cancer nanotherapeutics

Affiliations

Autophagy blockade synergistically enhances nanosonosensitizer-enabled sonodynamic cancer nanotherapeutics

Liqiang Zhou et al. J Nanobiotechnology. .

Abstract

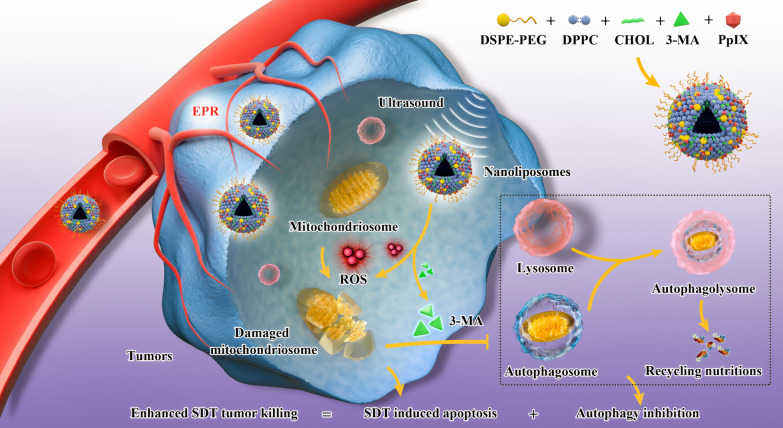
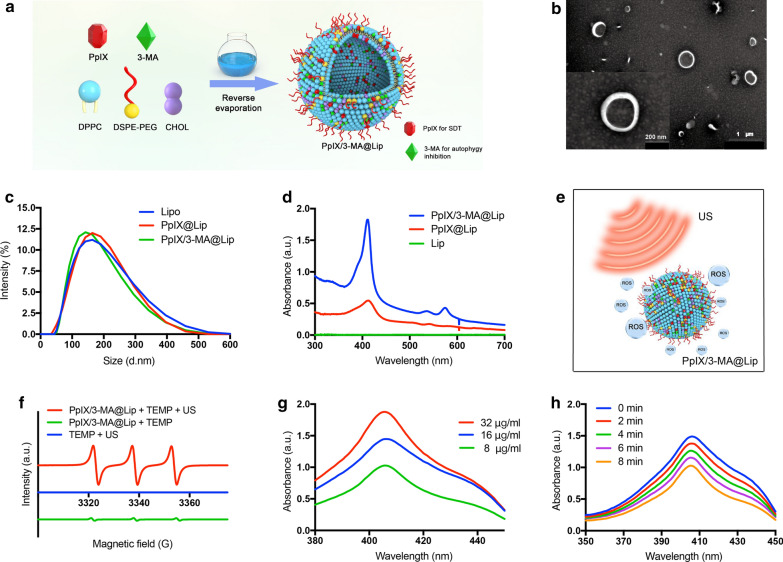
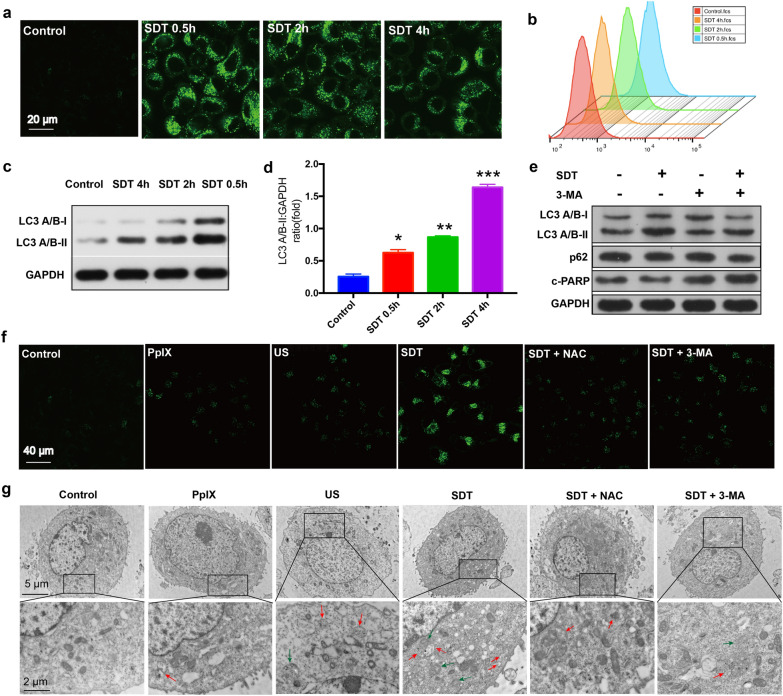
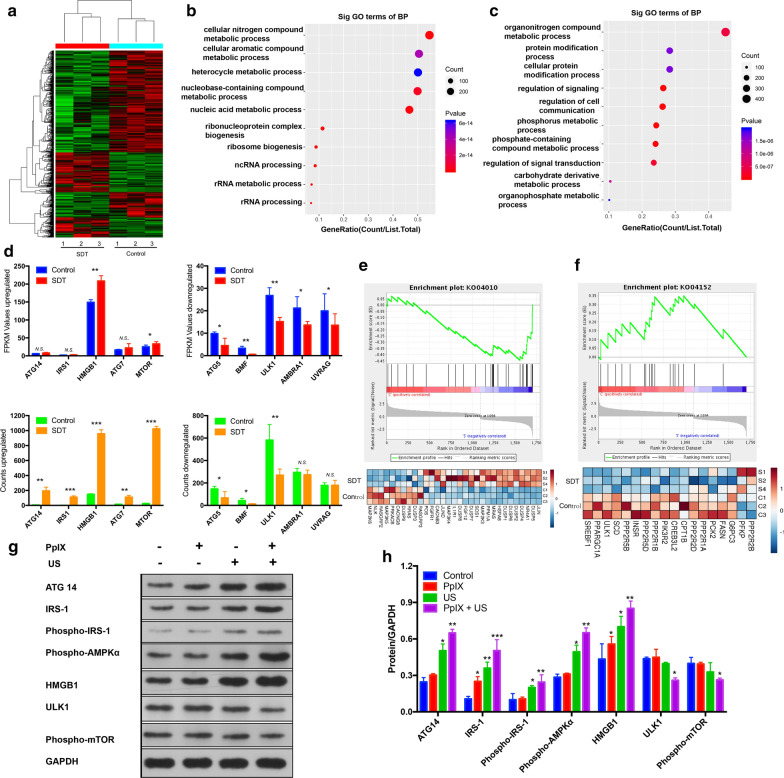
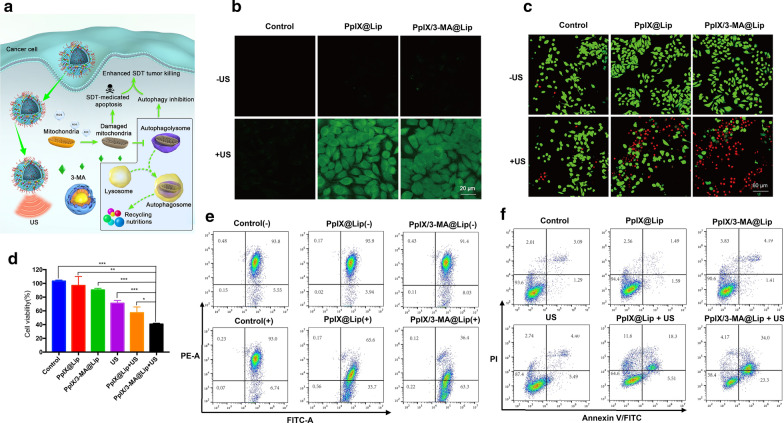
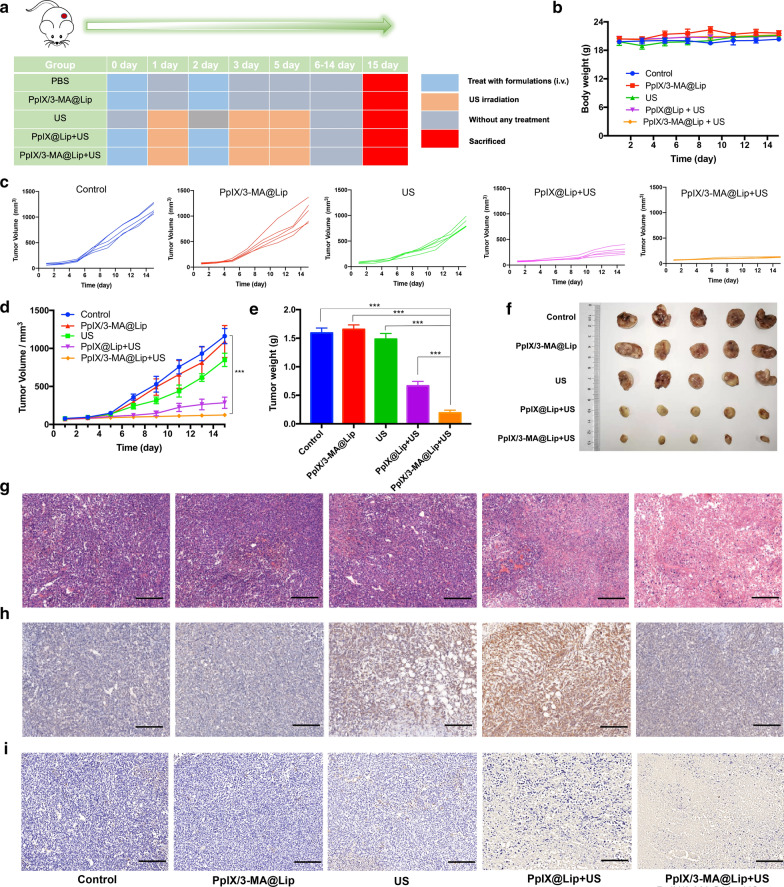
Ultrasound-triggered sonodynamic therapy (SDT) represents an emerging therapeutic modality for cancer treatment based on its specific feature of noninvasiveness, high tissue-penetrating depth and desirable therapeutic efficacy, but the SDT-induced pro-survival cancer-cell autophagy would significantly lower the SDT efficacy for cancer treatment. Here we propose an "all-in-one" combined tumor-therapeutic strategy by integrating nanosonosensitizers-augmented noninvasive SDT with autophagy inhibition based on the rationally constructed nanoliposomes that co-encapsulates clinically approved sonosensitizers protoporphyrin IX (PpIX) and early-phase autophagy-blocking agent 3-methyladenine (3-MA). It has been systematically demonstrated that nanosonosensitizers-augmented SDT induced cytoprotective pro-survival autophagy through activation of MAPK signaling pathway and inhibition of AMPK signaling pathway, and this could be efficaciously inhibited by 3-MA in early-phase autophagy, which significantly decreased the cell resistance to intracellular oxidative stress and complied a remarkable synergistic effect on SDT medicated cancer-cell apoptosis both in vitro at cellular level and in vivo on tumor-bearing animal model. Therefore, our results provide a proof-of-concept combinatorial tumor therapeutics based on nanosonosensitizers for the treatment of ROS-resistant cancer by autophagy inhibition-augmented SDT.

Keywords: Autophagy; Autophagy inhibition; Nanoliposomes; Sonodynamic therapy; Tumor therapy.


Conflict of interest statement

No potential conflict of interest was reported by the authors.

Figures

Fig. 1
Fig. 1
Engineering PpIX/3-MA@Lip nanosonosentizer for synergistic SDT nanotherapeutics and autophagy blockage on combating cancer. Synthetic procedure of PpIX/3-MA@Lip nanosonosensitizers and schematic illustration of “all-in-one” strategy for cellular mechanism on SDT-induced cytoprotective autophagy and autophagy inhibition-enhanced antitumor efficacy of SDT. Enhanced production of intracellular ROS radicals by PpIX sonosensitizers-based SDT induced cytoprotective pro-survival autophagy, and the integrated 3-MA inhibited the formation of autophagosomes in early-phase autophagy to eliminate the recycling nutrients for fulfilling the needs of cancer-cell adaptation and growth, which significantly induced the cancer-cell apoptosis and death
Fig. 2
Fig. 2
Structure, composition and physiochemical property characterizations of PpIX/3-MA@Lip nanoliposomes. a Synthetic procedure of PpIX/3-MA@Lip nanosonosensitizers. b TEM image of PpIX/3-MA@Lip nanoliposomes. Scale bar = 200 nm. c Hydrodynamic diameters, and d UV–vis spectra of Lip, PpIX@Lip and PpIX/3-MA@Lip. e Schematic illustration of US-triggered ROS production based on PpIX/3-MA@Lip. f ESR spectra of PpIX/3-MA@Lip with or without US irradiation (1.0 MHz, 1.5 W cm−2, 1 min). TEMP with US irradiation was used for control comparison. g Concentration and h time dependent DPBF absorption spectra of PpIX/3-MA@Lip nanoliposome under US irradiation (1.0 MHz, 1.5 W cm−2, 1 min)
Fig. 3
Fig. 3
In vitro evaluation of autophagy induction by SDT and autophagy inhibition by 3-MA. a, b CLSM images and flow cytometry analysis of MCF-7 breast cancer cells stained by DAPGreen for monitoring cytoprotective autophagy induced by SDT treatment at different time points. c, d Western blot analysis for LC3-I and LC3-II and corresponding quantitative data of LC3-II relative to GAPGH. GAPDH expression level serves as the loading control. Quantitative data are presented as means ± s.d. (n = 3) *P < 0.05, **P < 0.01, and *** P < 0.001. e Western blot analysis for the expressions of autophagy indicator proteins LC3B and p62, and apoptosis indicator protein c-PARP in MCF-7 cells after different treatments. GAPDH was used as a loading control. f CLSM images of MCF-7 cells stained by DAPGreen treated with nothing (control), PpIX, US, SDT, SDT + NAC, and SDT + 3-MA. g TEM images of MCF-7 cells treated with nothing (control), PpIX, US, SDT, SDT + NAC, and SDT + 3-MA. Red arrows indicate autophagosome and green arrows indicate autolysosome
Fig. 4
Fig. 4
Transcriptome high throughput sequencing of mRNA expressions with SDT. a Heat map diagram of 1095 differentially expressing mRNAs including 561 up-regulations and 534 down-regulations. b, c Corresponding gene expression ratios for up-regulated and down-regulated GO classifications. d FPKM value and counts of typical mRNA expressions associated with cytoprotective autophagy treated with SDT. Values are presented as means ± s.d. (n = 3) *P < 0.05, **P < 0.01, and n.s. for non-significant. e, f Gene set enrichment analysis (GSEA) for autophagy-related signaling pathway after SDT. g, h Western blot verification analysis for the expressions of autophagy-related proteins after SDT. GAPDH was used as a loading control. Quantitative data are presented as means ± s.d. (n = 3) *P < 0.05, **P < 0.01, and *** P < 0.001
Fig. 5
Fig. 5
In vitro autophagy inhibition-enhanced SDT efficacy by accelerating cell apoptosis. a The synergistic anti-tumor mechanism of SDT and autophagy inhibition. b, c CLSM images of MCF-7 cells stained with DCFH-DA for ROS detection, and Calcein-AM/PI for live /dead cells identification after different treatments. d Viability assays of cancer cells. Values are presented as means ± s.d. (n = 3) *P < 0.05, **P < 0.01, ***P < 0.001. e, f Flow cytometry analysis for the destruction of MMP and evaluation of apoptosis at various stages after different treatments
Fig. 6
Fig. 6
In vivo synergistic antitumor efficiency of SDT and autophagy inhibition. a Schematic illustration of tumor-bearing mice treated with different formulations under US irradiation (1.0 MHz, 2.5 W cm−2, 50% duty cycle, 5 min) (n = 5). b Curves of body weight of tumor-bearing mice with different treatments during 15 days. c, d Tumor-volume evolutions during the therapeutic period. e Average tumor weights and f photograph images of excised tumors from different groups on the 15th day. Values are presented as means ± s.d. (n = 5) ***P < 0.001. g H&E, h) LC3, and i TUNEL staining images of excised tumors from different groups. Scale bar = 100 μm

References

    1. Katheder NS, Khezri R, O'Farrell F, et al. Microenvironmental autophagy promotes tumour growth. Nature. 2017;541:417–420. doi: 10.1038/nature20815. - DOI - PMC - PubMed
    1. Galluzzi L, Green DR. Autophagy-independent functions of the autophagy machinery. Cell. 2019;177:1682–1699. doi: 10.1016/j.cell.2019.05.026. - DOI - PMC - PubMed
    1. Dikic I, Elazar Z. Mechanism and medical implications of mammalian autophagy. Nat Rev Mol Cell Biol. 2018;19:349–364. doi: 10.1038/s41580-018-0003-4. - DOI - PubMed
    1. Kim KH, Lee MS. Autophagy–a key player in cellular and body metabolism. Nat Rev Endocrinol. 2014;10:322–337. doi: 10.1038/nrendo.2014.35. - DOI - PubMed
    1. Gump JM, Staskiewicz L, Morgan MJ, et al. Autophagy variation within a cell population determines cell fate through selective degradation of Fap-1. Nat Cell Biol. 2014;16:47–54. doi: 10.1038/ncb2886. - DOI - PMC - PubMed

MeSH terms

LinkOut - more resources