. 2021 Apr 20;13(1):64.
doi: 10.1186/s13073-021-00881-3.

IFN-γ and TNF-α drive a CXCL10+ CCL2+ macrophage phenotype expanded in severe COVID-19 lungs and inflammatory diseases with tissue inflammation

Affiliations

IFN-γ and TNF-α drive a CXCL10+ CCL2+ macrophage phenotype expanded in severe COVID-19 lungs and inflammatory diseases with tissue inflammation

Fan Zhang et al. Genome Med. .

Abstract

Background: Immunosuppressive and anti-cytokine treatment may have a protective effect for patients with COVID-19. Understanding the immune cell states shared between COVID-19 and other inflammatory diseases with established therapies may help nominate immunomodulatory therapies.

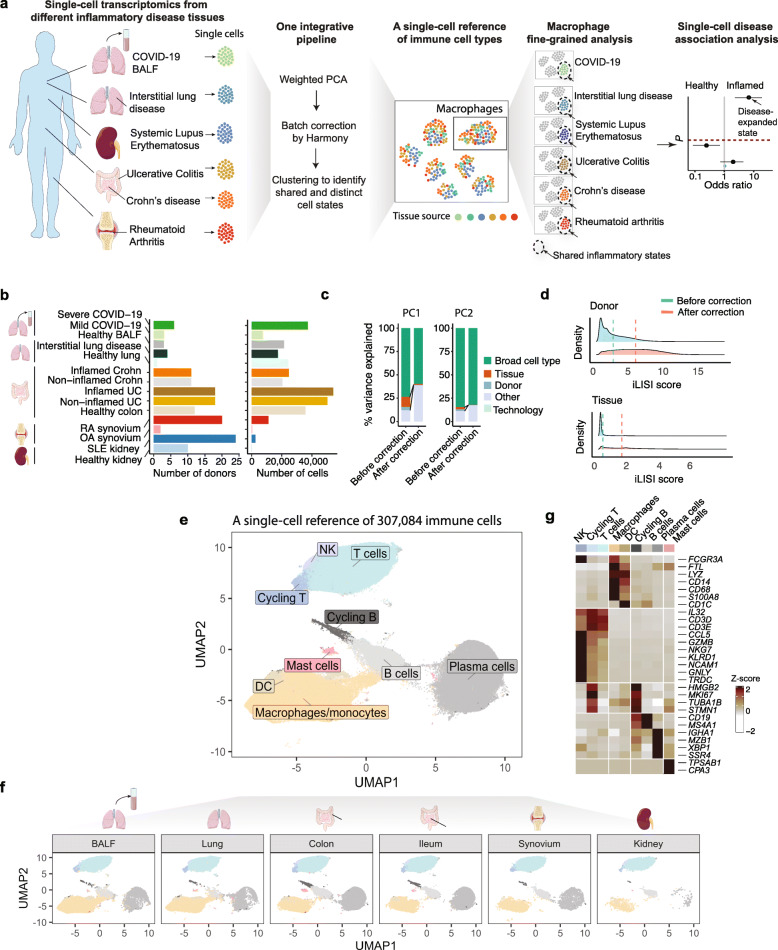
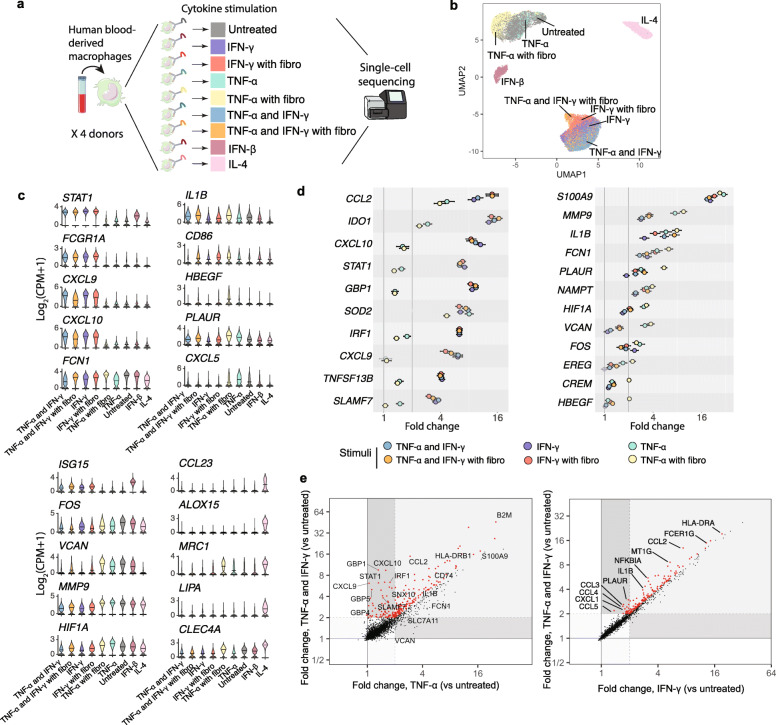
Methods: To identify cellular phenotypes that may be shared across tissues affected by disparate inflammatory diseases, we developed a meta-analysis and integration pipeline that models and removes the effects of technology, tissue of origin, and donor that confound cell-type identification. Using this approach, we integrated > 300,000 single-cell transcriptomic profiles from COVID-19-affected lungs and tissues from healthy subjects and patients with five inflammatory diseases: rheumatoid arthritis (RA), Crohn's disease (CD), ulcerative colitis (UC), systemic lupus erythematosus (SLE), and interstitial lung disease. We tested the association of shared immune states with severe/inflamed status compared to healthy control using mixed-effects modeling. To define environmental factors within these tissues that shape shared macrophage phenotypes, we stimulated human blood-derived macrophages with defined combinations of inflammatory factors, emphasizing in particular antiviral interferons IFN-beta (IFN-β) and IFN-gamma (IFN-γ), and pro-inflammatory cytokines such as TNF.

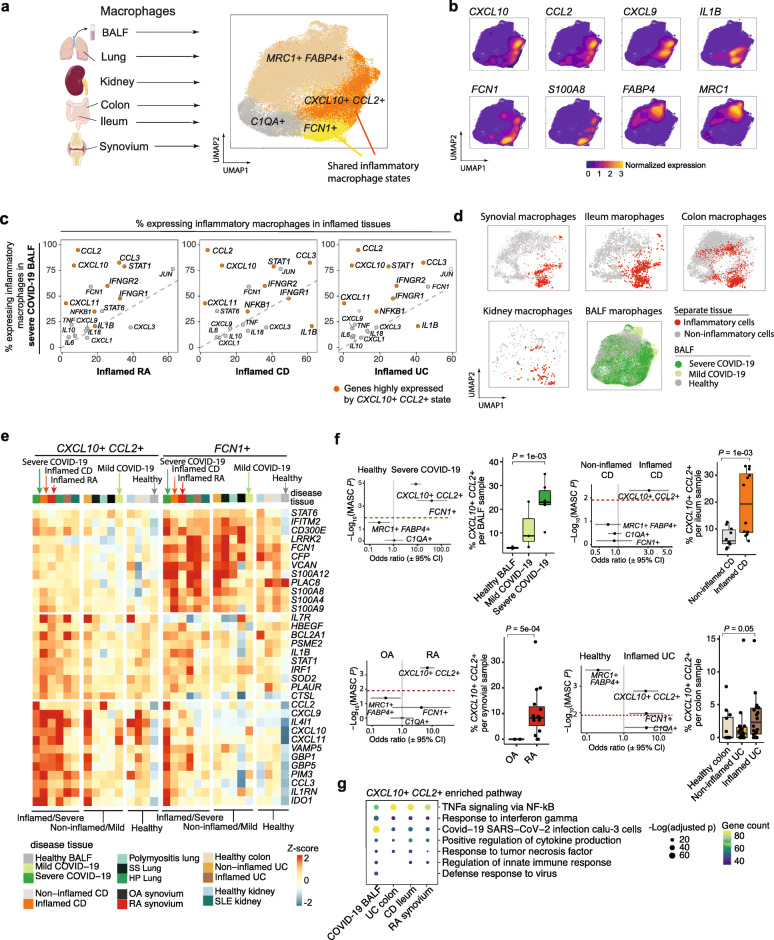
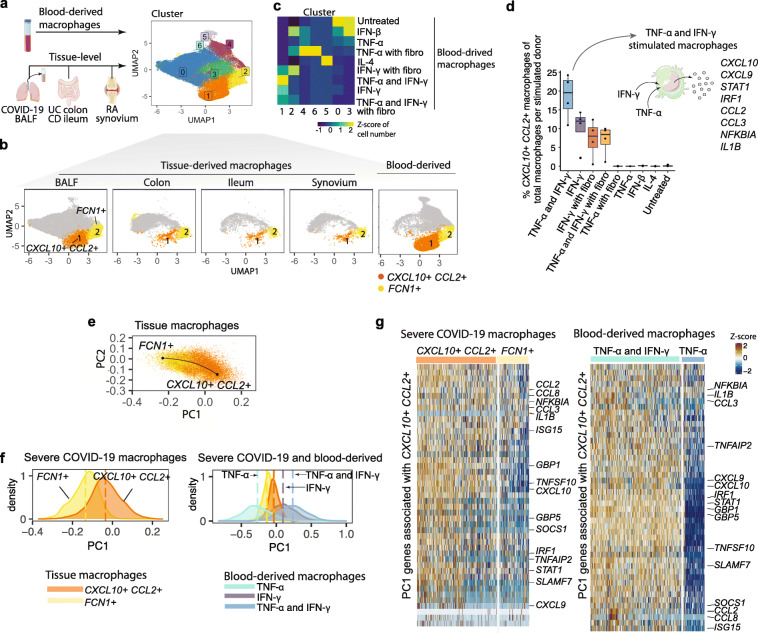
Results: We built an immune cell reference consisting of > 300,000 single-cell profiles from 125 healthy or disease-affected donors from COVID-19 and five inflammatory diseases. We observed a CXCL10+ CCL2+ inflammatory macrophage state that is shared and strikingly abundant in severe COVID-19 bronchoalveolar lavage samples, inflamed RA synovium, inflamed CD ileum, and UC colon. These cells exhibited a distinct arrangement of pro-inflammatory and interferon response genes, including elevated levels of CXCL10, CXCL9, CCL2, CCL3, GBP1, STAT1, and IL1B. Further, we found this macrophage phenotype is induced upon co-stimulation by IFN-γ and TNF-α.

Conclusions: Our integrative analysis identified immune cell states shared across inflamed tissues affected by inflammatory diseases and COVID-19. Our study supports a key role for IFN-γ together with TNF-α in driving an abundant inflammatory macrophage phenotype in severe COVID-19-affected lungs, as well as inflamed RA synovium, CD ileum, and UC colon, which may be targeted by existing immunomodulatory therapies.

Keywords: COVID-19; Inflammatory diseases; Macrophage heterogeneity; Macrophage stimulation; Single-cell multi-disease tissue integration; Single-cell transcriptomics.


Conflict of interest statement

The authors declare that they have no competing interests.

Figures

Fig. 1
Fig. 1
Integrative analysis of > 300,000 single-cell profiles from five inflammatory disease tissues and COVID-19 BALF. a Overall study design and single-cell analysis, including the integrative pipeline, a single-cell reference dataset, fine-grained analysis to identify shared macrophage states, and disease association analysis. b Number of cells and donor samples from each healthy and disease tissue. c Percent of variance explained in the gene expression data by pre-defined broad cell type, tissue, sample, and technology for the first and second principal component (PC1 and PC2) before and after batch effect correction. d iLISI score before and after batch correction to measure the mixing levels of donor samples and tissue sources. An iLISI (integration LISI) score of 1.0 denotes no mixing while higher scores indicate better mixing of batches. e Integrative clustering of 307,084 cells reveals common immune cell types from different tissue sources. f Immune cells from separate tissue sources in the same UMAP coordinates. Cells from the same cell types are projected next to each other in the integrative UMAP space. g Heatmap of cell-type lineage marker genes. Gene signatures were selected based on AUC > 0.6 and P < 0.05 by Bonferroni correction comparing cells from one cell type to the others
Fig. 2
Fig. 2
Integrative analysis of tissue-level macrophages reveals shared CXCL10+ CCL2+ and FCN1+ inflammatory macrophage states. a Integrative clustering of 74,373 macrophages from individuals from BALF, lung, kidney, colon, ileum, and synovium. b Density plot of cells with non-zero expression of marker genes in UMAP. c Proportion of inflammatory macrophages that express cytokines and inflammatory genes in severe COVID-19 compared to those in inflamed RA, CD, and UC. Orange represents CXCL10+ CCL2+ state-specific genes. d Previously defined inflammatory macrophages from diseased tissues are clustered with the majority of the macrophages from severe COVID-19. e Z-score of the pseudo-bulk expression of marker genes (AUC > 0.6 and Bonferroni-adjusted P < 10−5) for the CXCL10+ CCL2+ and FCN1+ macrophages. Columns show pseudo-bulk expression. f The proportions of CXCL10+ CCL2+ macrophages of total macrophages per donor sample are shown from healthy BALF (n = 3), mild (n = 3), and severe (n = 6) COVID-19, non-inflamed CD (n = 10) and inflamed CD (n = 12), OA (n = 2) and RA (n = 15), and healthy colon (n = 12), non-inflamed UC (n = 18), and inflamed UC (n = 18). Box plots summarize the median, interquartile, and 75% quantile range. P is calculated by Wilcoxon rank-sum test within each tissue. The association of each cluster with severe/inflamed compared to healthy control was tested. 95% CI for the odds ratio (OR) is given. MASC P is calculated using one-sided F tests conducted on nested models with MASC [36]. The clusters above the dashed line (Bonferroni correction) are statistically significant. Clusters that have fewer than 30 cells are removed. g GSEA analysis for each tissue revealed shared enriched pathways for CXCL10+ CCL2+ macrophages: TNF-α signaling via NF-kB (Hallmark gene set), response to interferon gamma (GO:0034341), Covid-19 SARS-CoV-2 infection calu-3 cells (GSE147507 [39]), positive regulation of cytokine production (GO:0001819), response to tumor necrosis factor (GO:0034612), regulation of innate immune response (GO:0045088), and defense response to virus (GO: 0051607)
Fig. 3
Fig. 3
Human blood-derived macrophages stimulated by eight mixtures of inflammatory factors reveal heterogeneous macrophage phenotypes. a Schematic representation of the single-cell cell hashing experiment on human blood-derived macrophages stimulated by eight mixtures of inflammatory factors from 4 donors. A single-cell antibody-based hashing strategy was used to multiplex samples from different stimulatory conditions in one sequencing run. Here fibro denotes fibroblasts. b The 25,823 stimulated blood-derived macrophages from 4 donors are colored and labeled in UMAP space. c Log-normalized expression of genes that are specific to different conditions are displayed in violin plots. Mean of normalized gene expression is marked by a line and each condition by individual coloring. CPM denotes counts per million. d Stimulation effect estimates of genes that are most responsive to conditions with IFN-γ or TNF-α with fibroblasts comparing to untreated macrophages are obtained using linear modeling. Fold changes with 95% CI are shown. e Fold changes in gene expression after TNF-α and IFN-γ stimulation vs. TNF-α stimulation (left), and TNF-α and IFN-γ vs. IFN-γ stimulation (right) for each gene. Genes in red have fold change > 2, Bonferroni-adjusted P < 10−7, and a ratio of TNF-α and IFN-γ fold change to TNF-α fold change greater than 1 (left) or a ratio of TNF-α and IFN-γ fold change to IFN-γ fold change greater than 1 (right). Genes that are most responsive to either IFN-γ (left) or TNF-α (right) are labeled
Fig. 4
Fig. 4
TNF-α and IFN-γ driven CXCL10+ CCL2+ macrophages are expanded in severe COVID-19 and other inflamed tissues. a Integrative clustering of stimulated blood-derived macrophages with tissue-level macrophages from COVID-19 BALF, UC colon, CD ileum, and RA synovium. b The previously identified tissue-level CXCL10+ CCL2+ state corresponds to cluster 1 (orange), and the FCN1+ inflammatory macrophage state corresponds to cluster 2 (yellow). Macrophages from each tissue source are displayed separately in the same UMAP coordinates as in a. c Heatmap indicates the concordance between stimulatory conditions and integrative cluster assignments. Z-score of the number of cells from each stimulatory condition to the integrative clusters is shown. d For the blood-derived stimulated macrophages, the proportions of CXCL10+ CCL2+ macrophages of total macrophages per stimulated donor are shown. e PCA analysis on the identified inflammatory macrophages. The first PC captures a gradient from the FCN1+ state to the CXCL10+ CCL2+ state. f Upon this, macrophages from severe COVID-19 mapped to PC1 present a shift in cell frequency between the FCN1+ and CXCL10+ CCL2+ (Wilcoxon rank-sum test P = 1.4e−07). The TNF-α stimulated macrophages (mean − 0.27) were projected to the left of the FCN1+ tissue macrophages (mean − 0.14), while the IFN-γ (mean 0.10), and TNF-α and IFN-γ (mean 0.23), stimulated macrophages were projected to the right of the CXCL10+ CCL2+ tissue macrophages (− 0.03). g Genes associated with CXCL10+ CCL2+ driven by PC1 show high expression levels on the severe COVID-19 macrophages and also TNF-α and IFN-γ stimulated blood-derived macrophages. We recapitulate the gradient observed in vivo across multiple diseases by stimulating macrophages ex vivo with synergistic combinations of TNF-α and IFN-γ

Update of

Similar articles

Cited by

References

    1. McInnes IB, Schett G. The pathogenesis of rheumatoid arthritis. N Engl J Med. 2011;365(23):2205–2219. doi: 10.1056/NEJMra1004965. - DOI - PubMed
    1. Neurath MF. Cytokines in inflammatory bowel disease. Nat Rev Immunol. 2014;14(5):329–342. doi: 10.1038/nri3661. - DOI - PubMed
    1. Liu J, Zheng X, Tong Q, Li W, Wang B, Sutter K, Trilling M, Lu M, Dittmer U, Yang D. Overlapping and discrete aspects of the pathology and pathogenesis of the emerging human pathogenic coronaviruses SARS-CoV, MERS-CoV, and 2019-nCoV. J Med Virol. 2020;92(5):491–494. doi: 10.1002/jmv.25709. - DOI - PMC - PubMed
    1. Liao M, Liu Y, Yuan J, Wen Y, Xu G, Zhao J, Cheng L, Li J, Wang X, Wang F, Liu L, Amit I, Zhang S, Zhang Z. Single-cell landscape of bronchoalveolar immune cells in patients with COVID-19. Nat Med. 2020;26(6):842–844. doi: 10.1038/s41591-020-0901-9. - DOI - PubMed
    1. Wen W, Su W, Tang H, le W, Zhang X, Zheng Y, Liu X, Xie L, Li J, Ye J, Dong L, Cui X, Miao Y, Wang D, Dong J, Xiao C, Chen W, Wang H. Immune cell profiling of COVID-19 patients in the recovery stage by single-cell sequencing. Cell Discov. 2020;6(1):31. doi: 10.1038/s41421-020-0168-9. - DOI - PMC - PubMed

Publication types

MeSH terms