

Characteristics and outcomes following motorized and non-motorized vehicular trauma in a resource-limited setting
- PMID: 33879340
- PMCID: PMC8429052
- DOI: 10.1016/j.injury.2021.04.035
Characteristics and outcomes following motorized and non-motorized vehicular trauma in a resource-limited setting
Abstract
Introduction: Despite the ubiquity of motorized vehicular transport, non-motorized transportation continues to be common in sub-Saharan Africa.
Methods: We performed a retrospective analysis of trauma patients presenting to Kamuzu Central Hospital in Malawi from February 2008 to May 2018. Demographic and clinical variables including injury characteristics and outcomes were collected. We performed bivariate and multivariate logistic regression to determine predictors of mortality following non-motorized vehicular trauma.
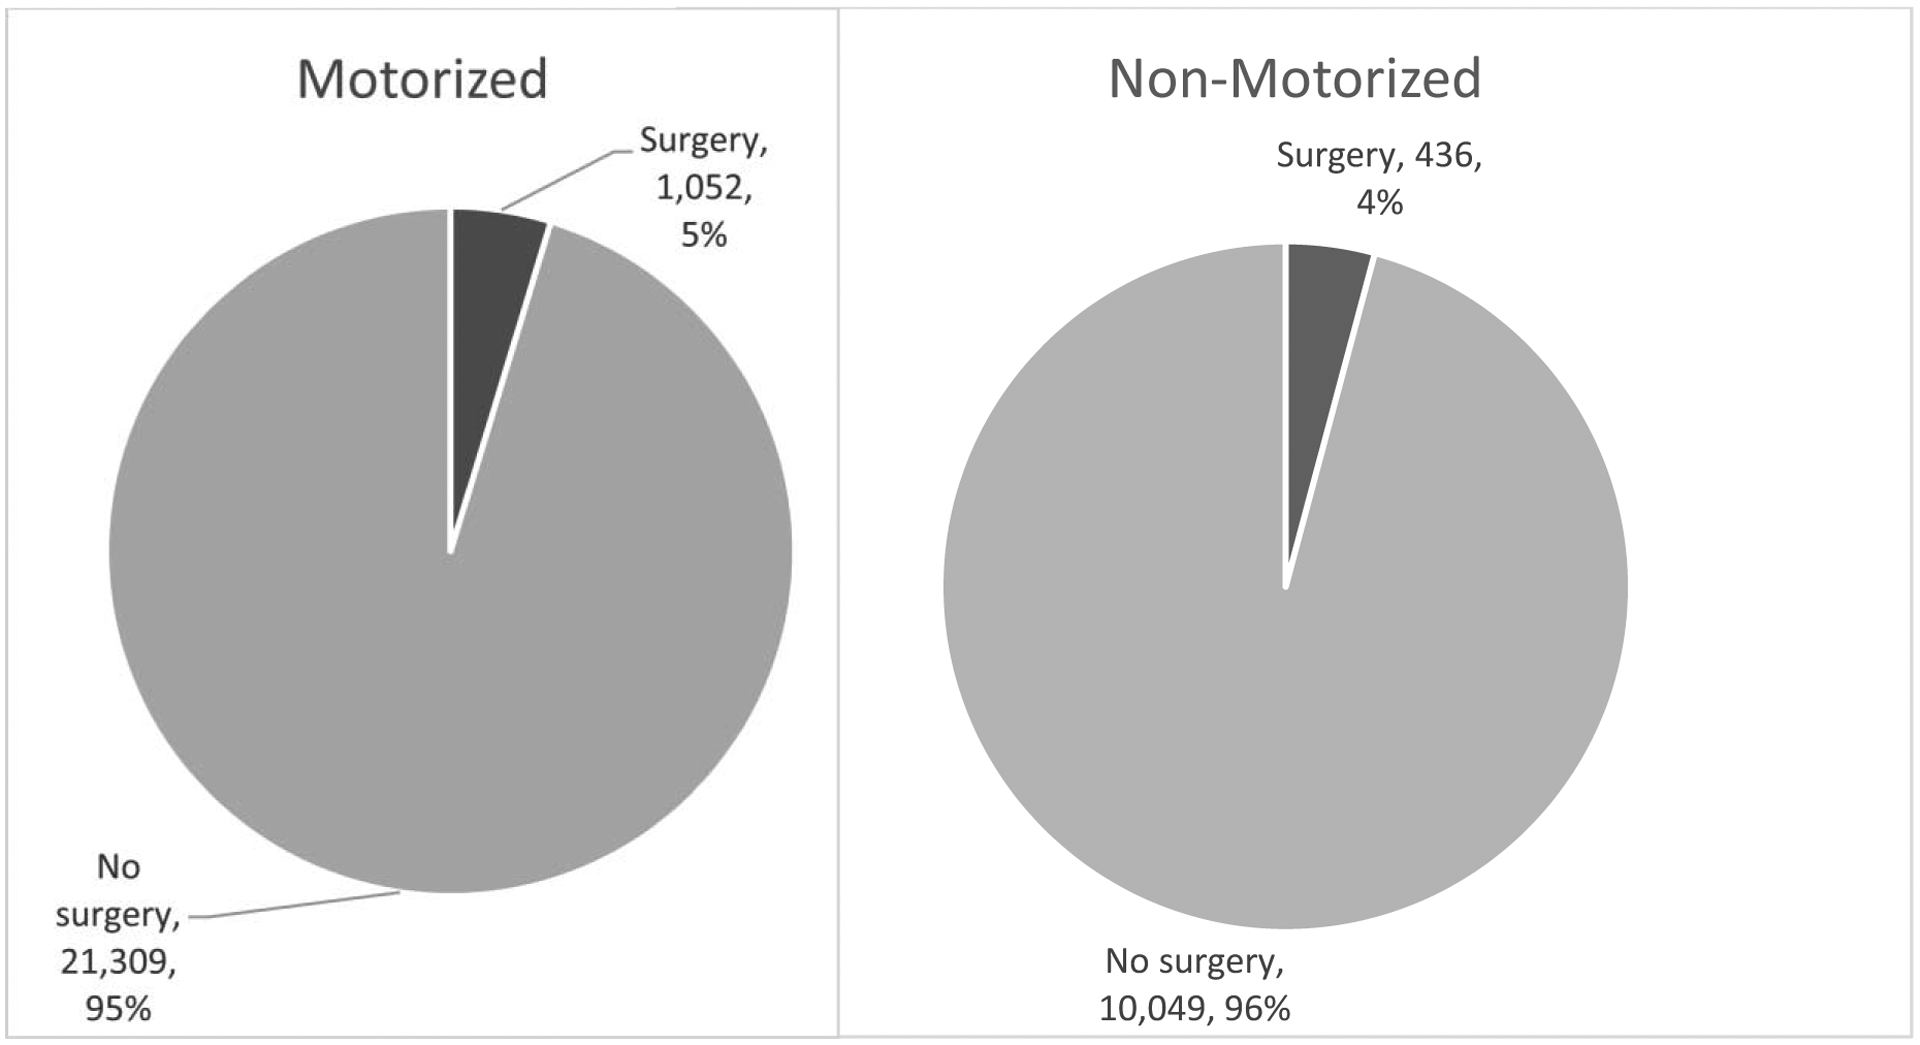
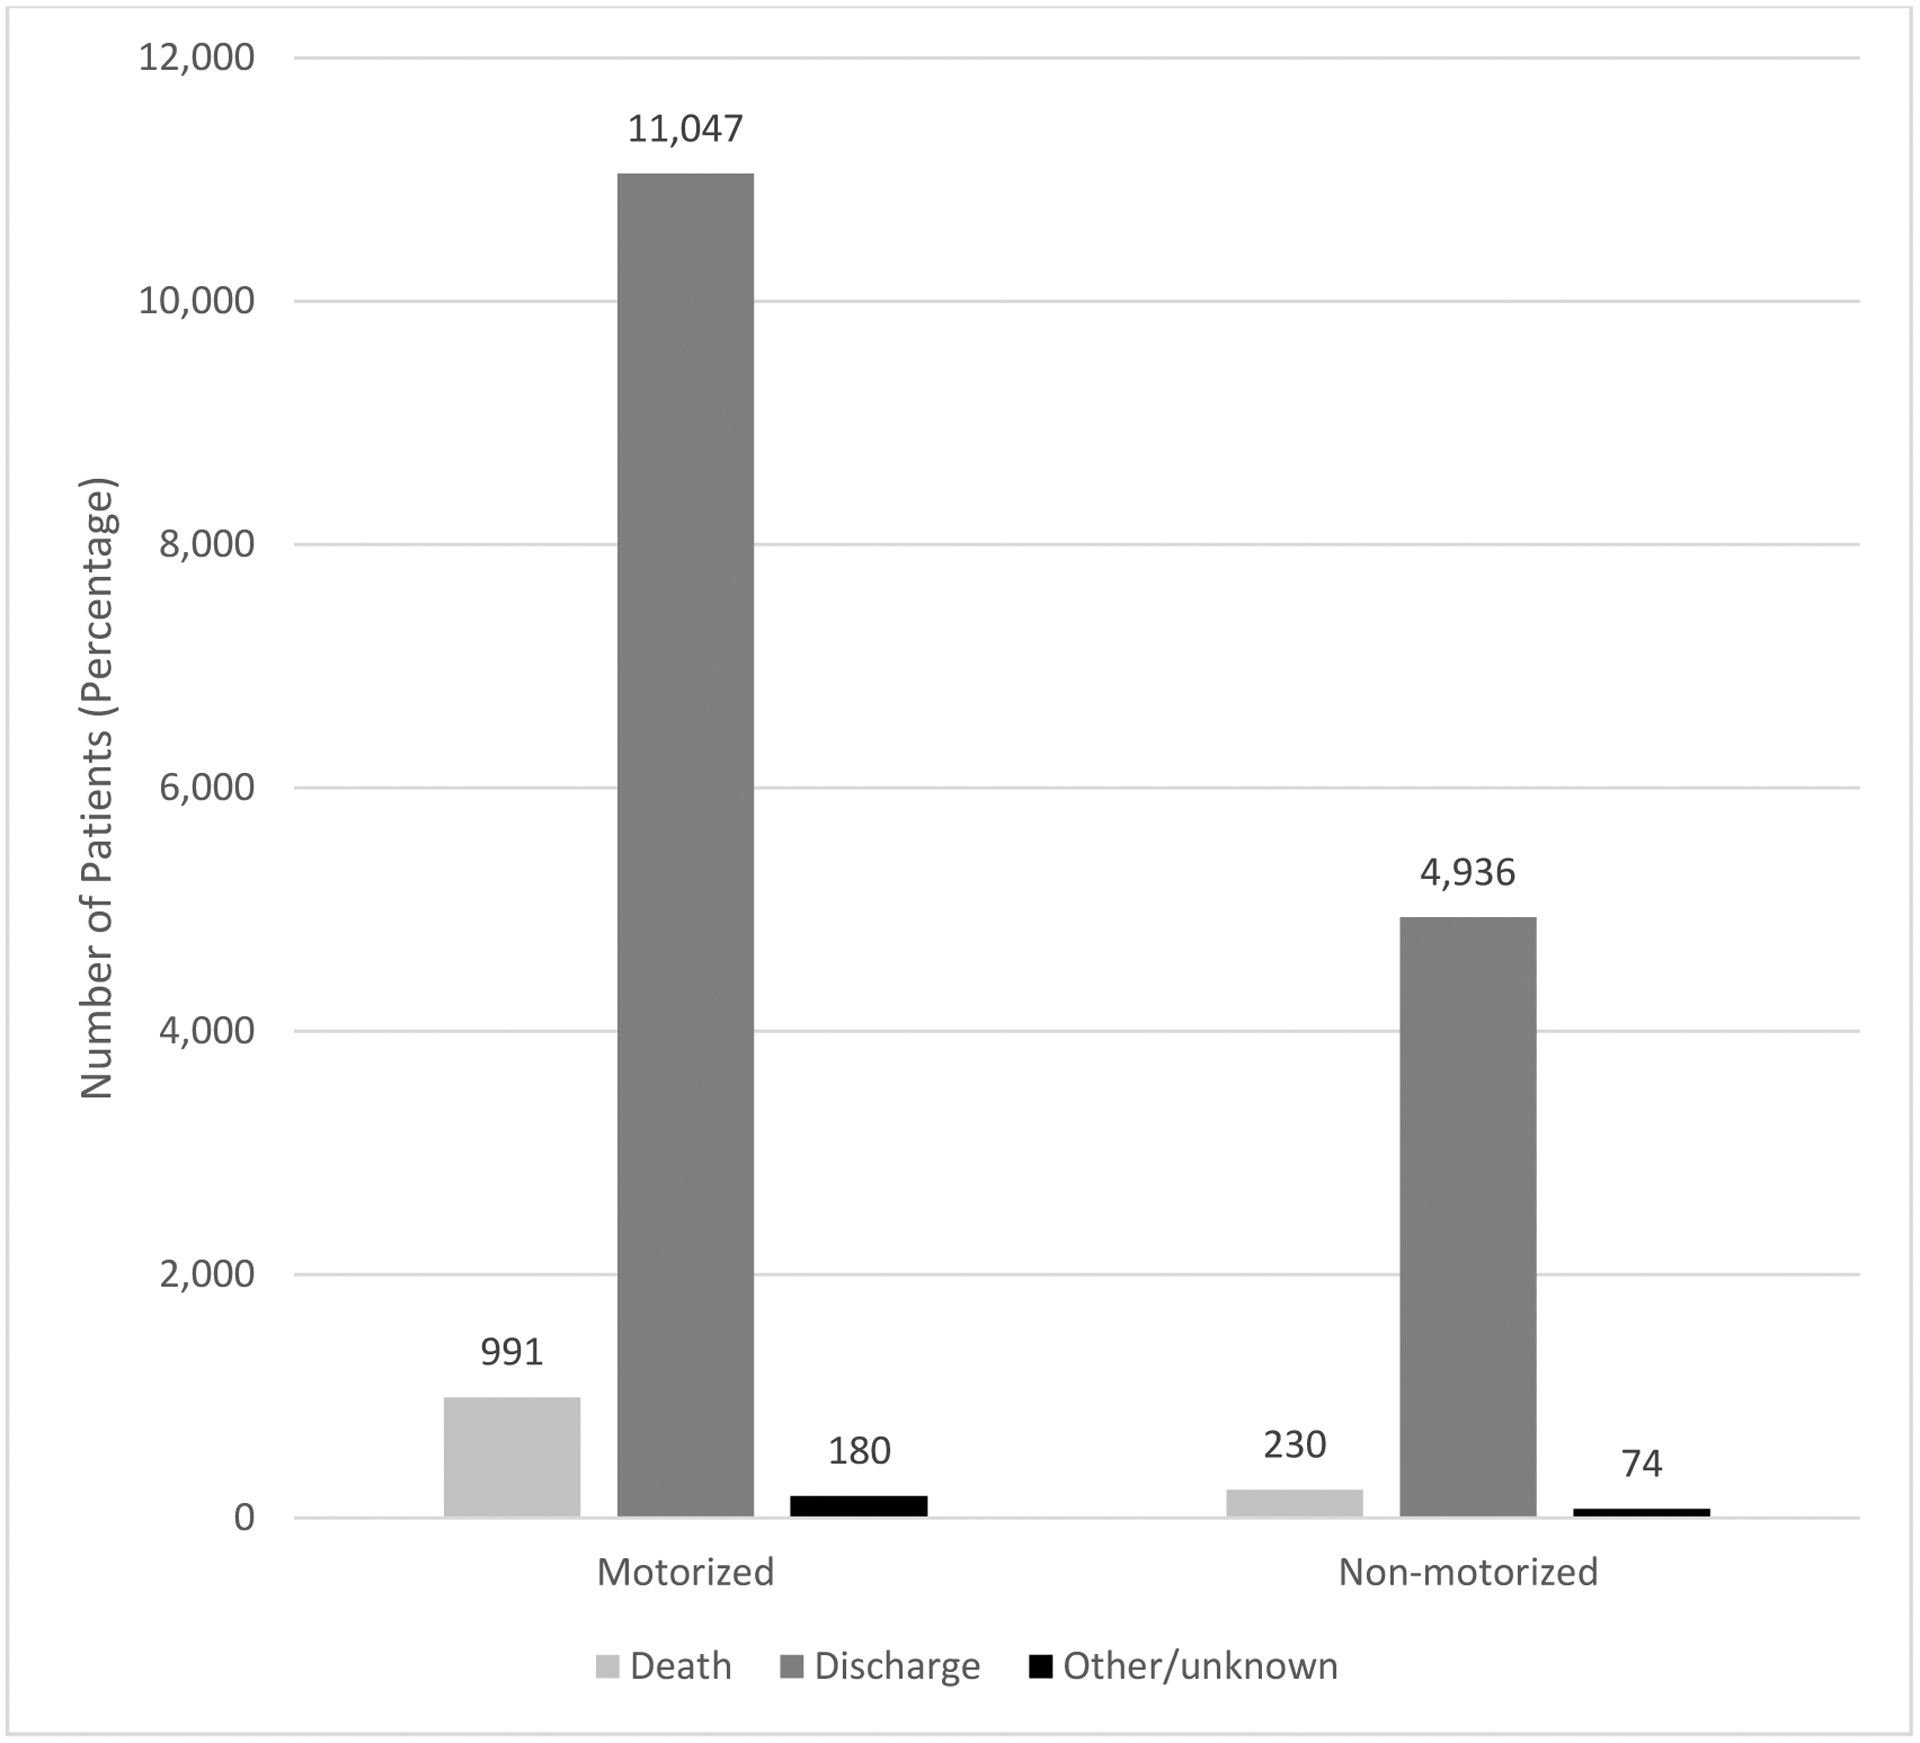
Results: This study included 36,412 patients involved in vehicular road injuries. Patients in the non-motorized group had a preponderance of men (84% versus 73%, p<0.01). The proportion of patients with Glasgow Coma Scale > 8 was slightly higher in the non-motorized group (99% versus 98%, p<0.01), though injury severity did not differ significantly between the two groups. A higher proportion in the motorized group had the most severe injury of contusions and abrasions (56% versus 50%, p<0.01). In contrast, the non-motorized group had a higher proportion of orthopedic injuries (24% versus 16%, p<0.01). The crude mortality rate was 4.51% and 2.15% in the motorized and non-motorized groups, respectively. After controlling for demographic factors and injury severity, the incidence rate ratio of mortality did not differ significantly between motorized and non-motorized trauma groups (IRR 0.91, p=0.35).
Conclusions: Non-motorized vehicular trauma remains a significant proportion of morbidity and mortality resulting from road traffic injuries. The injury severity and incidence rate ratio of mortality did not differ between motorized and non-motorized trauma groups. Health care providers should not underestimate the severity of injuries from non-motorized trauma.
Keywords: Animal drawn transportation; Injury; Non motorized vehicular injury; Trauma.
Copyright © 2021. Published by Elsevier Ltd.
Conflict of interest statement
Declaration of Competing Interest The authors whose names are listed immediately below certify that they have NO affiliations with or involvement in any organization or entity with any financial interest (such as honoraria; educational grants; participation in speakers’ bureaus; membership, employment, consultancies, stock ownership, or other equity interest; and expert testimony or patent-licensing arrangements), or non-financial interest (such as personal or professional relationships, affiliations, knowledge or beliefs) in the subject matter or materials discussed in this manuscript.
Figures
Similar articles
-
Police Transportation Following Vehicular Trauma and Risk of Mortality in a Resource-Limited Setting.World J Surg. 2021 Mar;45(3):662-667. doi: 10.1007/s00268-020-05853-z. Epub 2020 Nov 8. World J Surg. 2021. PMID: 33164113 Free PMC article.
-
Hospital mortality following trauma: an analysis of a hospital-based injury surveillance registry in sub-Saharan Africa.J Surg Educ. 2015 Jul-Aug;72(4):e66-72. doi: 10.1016/j.jsurg.2014.09.010. Epub 2014 Nov 4. J Surg Educ. 2015. PMID: 25451718
-
Epidemiological Comparisons and Risk Factors for Pre-hospital and In-Hospital Mortality Following Traumatic Injury in Malawi.World J Surg. 2020 Jul;44(7):2116-2122. doi: 10.1007/s00268-020-05470-w. World J Surg. 2020. PMID: 32157403 Free PMC article.
-
Effect of direct and indirect transfer status on trauma mortality in sub Saharan Africa.Injury. 2016 May;47(5):1118-22. doi: 10.1016/j.injury.2016.01.015. Epub 2016 Jan 23. Injury. 2016. PMID: 26838937 Free PMC article.
-
Elderly trauma mortality in a resource-limited setting: A benchmark for process improvement.Injury. 2021 Sep;52(9):2651-2656. doi: 10.1016/j.injury.2021.07.001. Epub 2021 Jul 8. Injury. 2021. PMID: 34272049 Free PMC article.
Cited by
-
The utility of alcohol saliva test strips compared to the breathalyzer in trauma patients in a resource-limited setting.World J Surg. 2024 Dec;48(12):3014-3019. doi: 10.1002/wjs.12384. Epub 2024 Nov 2. World J Surg. 2024. PMID: 39487692
References
-
- World Health Organization. Global status report on road safety: time for action. Geneva, 2009.
-
- World Health Organization. Global status report on road safety 2013: supporting a decade of action. Geneva: World Health Organization; 2013.
-
- World Health Organization. Global status report on road safety 2015.
MeSH terms
Grants and funding
LinkOut - more resources
Full Text Sources
Other Literature Sources
Medical
