

An alternative resource allocation strategy in the chemolithoautotrophic archaeon Methanococcus maripaludis
- PMID: 33879571
- PMCID: PMC8072206
- DOI: 10.1073/pnas.2025854118
An alternative resource allocation strategy in the chemolithoautotrophic archaeon Methanococcus maripaludis
Abstract
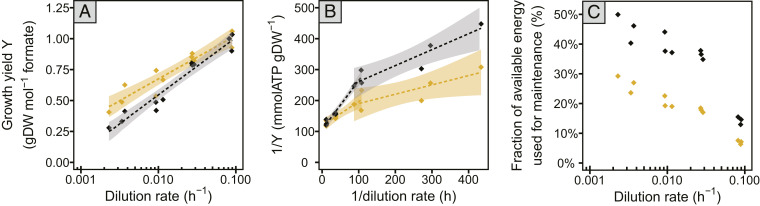
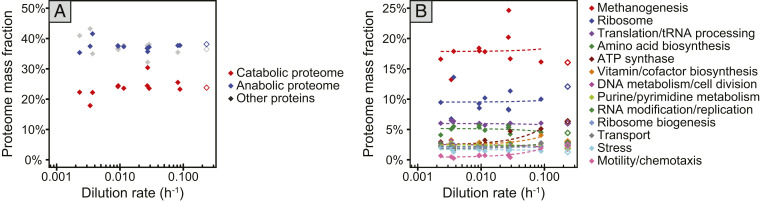
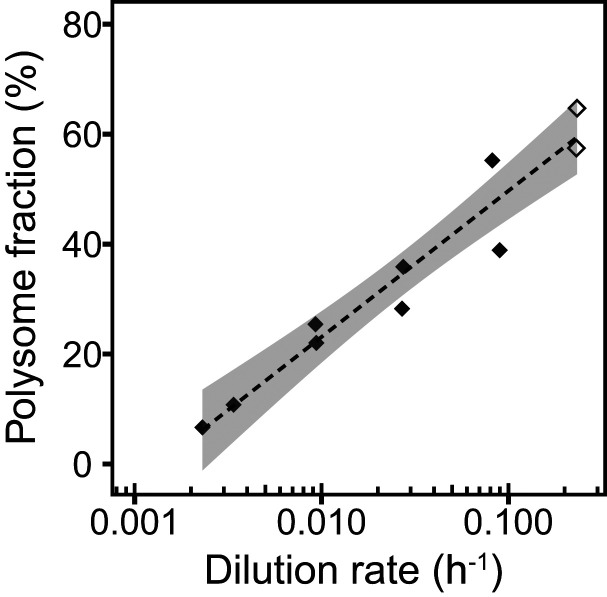
Most microorganisms in nature spend the majority of time in a state of slow or zero growth and slow metabolism under limited energy or nutrient flux rather than growing at maximum rates. Yet, most of our knowledge has been derived from studies on fast-growing bacteria. Here, we systematically characterized the physiology of the methanogenic archaeon Methanococcus maripaludis during slow growth. M. maripaludis was grown in continuous culture under energy (formate)-limiting conditions at different dilution rates ranging from 0.09 to 0.002 h-1, the latter corresponding to 1% of its maximum growth rate under laboratory conditions (0.23 h-1). While the specific rate of methanogenesis correlated with growth rate as expected, the fraction of cellular energy used for maintenance increased and the maintenance energy per biomass decreased at slower growth. Notably, proteome allocation between catabolic and anabolic pathways was invariant with growth rate. Unexpectedly, cells maintained their maximum methanogenesis capacity over a wide range of growth rates, except for the lowest rates tested. Cell size, cellular DNA, RNA, and protein content as well as ribosome numbers also were largely invariant with growth rate. A reduced protein synthesis rate during slow growth was achieved by a reduction in ribosome activity rather than via the number of cellular ribosomes. Our data revealed a resource allocation strategy of a methanogenic archaeon during energy limitation that is fundamentally different from commonly studied versatile chemoheterotrophic bacteria such as E. coli.
Keywords: maintenance energy; methanogen; proteome allocation; ribosome activity; slow growth.
Conflict of interest statement
The authors declare no competing interest.
Figures


Similar articles
-
Growth rate-dependent coordination of catabolism and anabolism in the archaeon Methanococcus maripaludis under phosphate limitation.ISME J. 2022 Oct;16(10):2313-2319. doi: 10.1038/s41396-022-01278-9. Epub 2022 Jul 2. ISME J. 2022. PMID: 35780255 Free PMC article.
-
Effects of H2 and formate on growth yield and regulation of methanogenesis in Methanococcus maripaludis.J Bacteriol. 2013 Apr;195(7):1456-62. doi: 10.1128/JB.02141-12. Epub 2013 Jan 18. J Bacteriol. 2013. PMID: 23335420 Free PMC article.
-
H2-independent growth of the hydrogenotrophic methanogen Methanococcus maripaludis.mBio. 2013 Feb 26;4(2):e00062-13. doi: 10.1128/mBio.00062-13. mBio. 2013. PMID: 23443005 Free PMC article.
-
Metabolic processes of Methanococcus maripaludis and potential applications.Microb Cell Fact. 2016 Jun 10;15(1):107. doi: 10.1186/s12934-016-0500-0. Microb Cell Fact. 2016. PMID: 27286964 Free PMC article. Review.
-
Development of genetic approaches for the methane-producing archaebacterium Methanococcus maripaludis.Biofactors. 1997;6(1):37-46. doi: 10.1002/biof.5520060105. Biofactors. 1997. PMID: 9233538 Review.
Cited by
-
Growth-rate dependency of ribosome abundance and translation elongation rate in Corynebacterium glutamicum differs from that in Escherichia coli.Nat Commun. 2023 Sep 12;14(1):5611. doi: 10.1038/s41467-023-41176-y. Nat Commun. 2023. PMID: 37699882 Free PMC article.
-
Distantly related bacteria share a rigid proteome allocation strategy with flexible enzyme kinetics.Proc Natl Acad Sci U S A. 2025 May 6;122(18):e2427091122. doi: 10.1073/pnas.2427091122. Epub 2025 Apr 29. Proc Natl Acad Sci U S A. 2025. PMID: 40299698 Free PMC article.
-
An optimal regulation of fluxes dictates microbial growth in and out of steady state.Elife. 2023 Mar 10;12:e84878. doi: 10.7554/eLife.84878. Elife. 2023. PMID: 36896805 Free PMC article.
-
In vitro Activity of Cefepime/Avibactam Against Carbapenem Resistant Klebsiella pneumoniae and Integrative Metabolomics-Proteomics Approach for Resistance Mechanism: A Single-Center Study.Infect Drug Resist. 2023 Sep 11;16:6061-6077. doi: 10.2147/IDR.S420898. eCollection 2023. Infect Drug Resist. 2023. PMID: 37719649 Free PMC article.
-
Shaping of microbial phenotypes by trade-offs.Nat Commun. 2024 May 18;15(1):4238. doi: 10.1038/s41467-024-48591-9. Nat Commun. 2024. PMID: 38762599 Free PMC article. Review.
References
-
- Boetius A., Anesio A. M., Deming J. W., Mikucki J. A., Rapp J. Z., Microbial ecology of the cryosphere: Sea ice and glacial habitats. Nat. Rev. Microbiol. 13, 677–690 (2015). - PubMed
-
- Magnabosco C., et al. ., The biomass and biodiversity of the continental subsurface. Nat. Geosci. (2018).
Publication types
MeSH terms
Substances
Grants and funding
LinkOut - more resources
Full Text Sources
Other Literature Sources
