. 2021 Apr 20;12(2):e00226-21.
doi: 10.1128/mBio.00226-21.

In Vivo Antigen Expression Regulates CD4 T Cell Differentiation and Vaccine Efficacy against Mycobacterium tuberculosis Infection

Affiliations

In Vivo Antigen Expression Regulates CD4 T Cell Differentiation and Vaccine Efficacy against Mycobacterium tuberculosis Infection

Helena Strand Clemmensen et al. mBio. .

Abstract

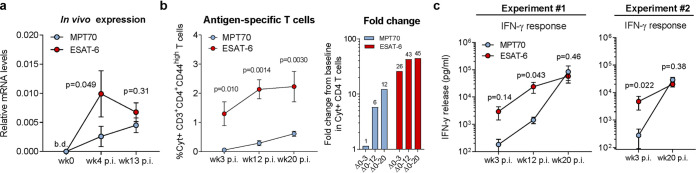
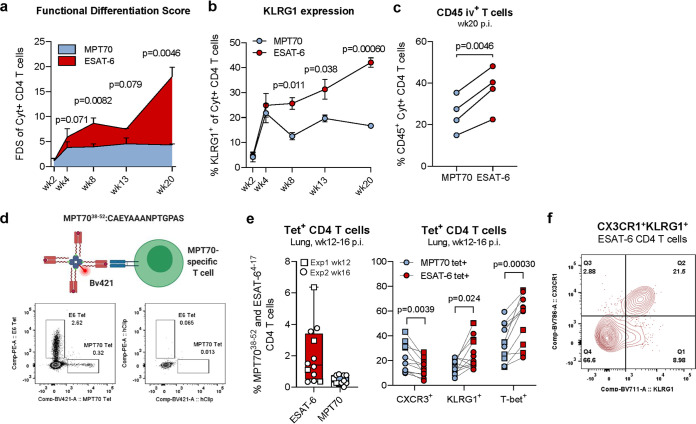
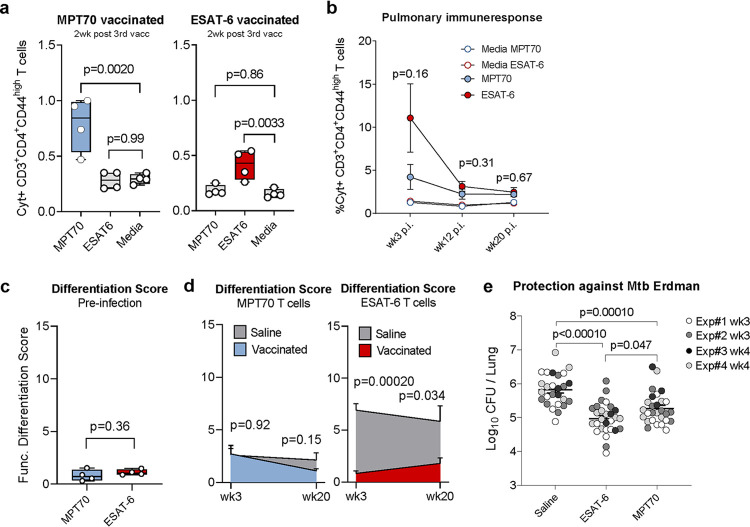
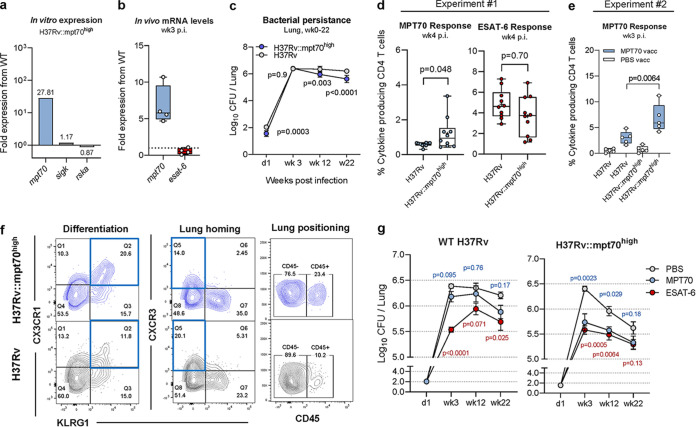
New vaccines are urgently needed against Mycobacterium tuberculosis (Mtb), which kills more than 1.4 million people each year. CD4 T cell differentiation is a key determinant of protective immunity against Mtb, but it is not fully understood how host-pathogen interactions shape individual antigen-specific T cell populations and their protective capacity. Here, we investigated the immunodominant Mtb antigen, MPT70, which is upregulated in response to gamma interferon (IFN-γ) or nutrient/oxygen deprivation of in vitro-infected macrophages. Using a murine aerosol infection model, we compared the in vivo expression kinetics of MPT70 to a constitutively expressed antigen, ESAT-6, and analyzed their corresponding CD4 T cell phenotype and vaccine protection. For wild-type Mtb, we found that in vivo expression of MPT70 was delayed compared to ESAT-6. This delayed expression was associated with induction of less differentiated MPT70-specific CD4 T cells but, compared to ESAT-6, also reduced protection after vaccination. In contrast, infection with an MPT70-overexpressing Mtb strain promoted highly differentiated KLRG1+CX3CR1+ CD4 T cells with limited lung-homing capacity. Importantly, this differentiated phenotype could be prevented by vaccination, and against the overexpressing strain, vaccination with MPT70 conferred protection similar to vaccination with ESAT-6. Together, our data indicate that high in vivo antigen expression drives T cells toward terminal differentiation and that targeted vaccination with adjuvanted protein can counteract this phenomenon by maintaining T cells in a protective less differentiated state. These observations shed new light on host-pathogen interactions and provide guidance on how future Mtb vaccines can be designed to tip the immune balance in favor of the host.IMPORTANCE Tuberculosis, caused by Mtb, constitutes a global health crisis of massive proportions and the impact of the current coronavirus disease 2019 (COVID-19) pandemic is expected to cause a rise in tuberculosis-related deaths. Improved vaccines are therefore needed more than ever, but a lack of knowledge on protective immunity hampers their development. The present study shows that constitutively expressed antigens with high availability drive highly differentiated CD4 T cells with diminished protective capacity, which could be a survival strategy by Mtb to evade T cell immunity against key antigens. We demonstrate that immunization with such antigens can counteract this phenomenon by maintaining antigen-specific T cells in a state of low differentiation. Future vaccine strategies should therefore explore combinations of multiple highly expressed antigens and we suggest that T cell differentiation could be used as a readily measurable parameter to identify these in both preclinical and clinical studies.

Keywords: ESAT-6; MPT70; Mycobacterium tuberculosis; T cell differentiation; immunization; in vivo expression; vaccination.


Figures

FIG 1
FIG 1
In vivo antigen expression and immune recognition of MPT70 are delayed during M. tuberculosis (Mtb) Erdman infection. CB6F1 mice were infected by the aerosol route with Mtb Erdman. (a) MPT70 and ESAT-6 in vivo gene expression were assessed preinfection (week 0 [wk0]) and 4 and 13 weeks postinfection (p.i.) (n = 4). The expression preinfection was below detection levels (b.d.). Values shown are means ± standard errors of the means (SEM) (error bars). A two-tailed, paired t test was used to assess statistical differences. (b, left) At weeks 3, 12, and 20 after Mtb infection, lungs were harvested for immunological analyses. The frequency of cytokine-producing CD3+ CD4+ T cells specific for MPT70 and ESAT-6 for the same time points as shown in panel c, experiment 1 (medium cytokine production subtracted) analyzed by flow cytometry using the antibodies shown in Table 3 (n = 4). Values shown are means ± SEM. One-way analysis of variance (ANOVA) with Tukey’s multiple-comparison test was used to assess statistical differences. (b, right) Fold change in cytokine-producing CD4 T cells from baseline. (c) Lung cells from infected mice were restimulated in vitro with media, MPT70, or ESAT-6 for 5 days. Culture supernatant was harvested and measured for IFN-γ levels in two individual experiments (n = 4). Values were log transformed and shown as means ± SEM. A two-tailed, paired t test was used to assess statistical differences.
FIG 2
FIG 2
MPT70-specific CD4 T cells maintain a low differentiation state compared to ESAT-6. (a) The functional differentiation score (FDS) of MPT70- and ESAT-6-specific CD4 T cells over the course of Mtb Erdman infection (n = 4). The FDS is defined as the ratio of all IFN-γ-producing CD4 T cell subsets divided by subsets producing other cytokines (IL-2, TNF-α), but not IFN-γ (high FDS = high IFN-γ production). Multiple t tests with correction for multiple testing using the Holm-Sidak method were used to assess statistical differences. Values shown are means ± SEM. Flow cytometry gating is shown as depicted in Fig. S1a in the supplemental material, using the antibodies shown in Table 4. (b) Frequencies of KLRG1-expressing MPT70- and ESAT-6-specific CD4 T cells throughout infection (n = 4). Values shown are means ± SEM. Multiple t tests with correction for multiple testing using the Holm-Sidak method were used to assess statistical differences. (c) Frequency of CD45-labeled MPT70- and ESAT-6-specific CD4 T cells in the lung-associated vasculature (CD45+) 20 weeks postinfection (p.i.) with Mtb (n = 4). A two-tailed, paired t test was used. (d, top) Schematic representation of custom-made I-Ab:MPT7038-52 MHC-II tetramer. (d, bottom) Representative concatenated FACS plots showing frequencies of I-Ab:MPT7038-52 and I-Ab:ESAT-64-17 tetramer (Tet)-positive CD4 T cells or corresponding hClip tetramer-positive CD4 T cells in lungs of mice 12 weeks after Mtb infection (n = 4). (e) Frequency of I-Ab:MPT7038-52 and I-Ab:ESAT-64-17 CD4 T cells 12 to 16 weeks after Mtb infection expressing CXCR3, KLRG1, and T-bet. A parametric, two-tailed, paired t test was used to assess statistical differences (n = 12). Flow cytometry gating is shown as depicted in Fig. S3 using the antibodies shown in Table 3. (f) Concatenated FACS plot of CX3CR1+ KLRG1+ coexpressing ESAT-64-17 CD4 T cells (n = 4).
FIG 3
FIG 3
The impact of MPT70 immunization on alleviating infection-driven T cell differentiation is lower than immunization with ESAT-6. Female CB6F1 mice were immunized with either MPT70 or ESAT-6 recombinant protein three times s.c. and challenged with Mtb Erdman 6 weeks after the third immunization. (a) Frequency of MPT70- and ESAT-6-specific CD4 T cells in the spleen 2 weeks after the third vaccination (n = 4). Ordinary one-way ANOVA with Dunnett’s multiple-comparison test was used to assess statistical differences. (b) Frequency of MPT70- and ESAT-6-specific CD4 T cells in the lung at weeks 3, 12, and 20 after Mtb infection (n = 4). Values shown are means ± SEM. An unpaired t test was used to compare the values for ESAT-6- and MPT70-vaccinated mice. (c) Functional differentiation score (FDS) of MPT70 and ESAT-6-specific CD4 T cells preinfection in the spleen (n = 4). An unpaired t test was used to assess statistical differences. (d) FDS of MPT70- and ESAT-6-specific CD4 T cells 3 and 20 weeks after Mtb infection in the lungs of vaccinated mice and mice injected with saline (n = 4). Values shown are means ± SEM. An unpaired t test was used to compare individual time points. Flow cytometry gating is shown as depicted in Fig. S1a, using the antibodies shown in Table 4. (e) The bacterial burden was determined in the lungs of mice injected with saline or mice vaccinated with MPT70 and ESAT-6 3 to 4 weeks after Mtb infection (n = 26 to 28). The graph shows the results of four individual experiments (experiment 4 has already been published in reference 29). One-way ANOVA with Tukey’s multiple-comparison test was used to assess statistical differences.
FIG 4
FIG 4
Overexpression of MPT70 accelerates T cell differentiation and increases bacterial susceptibility to MPT70 vaccination. (a) In vitro fold gene expression of sigK, rskA, and MPT70 in H37Rv::mpt70high compared to WT H37Rv. All genes were tested in technical duplicates and normalized to esxA expression using primers in Table 1. (b) In vivo fold gene expression of MPT70 and ESAT-6 in the lungs of H37Rv::mpt70high-infected mice compared to WT H37Rv-infected mice 3 weeks after Mtb challenge (n = 4). Genes were analyzed in technical duplicates using primers and probes in Table 2, normalized to 16S rRNA expression, and shown as fold increase from WT H37Rv. A two-tailed, unpaired t test was used to assess statistical differences. (c) Bacterial burden in the lungs of mice injected with PBS at day 1, week 3, week 12, and week 22 after infection with either H37Rv:: mpt70high or WT H37Rv infection (n = 5). Values shown are means ± SEM. Multiple t tests with correction for multiple testing using the Holm-Sidak method were used to assess statistical differences. (d) Frequency of lung MPT70- and ESAT-6-specific CD4 T cells 4 weeks after Mtb infection (n = 10). Box plots with whiskers indicating the minimum and maximum values are shown. The mean values are indicated with + symbols. A unpaired, two-tailed t test was used to assess statistical differences. (e) Frequency of lung MPT70-specific CD4 T cells 3 weeks after Mtb infection in mice injected with PBS (white boxes) and mice vaccinated with MPT70 (blue boxes) (n = 5). A unpaired, two-tailed t test was used to assess statistical differences. (f) Representative concatenated FACS plots (n = 10) showing the expression of CX3CR1, CXCR3, KLRG1, or CD45 on MPT70-specific CD4 T cells 4 weeks after H37Rv:: mpt70high infection (blue) or H37Rv infection (gray). Flow cytometry gating is shown as depicted in Fig. S1a, using antibodies shown in Table 5. (g) Bacterial numbers were determined in the lungs of mice vaccinated with PBS or mice vaccinated with MPT70 and ESAT-6 at day 1, week 3, week 12, and week 22 after WT H37Rv infection (left) or H37Rv::mpt70high infection (right) (n = 4 to 5). One mouse was excluded from the week 12 time point (H37Rv::mpt70high, MPT70 vaccinated), as the mouse was very sick, had high weight loss, and met the study’s predefined humane endpoints (P value = 0.67, if included). Values shown are means ± SEM. Statistical differences were assessed using one-way ANOVA with Tukey’s multiple-comparison test.

Update of

References

    1. World Health Organization. 2020. Global tuberculosis report 2020. World Health Organization, Geneva, Switzerland.
    1. Gautam US, Mehra S, Kaushal D. 2015. In-vivo gene signatures of Mycobacterium tuberculosis in C3HeB/FeJ mice. PLoS One 10:e0135208. doi:10.1371/journal.pone.0135208. - DOI - PMC - PubMed
    1. Karakousis PC, Yoshimatsu T, Lamichhane G, Woolwine SC, Nuermberger EL, Grosset J, Bishai WR. 2004. Dormancy phenotype displayed by extracellular Mycobacterium tuberculosis within artificial granulomas in mice. J Exp Med 200:647–657. doi:10.1084/jem.20040646. - DOI - PMC - PubMed
    1. Sharma D, Bose A, Shakila H, Das TK, Tyagi JS, Ramanathan VD. 2006. Expression of mycobacterial cell division protein, FtsZ, and dormancy proteins, DevR and Acr, within lung granulomas throughout guinea pig infection. FEMS Immunol Med Microbiol 48:329–336. doi:10.1111/j.1574-695X.2006.00160.x. - DOI - PubMed
    1. Schnappinger D, Ehrt S, Voskuil MI, Liu Y, Mangan JA, Monahan IM, Dolganov G, Efron B, Butcher PD, Nathan C, Schoolnik GK. 2003. Transcriptional adaptation of Mycobacterium tuberculosis within macrophages: insights into the phagosomal environment. J Exp Med 198:693–704. doi:10.1084/jem.20030846. - DOI - PMC - PubMed

Publication types

MeSH terms

Substances

LinkOut - more resources