. 2021 Apr;9(4):e002460.
doi: 10.1136/jitc-2021-002460.

IL-6 signaling in macrophages is required for immunotherapy-driven regression of tumors

Affiliations

IL-6 signaling in macrophages is required for immunotherapy-driven regression of tumors

Elham Beyranvand Nejad et al. J Immunother Cancer. 2021 Apr.

Abstract

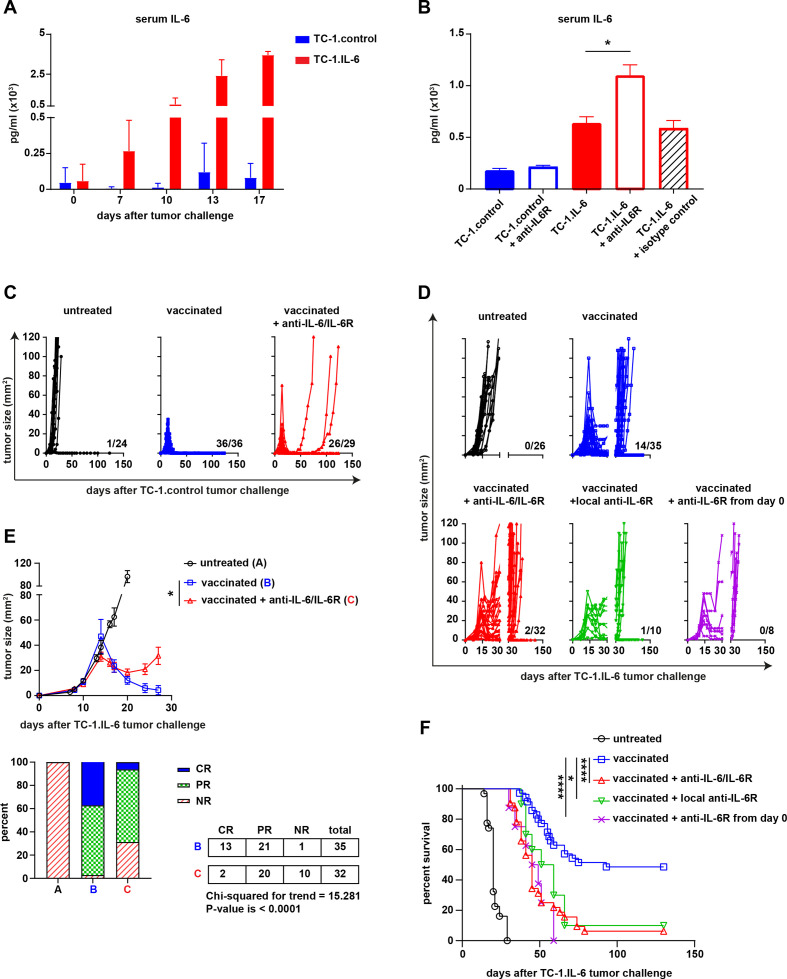
Background: High serum interleukin (IL-6) levels may cause resistance to immunotherapy by modulation of myeloid cells in the tumor microenvironment. IL-6 signaling blockade is tested in cancer, but as this inflammatory cytokine has pleiotropic effects, this treatment is not always effective.

Methods: IL-6 and IL-6R blockade was applied in an IL-6-mediated immunotherapy-resistant TC-1 tumor model (TC-1.IL-6) and immunotherapy-sensitive TC-1.

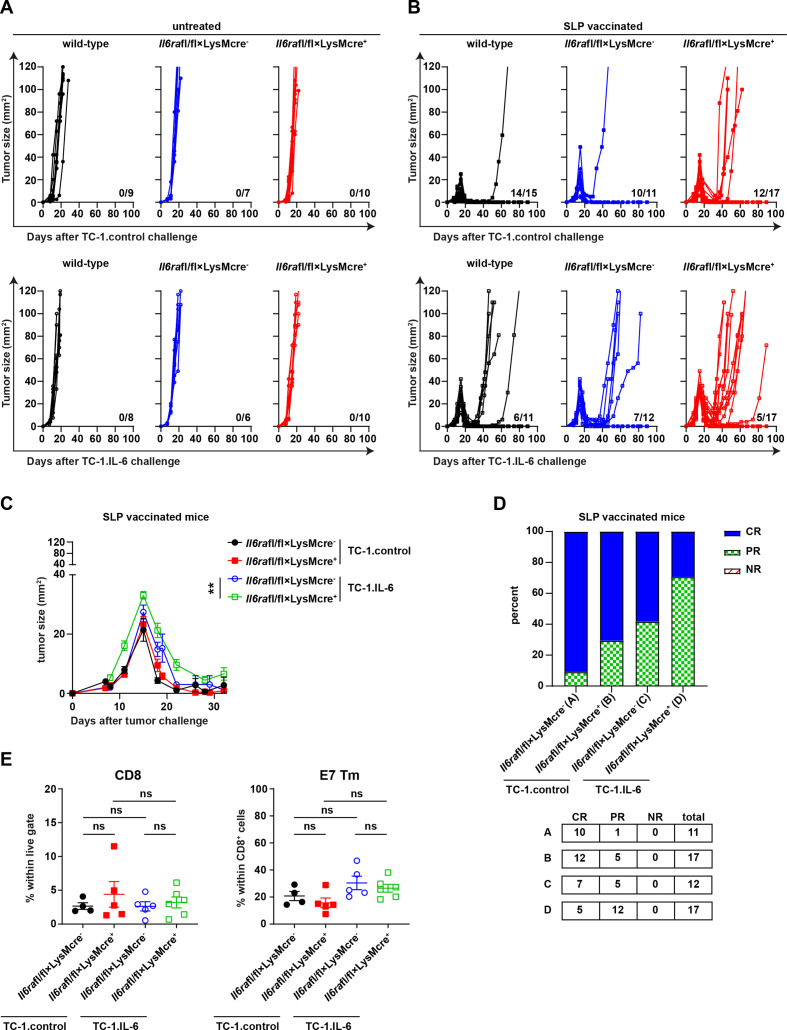
Control: Effects on therapeutic vaccination-induced tumor regression, recurrence and survival as well on T cells and myeloid cells in the tumor microenvironment were studied. The effects of IL-6 signaling in macrophages under therapy conditions were studied in Il6rafl/fl×LysMcre+ mice.

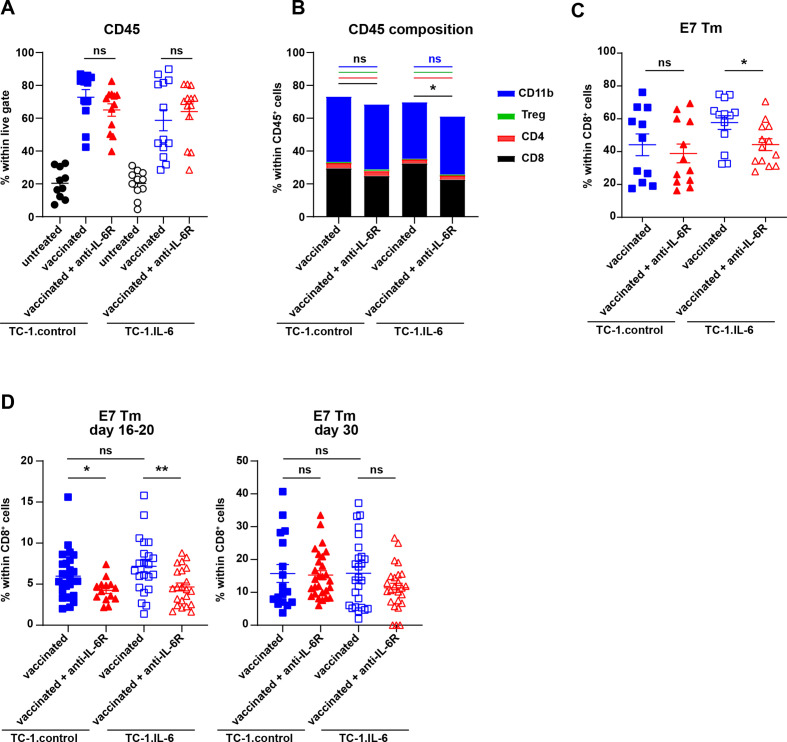
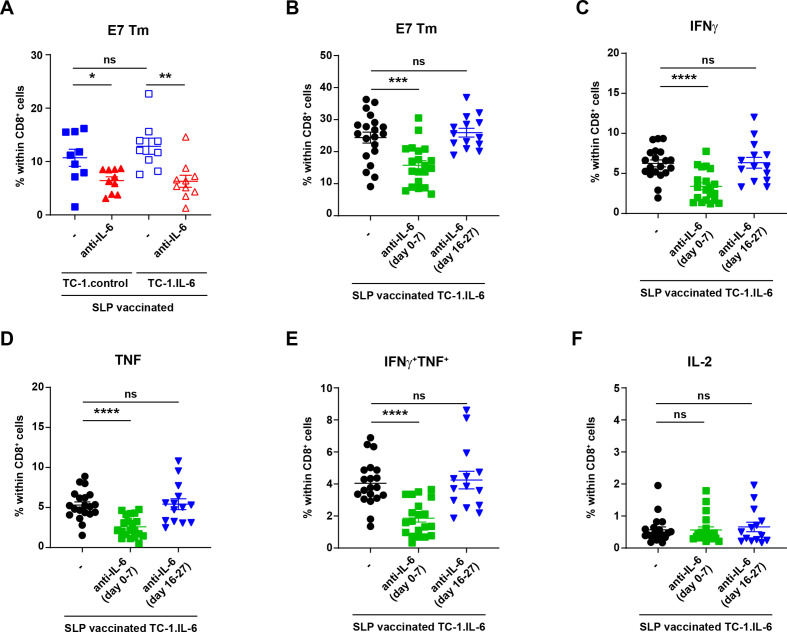
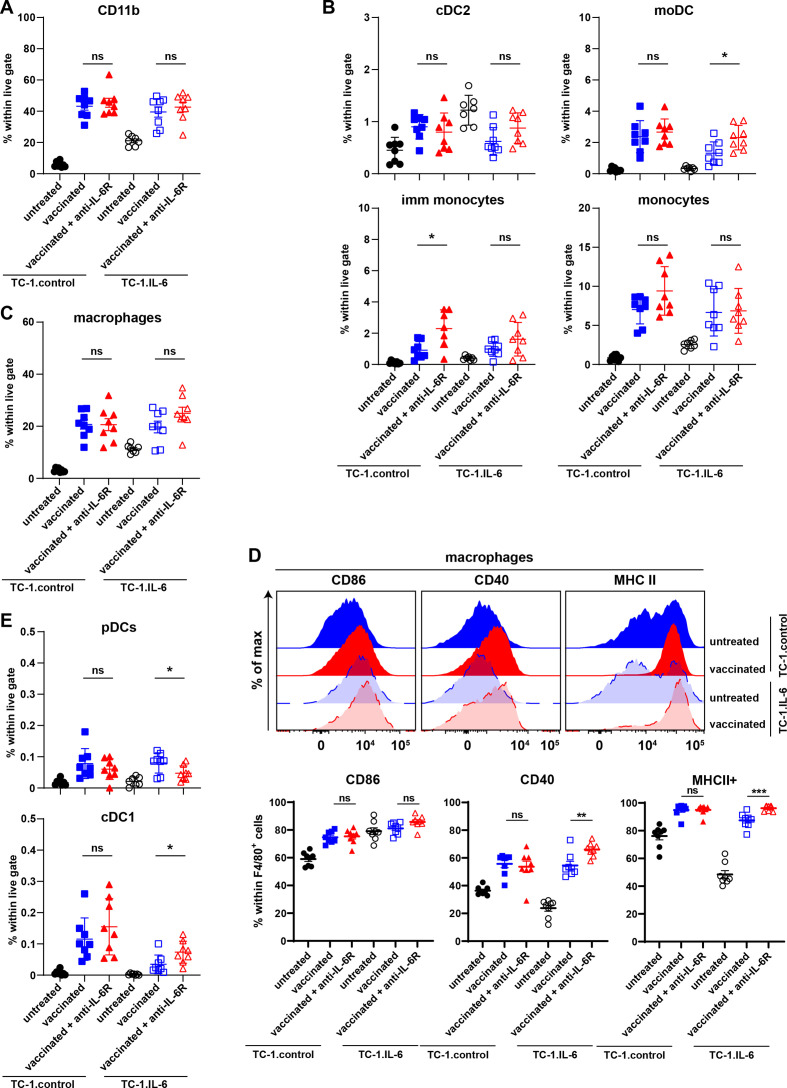
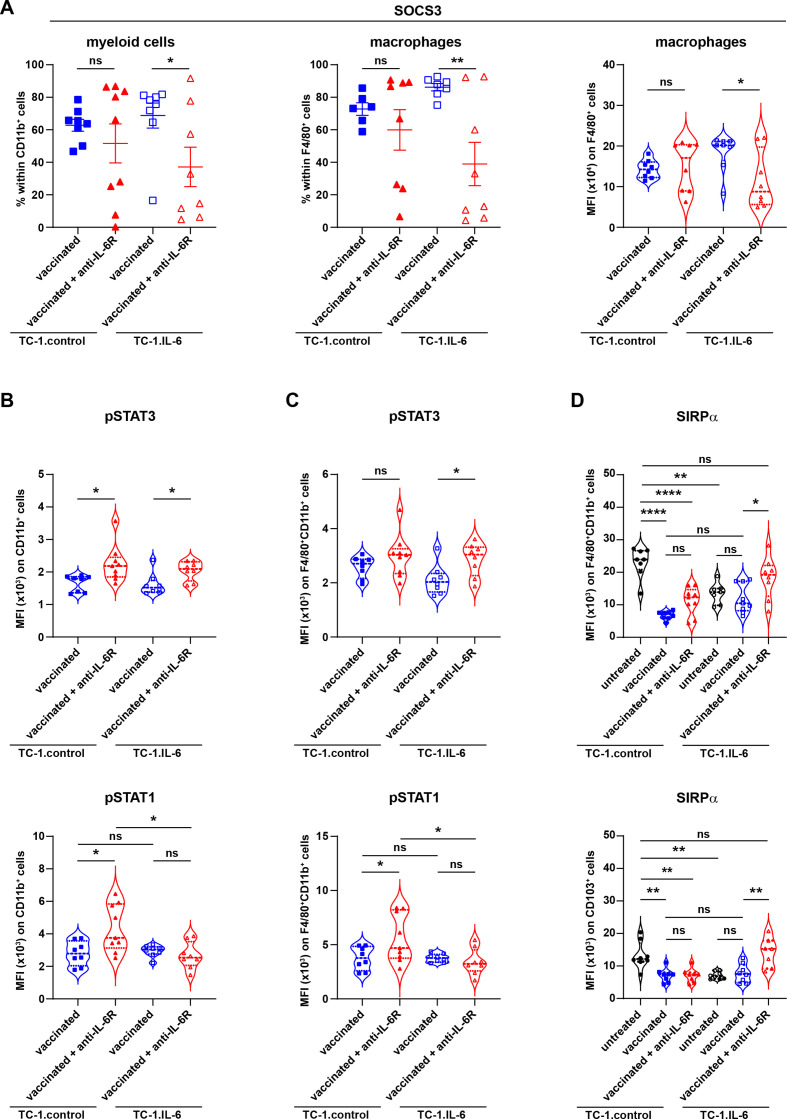
Results: Our therapeutic vaccination protocol elicits a strong tumor-specific CD8+ T-cell response, leading to enhanced intratumoral T-cell infiltration and recruitment of tumoricidal macrophages. Blockade of IL-6 signaling exacerbated tumor outgrowth, reflected by fewer complete regressions and more recurrences after therapeutic vaccination, especially in TC-1.IL-6 tumor-bearing mice. Early IL-6 signaling blockade partly inhibited the development of the vaccine-induced CD8+ T-cell response. However, the main mechanism was the malfunction of macrophages during therapy-induced tumor regression. Therapy efficacy was impaired in Il6rafl/fl×LysMcre+ but not cre-negative control mice, while no differences in the vaccine-induced CD8+ T-cell response were found between these mice. IL-6 signaling blockade resulted in decreased expression of suppressor of cytokine signaling 3, essential for effective M1-type function in macrophages, and increased expression of the phagocytic checkpoint molecule signal-regulatory protein alpha by macrophages.

Conclusion: IL-6 signaling is critical for macrophage function under circumstances of immunotherapy-induced tumor tissue destruction, in line with the acute inflammatory functions of IL-6 signaling described in infections.

Keywords: CD8-Positive T-Lymphocytes; active; adaptive immunity; immune evation; immunotherapy; macrophages.


Conflict of interest statement

Competing interests: None declared.

Figures

Figure 1
Figure 1
IL-6 blockade impairs the therapeutic efficacy of a therapeutic cancer vaccine. (A) The serum level of IL-6 (pg/mL) in TC-1.contol and TC-1 IL-6 tumor-bearing mice at different time points after tumor challenge. (B) The serum level of IL-6 (pg/mL) in TC-1.contol and TC-1 IL-6 tumor-bearig mice with and without IL-6R blockade or isotype control at day 16 post-tumor challenge. Tumor outgrowth graphs of the untreated or SLP vaccinated TC-1.control (C) and TC-1.IL-6 (D) tumor-bearing mice treated with or without IL-6 or IL-6R antibodies as described in the material and methods. The number shown above the x-axis is the number of alive mice from the total. (E) The average tumor outgrowth (upper panel) and the mean response rate (%) according to RECIST criteria (upper panel) of the major groups shown in (D). Lower panel: NR, no response; PR, partial response; CR, complete response. Graphs indicate mean values with SEM (F) survival graph of the mice shown in (D). Data in (A, B) is representative of three independent experiments, yielding similar results. Data shown in C–F are pooled from four independent experiments with similar results. Significance was determined by Mann-Whitney U test in B and student unpaired t-test for difference in endpoint tumor size in the vaccinated groups and χ2 for trend for response rate in (E). Significance was determined by a log-rank (Mantel–Cox) test in (F). *P<0.05; **p<0.01; ***p<0.001. IL-6, interleukin 6; SLP, synthetic long peptide.
Figure 2
Figure 2
IL-6 axis blockade partially impairs the tumor-specific T cell response. The percentage of intratumoral CD45+ leukocytes within live cells (A), the mean percentage of CD8+, CD4+ (without Tregs), Tregs and CD11b+ cells within CD45+ cells (B) and the percentage of E7 HPV Tm+ cells within CD45+ cells (C) in untreated and SLP vaccinated TC-1.control and TC-1.IL-6 tumor-bearing mice. (D) The percentage of E7 HPV Tm+ cells within CD8+ T cells in blood on day 16–20 and 30 post-tumor challenge in SLP vaccinated TC-1.control and TC-1.IL-6 tumor-bearing mice with and without IL-6R blockade. Each dot represents data from an individual mouse. Graphs indicate mean values with SEM data are pooled from two independent experiments with similar results. Significance between the vaccinated groups in each tumor model was determined by unpaired Student’s t-test. *P<0.05; **p<0.01. IL-6, interleukin 6; ns, not significant; SLP, synthetic long peptide.
Figure 3
Figure 3
Early IL-6 blockade hampers the vaccine-induced T cell response in mice with IL-6 producing tumors. (A) The percentage of E7 HPV Tm+ cells within CD8+ cells in blood 29 days post-tumor challenge in SLP vaccinated TC-1.control and TC-1.IL-6 tumor-bearing mice with or without IL-6 blockade (day 8–29). (B–F) Mice were injected with TC-1.IL-6 tumor. Mice received anti-IL-6 from day 0 till 7 (day 0–7) or from day 16 to 27 (day 16–27) or none at all (-). All mice received the SLP prime and boost vaccine on day 8 and 22 post-tumor challenge, respectively. The percentage of E7 HPV Tm+ cells (B), IFNγ+ (C), TNF+ (D), IFNγ+ TNF+ (E) or IL-2 (F) producing CD8+ cells in blood at day 29 post-tumor challenge. Data are pooled from three independent experiments, yielding similar results. Graphs indicate mean values with SEM each dot represents data from an individual mouse. Significance between the two different groups in each tumor model (A) or between non-blocked versus blockade at one specific point (B–F) was determined by unpaired Student’s t-test. *P<0.05; **p<0.01; ***p<0.001; ****p<0.0001. IFNγ, interferon γ; IL-6, interleukin 6; ns, not significant; SLP, synthetic long peptide.
Figure 4
Figure 4
IL-6 signaling in intratumoral macrophages is required for full vaccine-induced tumor regression. Tumor outgrowth graphs also indicating the number of alive mice from the total tested above the x-axis (A, B), the average tumor outgrowth (C; mean values with SEM), and the response rate according to RECIST criteria (D; NR, no response; PR, partial response; CR, complete response) of Il6rafl/fl×LysMcre+, Il6rafl/fl×LysMcre- and wild-type mice treated with SLP vaccine or kept untreated. Data are pooled from three independent experiments. (E) The percentage of intratumoral CD8+ cells within live gate (left) and the percentage of E7 Tm+ cells within CD8+ cells of Il6rafl/fl×LysMcre+, Il6rafl/fl×LysMcre- SLP vaccinated mice. Graphs indicate mean values with SEM each dot represents data from an individual mouse. Data are representative of one experiment. Significance was determined by unpaired Student’s t-test for difference in endpoint tumor size (day 22) in (C) and Mann-Whitney U test in (E), within each tumor model. *P<0.05; **p<0.01. IL-6, interleukin 6; SLP, synthetic long peptide.
Figure 5
Figure 5
The composition of intratumoral myeloid cells is grossly unchanged with IL-6 axis blockade. The percentage of intratumoral CD11b+ myeloid cells (A), cDC2, moDCs, immature monocytes and monocytes (B), macrophages (C) and pDCs and cDC1 (E) in SLP vaccinated or untreated TC-1control and TC-1.IL-6 tumor-bearing mice with and without IL-6 blockade. Graphs indicate mean values with SEM each dot represents data from an individual mouse. Data are representative of one experiment. (D) The expression of CD86, CD40 and MHC class II on macrophages. Significance in differences in the percentage of the indicated vaccine-associated cell infiltration due to IL-6R blockade were determined by Student’s t-test within each tumor model (A–E). *P<0.05; **p<0.01; ***p<0.001. IL-6, interleukin 6; mo DCs, monocyte-derived dendritic cells; ns, not significant; pDC, plasmacytoid DCs.
Figure 6
Figure 6
IL-6 blockade decreases the levels of SOCS3 and increases SIRPα levels. (A) The percentage of intratumoral SOCS3+CD11b+ (myeloid cells) and SOCS3+F4/80+ (macrophages) cells and mean fluorescent intensity (MFI) of SOCS3 on macrophages. (B) MFI of pSTAT3 and pSTAT1 on total CD11b+ myeloid cells and F4/80+CD11b+ macrophages. (C) MFI of SIRPα on F4/80+CD11b+ macrophages and CD11b-CD103+ (cDC1) cells. Scatter plots indicate mean values with SEM each dot represents data from an individual mouse. Violin plots show the full distribution of the data, each dot representing an individual mouse. Data are representative of one experiment. Significance (A–C) in differences in the indicated vaccine-associated percentage of indicated cell infiltration or mean fluorescence intensity of indicated markers on cells due to IL-6R blockade was determined by Student’s t-test within each tumor model. Significance between groups in D is determined by one-way ANOVA. *P<0.05; **p<0.01; ****p<0.0001. ANOVA, analysis of variance; SIRPα, signal-regulatory protein alpha; SOCS3, suppressor of cytokine signaling 3.

Similar articles

Cited by

References

    1. Bharti R, Dey G, Mandal M. Cancer development, chemoresistance, epithelial to mesenchymal transition and stem cells: a snapshot of IL-6 mediated involvement. Cancer Lett 2016;375:51–61. 10.1016/j.canlet.2016.02.048 - DOI - PubMed
    1. Lippitz BE. Cytokine patterns in patients with cancer: a systematic review. Lancet Oncol 2013;14:e218–28. 10.1016/S1470-2045(12)70582-X - DOI - PubMed
    1. Jones SA, Jenkins BJ. Recent insights into targeting the IL-6 cytokine family in inflammatory diseases and cancer. Nat Rev Immunol 2018;18:773–89. 10.1038/s41577-018-0066-7 - DOI - PubMed
    1. Waage A, Brandtzaeg P, Halstensen A, et al. . The complex pattern of cytokines in serum from patients with meningococcal septic shock. association between interleukin 6, interleukin 1, and fatal outcome. J Exp Med 1989;169:333–8. 10.1084/jem.169.1.333 - DOI - PMC - PubMed
    1. Cohen S, Bruchim I, Graiver D, et al. . Platinum-resistance in ovarian cancer cells is mediated by IL-6 secretion via the increased expression of its target cIAP-2. J Mol Med 2013;91:357–68. 10.1007/s00109-012-0946-4 - DOI - PubMed

Publication types

MeSH terms