. 2021 Apr 27;118(17):e2011023118.
doi: 10.1073/pnas.2011023118.

β-arrestin-dependent PI(4,5)P2 synthesis boosts GPCR endocytosis

Affiliations

β-arrestin-dependent PI(4,5)P2 synthesis boosts GPCR endocytosis

Seung-Ryoung Jung et al. Proc Natl Acad Sci U S A. .

Abstract

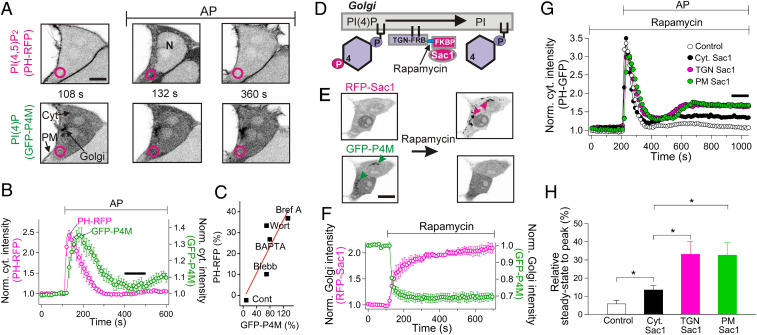
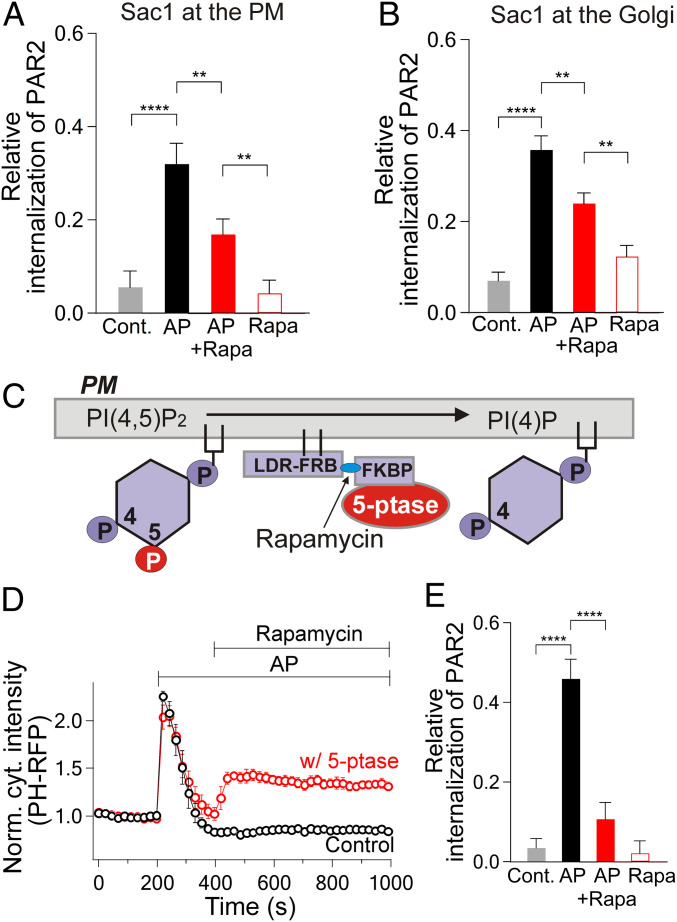
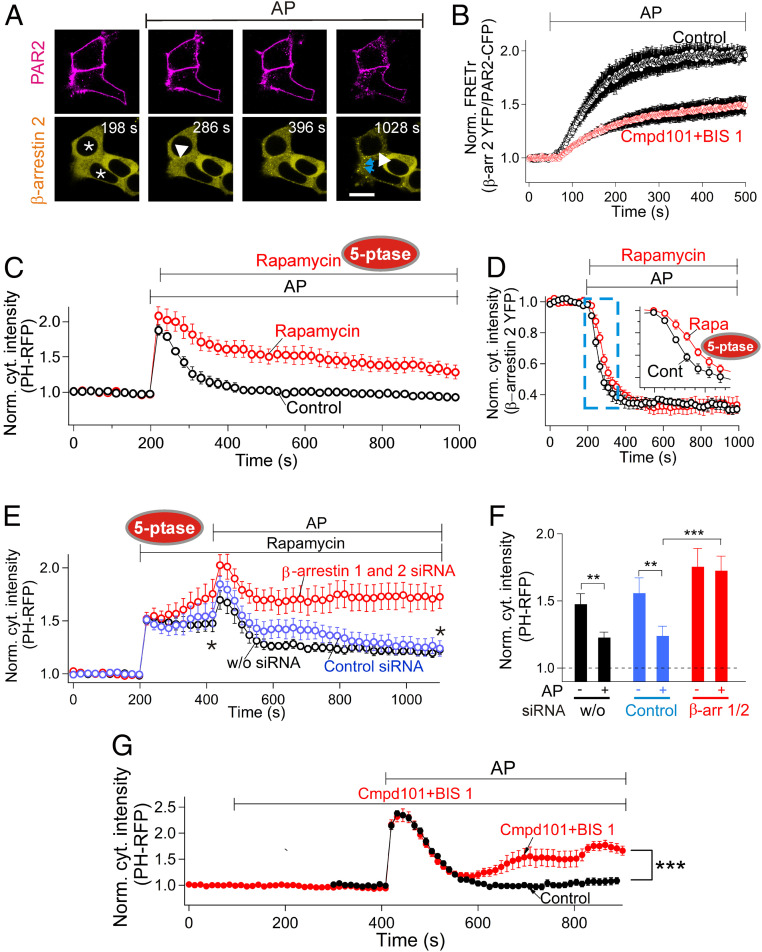
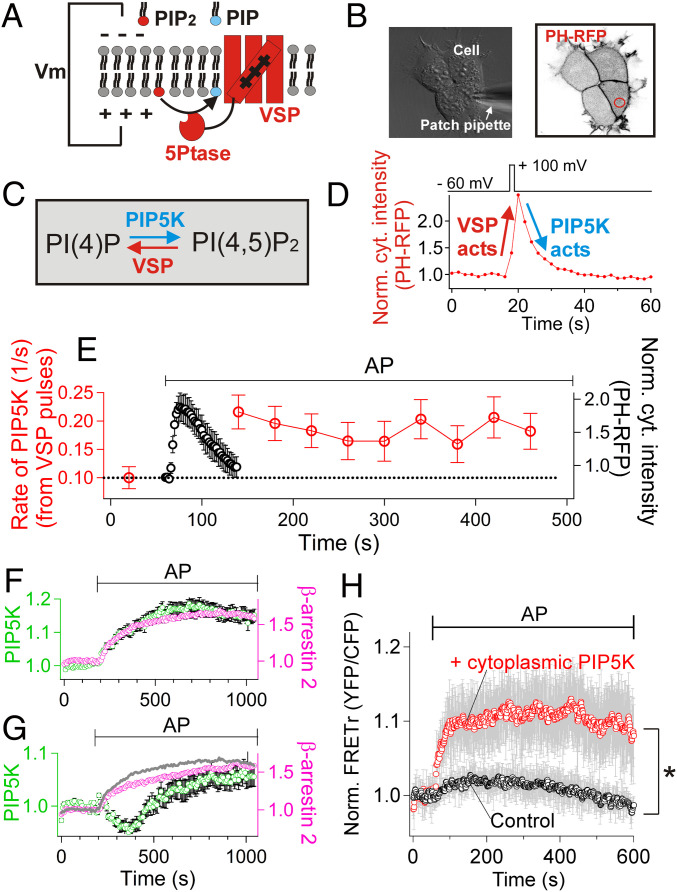
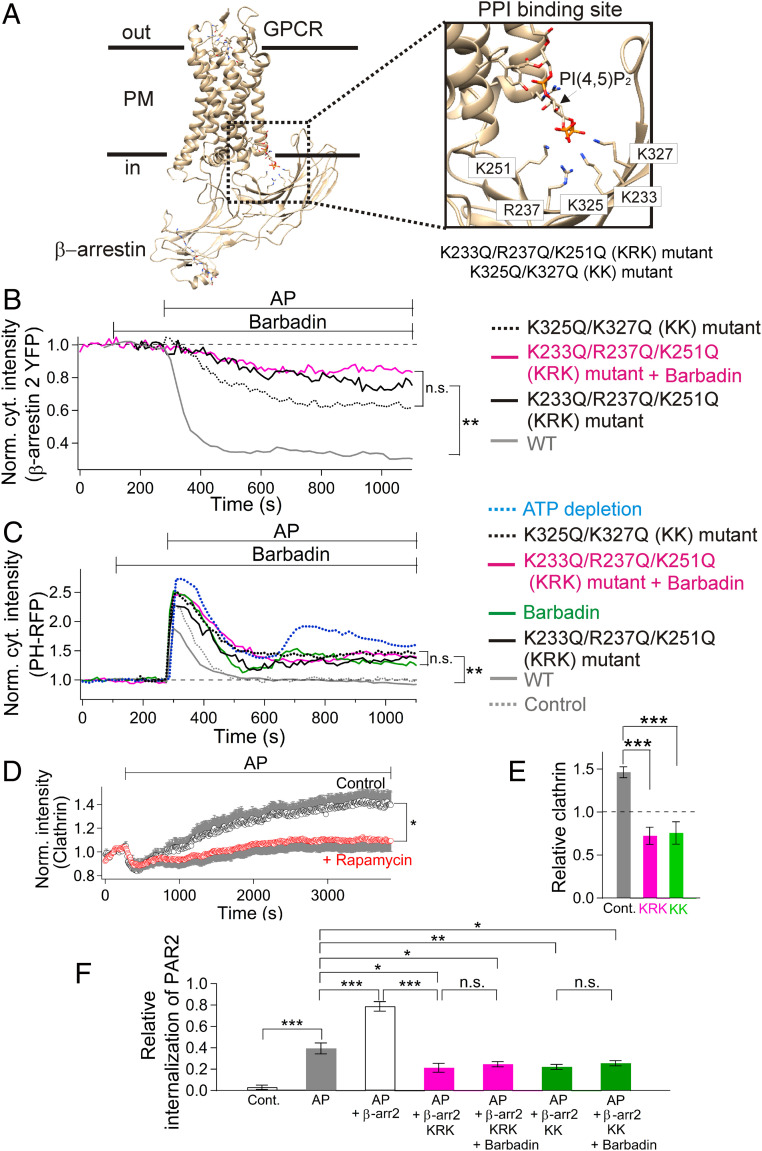
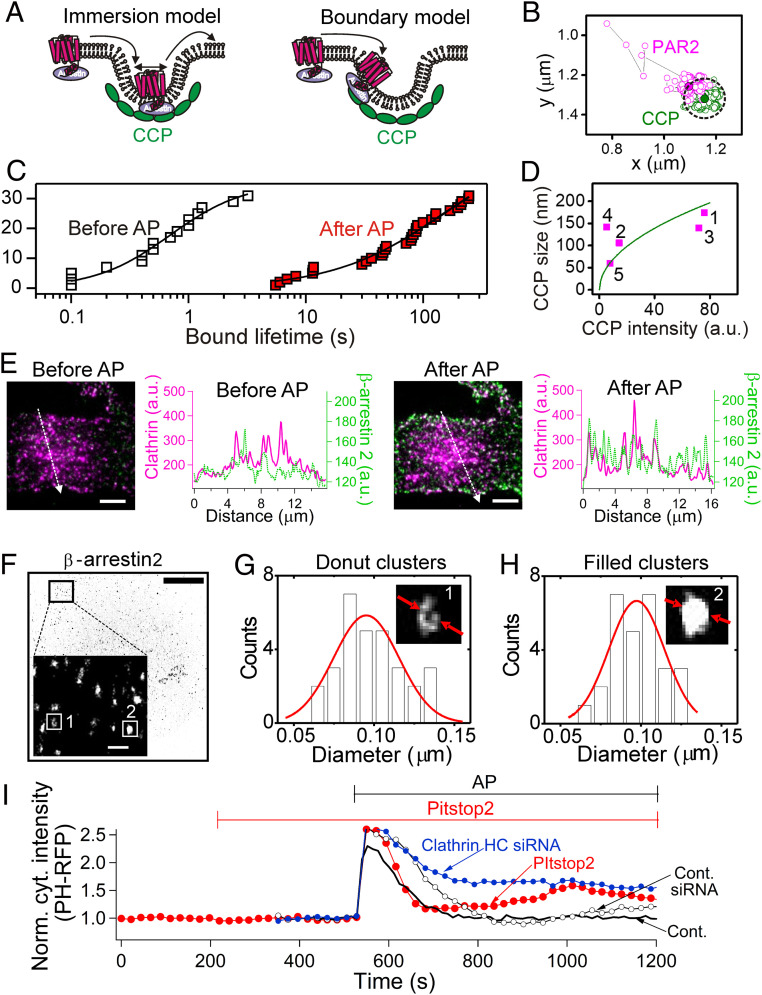
β-arrestins regulate many cellular functions including intracellular signaling and desensitization of G protein-coupled receptors (GPCRs). Previous studies show that β-arrestin signaling and receptor endocytosis are modulated by the plasma membrane phosphoinositide lipid phosphatidylinositol-(4, 5)-bisphosphate (PI(4,5)P2). We found that β-arrestin also helped promote synthesis of PI(4,5)P2 and up-regulated GPCR endocytosis. We studied these questions with the Gq-coupled protease-activated receptor 2 (PAR2), which activates phospholipase C, desensitizes quickly, and undergoes extensive endocytosis. Phosphoinositides were monitored and controlled in live cells using lipid-specific fluorescent probes and genetic tools. Applying PAR2 agonist initiated depletion of PI(4,5)P2, which then recovered during rapid receptor desensitization, giving way to endocytosis. This endocytosis could be reduced by various manipulations that depleted phosphoinositides again right after phosphoinositide recovery: PI(4)P, a precusor of PI(4,5)P2, could be depleted at either the Golgi or the plasma membrane (PM) using a recruitable lipid 4-phosphatase enzyme and PI(4,5)P2 could be depleted at the PM using a recruitable 5-phosphatase. Endocytosis required the phosphoinositides. Knock-down of β-arrestin revealed that endogenous β-arrestin normally doubles the rate of PIP5-kinase (PIP5K) after PAR2 desensitization, boosting PI(4,5)P2-dependent formation of clathrin-coated pits (CCPs) at the PM. Desensitized PAR2 receptors were swiftly immobilized when they encountered CCPs, showing a dwell time of ∼90 s, 100 times longer than for unactivated receptors. PAR2/β-arrestin complexes eventually accumulated around the edges or across the surface of CCPs promoting transient binding of PIP5K-Iγ. Taken together, β-arrestins can coordinate potentiation of PIP5K activity at CCPs to induce local PI(4,5)P2 generation that promotes recruitment of PI(4,5)P2-dependent endocytic machinery.

Keywords: GPCR; PIP5K; endocytosis; phosphoinositide lipids; β.


Conflict of interest statement

The authors declare no competing interest.

Figures

Fig. 1.
Fig. 1.
PI(4)P and PI(4,5)P2 pools are coupled. (A) Confocal images showing dynamic redistribution of the GFP-P4M probe reporting PI(4)P and the PH-RFP probe reporting PI(4,5)P2, upon application of 100 µM AP to activate PAR2. The images have inverted contrast with fluorescence shown dark. Magenta circles indicate regions of interest chosen for measurements of cytoplasmic intensities with each probe. The labels denote the PM, Golgi, cytoplasm (Cyt), and nucleus (N). (Scale bar, 5 µm.) (B) Time courses of cytoplasmic intensities of PI(4)P and PI(4,5)P2 probes during AP application. The intensities were normalized to reduce cell-to-cell variation and then averaged (Norm. cyt. intensity). PI(4,5)P2 (magenta) and PI(4)P (green) (n = 8 cells). The recovery time constants were 58 ± 9 s (PH-RFP) and 89 ± 18 s (GFP-P4M). P = 0.12 (Student’s paired t test). (C) Correlation of PI(4,5)P2 and PI(4)P changes induced by different pharmacological perturbations. Signal amplitude (%) for each condition is calculated from the steady-state level (at 300 to 400 s after application of AP as indicated with a heavy bar in B) minus the initial baseline. Pearson’s correlation coefficient for the linear fit (red line) was 0.85. Cells were pretreated with different drugs for 5 or 10 min before AP (SI Appendix, Fig. S2): Wortmannin (30 µM, n = 6 cells, Wort) and BAPTA-AM (50 µM, n = 6 cells, BAPTA), blebbistatin (30 µM, n = 11 cells, Blebb) and brefeldin A (10 µg/mL, n = 4 cells, Bref A). (D) A schematic of dephosphorylation of PI(4)P at the trans-Golgi using recruitable human Sac1 (Sac1) and rapamycin. (E) Inverted confocal images. Rapamycin (5 µM) induces translocation of RFP-Sac1-FKBP to the TGN38-FRB-CFP anchor at the trans-Golgi membrane (upper images, magenta arrow heads), and the Golgi-localized GFP-P4M probe (lower images, green arrow heads) is released to the cytoplasm. (Scale bar, 10 µm.) (F) Time courses of Golgi Sac1 (magenta) and the GFP-P4M probe (green) following rapamycin application. Intensities are normalized to the control values before rapamycin and averaged (n = 5 cells). (G) Time course of cytoplasmic PH-GFP showing the effect of PI(4)P depletion at the Golgi and the PM on the recovery of PM PI(4,5P)2 following PAR2 desensitization. Cells were pretreated with rapamycin for 10 min before the application of 100 µM AP. The figure shows only 3 min rapamycin treatment prior to the AP treatment. Plotted are control cells (Control), cells expressing cytoplasmic Sac1 alone without TGN38-FRB-CFP or LDR-CFP (Cyt. Sac1), and cells where Sac1 is recruited to either the trans-Golgi (TGN Sac1) or the PM (PM Sac1). (H) Analysis of cytoplasmic PH-GFP responses, summarizing the secondary depletion of PI(4,5)P2 without or with Sac1 recruitment to the Golgi or the PM. Mean values obtained from the time window between 950 and 1,050 s (black bar in G) were compared to the peak to get the relative steady state. The values in G and H are averages. Control (n = 8 cells), Sac1 alone (n = 9 cells), TGN Sac1 (n = 7 cells), and PM Sac1 (n = 6 cells). *P < 0.05.
Fig. 2.
Fig. 2.
PI(4)P and PI(4,5)P2 support the internalization of PAR2. (A and B) Relative internalization of PAR2 estimated from the ratio of cytoplasmic PAR2 to the total PAR2 (SI Appendix, Methods and Materials and Fig. S4). Cells were untreated (Cont.) or incubated with 100 µM AP for 1 h (AP). For the rapamycin group, cells were treated with 5 µM rapamycin (Rapa) or with AP and rapamycin (AP+Rapa), which would recruit Sac1 4-phosphatase to the PM (A) or to the trans-Golgi (B). Each condition is an average of 7 to 17 cells from two independent experiments. (C) A schematic diagram of 5-phosphatase tagged with FKBP (5-ptase-FKBP) being recruited to PM-linked LDR-FRB-CFP (LDR-FRB). (D) Normalized time course of cytoplasmic intensity of PH-RFP probe during application of AP. Rapamycin (5 µM) was added after full recovery of the PH-RFP probe (w/5-ptase, n = 7 cells). The black symbols indicate the control experiment without 5-phosphatase overexpression (control, n = 5 cells). (E) Average of PAR2 internalization in the absence or presence of 5-phosphatase from 9 to 16 cells for each condition. **P < 0.01; ****P < 0.001.
Fig. 3.
Fig. 3.
β-arrestin boosts PI(4,5)P2 synthesis at the PM. (A) Confocal images of translocation of β-arrestin-2-YFP to the PM during activation of PAR2. Cells were transiently transfected with dark-PAR2 labeled with an Alexa 647–conjugated primary antibody (magenta) and β-arrestin-2-YFP (yellow). The asterisks mark the nuclei of two cells expressing both the receptor and β-arrestin 2. (Scale bar, 10 µm.) The white arrowheads indicate PM-localized β-arrestin-2-YFP after AP treatment. The blue arrows indicate β-arrestin-2-YFP localized internalized receptors. (B) FRET between PAR2-CFP and β-arrestin-2-YFP showing direct interaction of β-arrestin 2 with activated PAR2 (n = 6 cells for control and n = 7 cells for cmpd101 + BIS1). (C) Time courses of cytoplasmic intensity of PH-RFP comparing control (n = 8 cells) and rapamycin-treated cells (n = 6 cells) where rapamycin recruited a 5-phosphatase to the PM to deplete PI(4,5)P2. (D) Loss of cytoplasmic β-arrestin-2-YFP triggered by 100 µM AP with (n = 6 cells) or without (n = 8 cells) rapamycin. Rapamycin was applied right after AP to deplete PM PI(4,5)P2 irreversibly. A decrease of β-arrestin-2-YFP in the cytoplasm indicates translocation of β-arrestin 2 to PAR2 at the PM. The blue-dashed area was enlarged as an inset. (E) Effect of β-arrestin 1 and 2 siRNA on recovery of PM PI(4,5)P2 compared to with control siRNA or without siRNA. After partial depletion of PM PI(4,5)P2 by rapamycin-recruited 5-phosphatase, PAR2 agonist (AP, 100 µM) was applied in the continued presence of rapamycin. Without siRNA (n = 6 cells), control siRNA (n = 9 cells), and β-arrestin 1 and 2 siRNA (n = 8 cells). (F) Mean cytoplasmic PH-RFP from the experiments in E measured at points marked by the two asterisks from before and after AP. (G) Effect of PKC and GRK2/3 blockers on PI(4,5)P2 recovery (n = 6 cells for control and n = 10 cells for cmpd101 + BIS1). **P < 0.01; ***P < 0.005.
Fig. 4.
Fig. 4.
PAR2 activates PIP5K. (A) Cartoon of voltage-sensitive 5-phosphatase (VSP) used to deplete PM PI(4,5)P2. (B) Differential interference contrast (DIC) and confocal imaging combined with patch clamp. PAR2-CFP, GFP-VSP and PH-RFP were expressed at the same time. (C) Reaction scheme for PM PI(4,5)P2 depletion by VSP and resynthesis by PIP5K. (D) Time course of cytoplasmic PH-RFP during and after one brief activation of VSP by a voltage jump. A representative trace. (E) Red symbols: Catalytic rate constant of PIP5K determined from the exponential recovery of PI(4,5)P2 after repeated VSP pulses applied before and during treatment with AP (100 μM). Mean of five independent experiments. Black symbols: mean time course of PH-RFP probe translocation during the activation of PAR2 by AP. (F and G) Average intensity of clustered β-arrestin-2-mRFP and of GFP-PIP5K-Iγ recorded in conventional TIRF microscopy while AP was applied to PAR2-expressing cells. In the analysis, regions of interest (ROIs) containing individual β-arrestin-2-mRFP clusters (magenta) were selected to measure intensity changes of GFP-PIP5K-Iγ (green), reflecting recruitment of the kinase into β-arrestin 2 clusters. (F) One subset of data with monotonic PIP5K-Iγ recruitment into β-arrestin 2 clusters (group 1, 14 ROIs). (G) The second, remaining subset of data with biphasic PIP5K-Iγ signals at β-arrestin 2 clusters (group 2, 13 ROIs). The gray line was copied from the β-arrestin 2 clustering in F for comparison. The gray line and magenta symbols are significantly different (P < 0.001). (H) FRET between CFP-tagged cytoplasmic PIP5K-Iγ and YFP-tagged β-arrestin 2 (“+ cytoplasmic PIP5K,” n = 9 cells). For the control experiments (“Control,” n = 8 cells), cells were transfected with CFP instead of CFP-PIP5K-Iγ together with β-arrestin-2-YFP and dark PAR2. AP (100 µM) was used to activate PAR2 receptors. *P < 0.05.
Fig. 5.
Fig. 5.
The phosphoinositide binding site in β-arrestin controls PI(4,5)P2 regeneration, CCPs, and PAR2 endocytosis. (A) Structure of neurotensin receptor 1 bound to β-arrestin 1 and PI(4,5)P2 (PDB number: 6UP7, ref. 3). (Inset) Expanded image of the PPI binding site of β-arrestin 1. The K231, R235, K249, K323, and K325 residues of the β-arrestin 1 structure correspond to K233, R237, K251, K325, and K327 in β-arrestin 2. Phosphate oxygens of the PI(4,5)P2 interact electrostatically with the positively charged polybasic residues in the PPI binding site. (B) Time course of β-arrestin-2-YFP translocation from the cytoplasm during AP. Translocation of WT β-arrestin-2-YFP and two mutant β-arrestins KRK or KK and occlusion of the barbadin effect. For the magenta trace, 50 µM barbadin was added 3 min before addition of 100 µM AP to the KRK mutant β-arrestin-2-YFP overexpressing cells (KRK mutant + barbadin, average cytoplasmic intensity between 800 and 1,000 s normalized to baseline: 0.83 ± 0.04, n = 7 cells). Also shown are traces with KRK (0.75 ± 0.08, n = 5 cells) and KK mutants alone (0.57 ± 0.02, n = 6 cells). The WT trace was from Fig. 3D (0.33 ± 0.02, n = 8 cells). (C) Reduction of late PI(4,5)P2 recovery by overexpression of KRK or KK mutant β-arrestin 2. KRK mutant alone (average normalized cytoplasmic intensity between 800 and 1,000 s: 1.37 ± 0.11, n = 6 cells), KK mutant alone (1.47 ± 0.11, n = 7 cells), barbadin alone (1.38 ± 0.08, n = 6 cells), and KRK mutant + barbadin (1.39 ± 0.06, n = 7 cells). The PI(4,5)P2 response after ATP reduction was added for comparison (1.87 ± 0.19, n = 7 cells). To reduce intracellular ATP in live cells, oxygen scavengers were added into the imaging chamber without additional metabolites (43). The WT trace was from Fig. 3C (0.92 ± 0.03, n = 8 cells). Control (no overexpression of β-arrestin-2-YFP, 1.01 ± 0.09, n = 4 cells). **P < 0.01. n.s.: not significant. For the traces in B and C, error bars are omitted for better visibility. (D) Time course of formation of CCPs during AP and acute PM PI(4,5)P2 depletion measured with TIRF. Total intensity of clathrin-DsRed from individual cells was measured. The intensity was normalized with before AP treatment and then averaged. Rapamycin was applied to recruit a 5-phosphatase soon after 100 µM AP (n = 8 cells, rapamycin), reducing the recovery of CCP formation as compared to the control (n = 7 cells). The error bars (in gray) are drawn on only one side of the data (circles) for clarity. (E) Statistics of relative clathrin-DsRed intensity at the PM (TIRF) after AP treatment for 60 min compared to the value before AP (dotted line). Control (no overexpression of β-arrestin-2-YFP, n = 7 cells), KRK mutant (n = 9 cells), or KK mutant (n = 7 cells) β-arrestin-2-YFP. ***P < 0.001. (F) Statistics of PAR2 endocytosis. Control (no drug treatment, n = 17 cells), AP (n = 12 cells), AP + WT β-arrestin-2-YFP (“β-arr 2,” n = 8 cells), AP + KRK mutant β-arrestin-2-YFP (“β-arr 2 KRK,” n = 8 cells), AP + KRK mutant β-arrestin-2-YFP + barbadin (“β-arr 2 KRK + Barbadin,” n = 15 cells), AP + KK mutant β-arrestin-2-YFP (“β-arr 2 KK,” n = 28 cells), and AP + KK mutant β-arrestin-2-YFP + barbadin (“β-arr 2 KK + Barbadin,” n = 30 cells). *P < 0.05; **P < 0.01; ***P < 0.005.
Fig. 6.
Fig. 6.
Stable binding of PAR2/β-arrestin with CCP. (A) Two models for PAR2 interactions with CCPs: the immersion model and the boundary model. (BD) Cells transiently transfected with PAR2 dark (∼0.1 μg complementary DNA (cDNA)) and SNAP tagged clathrin light chain (∼0.1 μg cDNA) studied by single-molecule live-cell imaging with TIRF microscopy (SI Appendix, Methods and Materials). (B) Representative single-molecule diffusion trajectory showing immobilization of one PAR2 molecule at a preexisting CCP. The dotted line indicates the effective boundary of CCP. (C) Cumulative distribution of bound lifetimes before (Mean: 0.9 ± 0.2 s, n = 16 events, open black symbol) and after AP treatment (87 ± 13 s, n = 31 events, red filled symbol). Data collected from three independent experiments. The bound lifetimes in each condition were plotted from smallest to largest values. (D) Summary of CCP size estimated by the center-to-center distance between the bound PAR2 receptors and CCPs versus CCP intensity. The green parabola plots the prediction that CCP size is proportional to (intensity of clathrin)1/2. The average CCP size was 124 ± 14 nm (n = 5 cases from a single experiment, magenta). See SI Appendix, Fig. S13 for detailed information. (E) TIRF imaging showing recruitment of β-arrestin 2 to CCPs by PAR2 activation. Cells were transiently transfected with PAR2 dark (1 μg cDNA), β-arrestin-2-YFP (0.05 μg cDNA), and clathrin-DsRed (0.05 μg cDNA). TIRF images showing localization of β-arrestin 2 (green) and CCP (magenta) before and after AP addition. The line scans (white dotted line) showed only modest basal coclustering of β-arrestin 2 with CCP before addition of 100 μM AP and greater coclustering after AP. The image was taken ∼10 min after addition of AP. (Scale bar, 4 µm.) (F) dSTORM image after endogenous β-arrestin 2 labeling with Alexa 647–conjugated primary antibodies. PAR2 was activated. (Scale bar, 5 µm.) Localization precision of Alexa 647 dyes and lateral resolution was 9 and 62 nm, respectively. (Inset) Expanded, noninverted fluorescence image to visualize the clustered β-arrestins. (Scale bar, 0.6 µm.) (G) Distribution of diameters of hollow structures from the difference of Gaussian peak positions. Mean: 98 ± 4 nm (n = 30 clusters). (Inset) One typical β-arrestin 2 donut cluster. (H) Distribution of diameters of high-density β-arrestin 2 clusters without hollow structure from full-width-at-half-maximum. Mean: 97 ± 4 nm (n = 28 clusters). (Inset) One typical filled β-arrestin 2 cluster. The data were collected from one representative result among six independent experiments. (I) Effects of blocking CCP formation on normalized cytoplasmic PH-RFP intensity during AP application. Average traces without error bars are shown for better visibility. Pitstop2 (average normalized cytoplasmic PH-RFP intensity between 1,000 and 1,200 s: 1.46 ± 0.13, n = 6 cells, P < 0.05) compared to control (1.0 ± 0.09, n = 4 cells) or clathrin heavy chain siRNA (average cytoplasmic PH-RFP intensity between 800 and 1,000 s: 1.65 ± 0.16, n = 6 cells, P < 0.005) compared to control siRNA (0.96 ± 0.1, n = 4 cells).
Fig. 7.
Fig. 7.
Working hypothesis for β-arrestin–dependent PIP5K-Iγ recruitment and PI(4,5)P2 regeneration at CCPs. CCPs are represented as a yellow hexagonal lattice with lattice spacing of 10 to 12 nm according to electron microscope images and super-resolution imaging (9, 54). Receptor–β-arrestin complexes join and interact tightly with the boundary of preexisting CCPs (Upper) or become incorporated more internally within newly forming CCPs (Lower). The preexisting CCPs vary in size, and the newly forming CCPs are growing in time. Therefore, snapshot images of those states would yield different sizes of β-arrestin clusters (as measured in Fig. 6 D, F, and G). Mobile PIP5K-Iγs bind transiently to receptor/β-arrestin/AP-2 complexes on CCPs. The complexed PIP5K-Iγs converts laterally diffusing PI(4)P to PI(4,5)P2 locally at the CCPs (a twofold increase of activity), promoting PI(4,5)P2-dependent endocytosis. Preexisting CCPs are shown as accumulating a donut-shaped peripheral ring of PAR2 receptor complexes forming a hollow structure. By comparison, newly forming CCPs grow continuously to make mature CCPs with β-arrestins dispersed within them (nonhollow structure). As CCPs grow with AP-2, more β-arrestin–PAR2 receptor complexes can accumulate into the growing structure. After maturation and depending on the amount of PI(4,5)P2, the CCP may be internalized.

Similar articles

Cited by

References

    1. McCrea H. J., De Camilli P., Mutations in phosphoinositide metabolizing enzymes and human disease. 24:8-16. Physiology (Bethesda) 24, 8–16 (2009). - PMC - PubMed
    1. Yen H. Y., et al. ., PtdIns(4,5)P2 stabilizes active states of GPCRs and enhances selectivity of G-protein coupling. Nature 559, 423–427 (2018). - PMC - PubMed
    1. Huang W., et al. ., Structure of the neurotensin receptor 1 in complex with β-arrestin 1. Nature 579, 303–308 (2020). - PMC - PubMed
    1. Posor Y., Eichhorn-Grünig M., Haucke V., Phosphoinositides in endocytosis. Biochim. Biophys. Acta 1851, 794–804 (2015). - PubMed
    1. Luttrell L. M., Lefkowitz R. J., The role of beta-arrestins in the termination and transduction of G-protein-coupled receptor signals. J. Cell Sci. 115, 455–465 (2002). - PubMed

Publication types

MeSH terms

LinkOut - more resources