. 2021 May 28;31(5):667-675.
doi: 10.4014/jmb.2103.03053.

IL-17A Secreted by Th17 Cells Is Essential for the Host against Streptococcus agalactiae Infections

Affiliations

IL-17A Secreted by Th17 Cells Is Essential for the Host against Streptococcus agalactiae Infections

Jing Chen et al. J Microbiol Biotechnol. .

Abstract

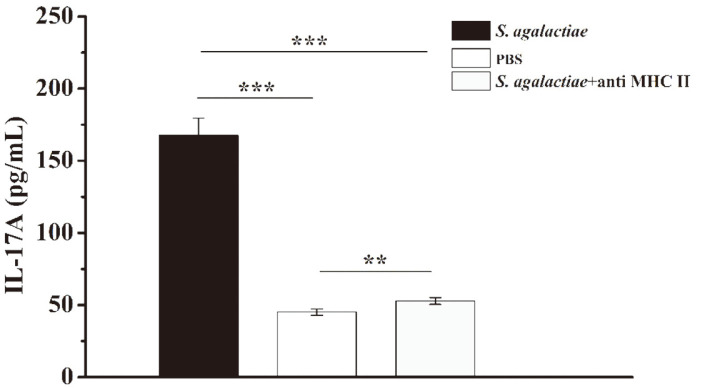
Streptococcus agalactiae is an important bacterial pathogen and causative agent of diseases including neonatal sepsis and meningitis, as well as infections in healthy adults and pregnant women. Although antibiotic treatments effectively relieve symptoms, the emergence and transmission of multidrug-resistant strains indicate the need for an effective immunotherapy. Effector T helper (Th) 17 cells are a relatively newly discovered subpopulation of helper CD4+ T lymphocytes, and which, by expressing interleukin (IL)-17A, play crucial roles in host defenses against a variety of pathogens, including bacteria and viruses. However, whether S. agalactiae infection can induce the differentiation of CD4+ T cells into Th17 cells, and whether IL-17A can play an effective role against S. agalactiae infections, are still unclear. In this study, we analyzed the responses of CD4+ T cells and their defensive effects after S. agalactiae infection. The results showed that S. agalactiae infection induces not only the formation of Th1 cells expressing interferon (IFN)-γ, but also the differentiation of mouse splenic CD4+ T cells into Th17 cells, which highly express IL-17A. In addition, the bacterial load of S. agalactiae was significantly increased and decreased in organs as determined by antibody neutralization and IL-17A addition experiments, respectively. The results confirmed that IL-17A is required by the host to defend against S. agalactiae and that it plays an important role in effectively eliminating S. agalactiae. Our findings therefore prompt us to adopt effective methods to regulate the expression of IL-17A as a potent strategy for the prevention and treatment of S. agalactiae infection.

Keywords: Streptococcus agalactiae; T helper 17 cells; interleukin-17A.


Conflict of interest statement

Conflict of Interest

The authors have no financial conflicts of interest to declare.

Figures

Fig. 1
Fig. 1. The proliferation of CD4+ T cells in BALB/c mice induced by S. agalactiae.
BALB/c mice were infected intraperitoneally with a 1 × 10⁸ CFU dose of S. agalactiae (n = 5). Mice injected with PBS served as negative controls (−) (n = 5). After 6 h, the mice were sacrificed. Splenic lymphocytes were isolated from spleen and incubated in vitro (5 × 10⁶ cells/ml). This experiment was repeated three times with similar results. Proliferation of splenic lymphocytes was detected by CCK-8 assay (A). The proportion of CD4+ T cells in the splenic lymphocytes was analyzed by flow cytometry. Representative flow cytometry plots are from one of three independent experiments that gave similar results (B). Bar graphs show mean numbers ± SEM tested over three independent experiments (C). Significant differences are indicated by ** (p < 0.01) and *** (p < 0.001).
Fig. 2
Fig. 2. The levels of IFN-γ, IL-4 and IL-17A secreted from splenic lymphocytes were determined by ELISA.
BALB/c mice were injected intraperitoneally with a 1 × 10⁸-CFU dose of S. agalactiae (n = 3). Spleens were harvested 6 h after infection and splenic lymphocytes were plated at 5 × 10⁶ cells/ml. After 4 h of incubation, the bacteriostatic agent chloramphenicol (12 μg /ml) was added. Cells were then incubated for 72 h and supernatants were collected for cytokine analysis by ELISA. Mice injected with PBS served as controls. This experiment was repeated three times with similar results. Bar graphs show mean numbers ± SEM. Significant differences are indicated by *** (p < 0.001) and not significant by ‘ns’.
Fig. 3
Fig. 3. Secretion levels of IL-6 and TGF-β were determined by ELISA.
A: IL-6; B: TGF-β. To determine the expression levels of IL-6 and TGF-β, BALB/c mice were infected with 1 × 10⁸-CFU dose of S. agalactiae (n = 3). Spleens were harvested 6 h after infection and splenic lymphocytes were incubated for 24 h. Supernatant was collected for measured using ELISA kits. Mice injected with PBS served as controls. This experiment was repeated three times with similar results. Bar graphs show mean numbers ± SEM. Significant differences are indicated by *** (p < 0.001).
Fig. 4
Fig. 4. The level of IL-17A in the presence of MHC II was analyzed by ELISA.
BALB/c mice were challenged with S. agalactiae (1 × 10⁸ CFUs/mouse) by intraperitoneal injection (n = 3). At 6 h post-infection, the mice were sacrificed, and their spleens were harvested. Splenic lymphocytes (5 × 10⁶ cells/mL) were isolated from spleens and cultured in the presence or absence of anti-MHC-II (10 μg/ml). The supernatants were collected, and after 72 h, the IL-17A levels were analyzed by ELISA. Mice injected with PBS served as controls (n = 3). This experiment was repeated three times with similar results. Bar graphs show mean numbers ± SEM. Significant differences are indicated by ** (p < 0.01) and *** (p < 0.001).
Fig. 5
Fig. 5. CD69 expression was analyzed by flow cytometry.
DCs were infected with S. agalactiae for 1 h. Extracellular bacteria were killed by an antibiotic treatment and cultures were washed prior to the addition of freshly isolated splenic CD4+ T cells from naïve mice (5: 1 T cell: DC ratio). Co-cultures were incubated for 8 h, cells were harvested and labeled with CD69 antibody, and CD69 expression was analyzed by flow cytometry. Co-cultures incubated and stimulated with PBS served as negative controls (−). This experiment was repeated three times with similar results. Representative flow cytometry plots are from one of three independent experiments that gave similar results (A). Bar graphs show mean numbers ± SEM tested over three independent experiments (B). Significant differences are indicated by *** (p < 0.001).
Fig. 6
Fig. 6. Phenotypic analysis of CD4+ T cells after infection with S. agalactiae.
Co-cultures were incubated for 72 h, and Brefeldin A (3 μg/ml) was added for the last 5 h. After fixation and permeabilization, intracellular labeling was performed with anti-IFN-γ-APC and anti-IL-17A-PE. Cells were harvested and analyzed by flow cytometry. Co-cultures incubated with PBS served as negative controls (−). The experiment was repeated twice times with similar results. Representative flow cytometry plots are from one of two independent experiments that gave similar results (A). Bar graphs show mean numbers ± SEM tested over two independent experiments (B). Significant differences are indicated by *** (p < 0.001) and not significant by ‘ns’.
Fig. 7
Fig. 7. The neutralization of IL-17A resulted in an apparent increase in the bacterial colonization level in vivo.
Anti-IL-17A (50 μg/100 μl) IgG was injected into the tail vein of BALB/c mice at 24 h before S. agalactiae challenge or 6 h after infection. Mice were injected with an equal amount of PBS as a negative control group. Mice were infected intraperitoneally with a 1 × 10⁸ CFU dose of S. agalactiae. At 2 days post-infection, the mice were sacrificed, and their lungs, livers, spleen and kidneys were harvested and homogenized for the determination of the CFUs in the bacterial load. Data shown are from n = 5 independent animals. Each symbol represents one mouse. Horizontal line indicates median. Significant differences are indicated by * (p < 0.05), ** (p < 0.01) and *** (p < 0.001).
Fig. 8
Fig. 8. IL-17A treatments caused a significant decrease in the bacterial colonization of mouse bodies.
rIL-17A (1 μg/100 μl) was injected into the tail veins of BALB/c mice at 24 h before S. agalactiae (1 × 10⁸ CFU) infection or 6 h after infection. Mice were injected with an equal amount of PBS as a negative control group. The method of calculating bacterial colonization of the organs was described above. Data shown are from n = 5 independent animals. Each symbol represents one mouse. Horizontal line indicates median. Asterisks indicate significant differences between vaccinated and control mice. Significant differences are indicated by * (p < 0.05), ** (p < 0.01) and *** (p < 0.001).

Similar articles

Cited by

References

    1. Raabe VN, Shane AL. Group B Streptococcus (Streptococcus agalactiae) Microbiol. Spectr. 2019;7:10.1128/microbiolspec.GPP3-0007-2018. doi: 10.1128/microbiolspec.GPP3-0007-2018. - DOI - PMC - PubMed
    1. Rosen GH, Randis TM, Desai PV, Sapra KJ, Ma B, Gajer P, et al. Group B Streptococcus and the vaginal microbiota. J. Infect. Dis. 2017;216:744–751. doi: 10.1093/infdis/jix395. - DOI - PMC - PubMed
    1. Khan MA, Faiz A, Ashshi AM. Maternal colonization of group B streptococcus: prevalence, associated factors and antimicrobial resistance. Ann. Saudi Med. 2015;35:423–427. doi: 10.5144/0256-4947.2015.423. - DOI - PMC - PubMed
    1. Melin P. Neonatal group B streptococcal disease: from pathogenesis to preventive strategies. Clin. Microbiol. Infect. 2011;17:1294–1303. doi: 10.1111/j.1469-0691.2011.03576.x. - DOI - PubMed
    1. Edmond KM, Kortsalioudaki C, Scott S, Schraf SJ, Zaidi AKM, Cousens S, et al. Group B streptococcal disease in infants aged younger than 3 months: systematic review and meta-analysis. Lancet. 2012;379:547–556. doi: 10.1016/S0140-6736(11)61651-6. - DOI - PubMed

MeSH terms