. 2021 Apr 20;12(1):2330.
doi: 10.1038/s41467-021-22431-6.

Prostaglandin in the ventromedial hypothalamus regulates peripheral glucose metabolism

Affiliations

Prostaglandin in the ventromedial hypothalamus regulates peripheral glucose metabolism

Ming-Liang Lee et al. Nat Commun. .

Abstract

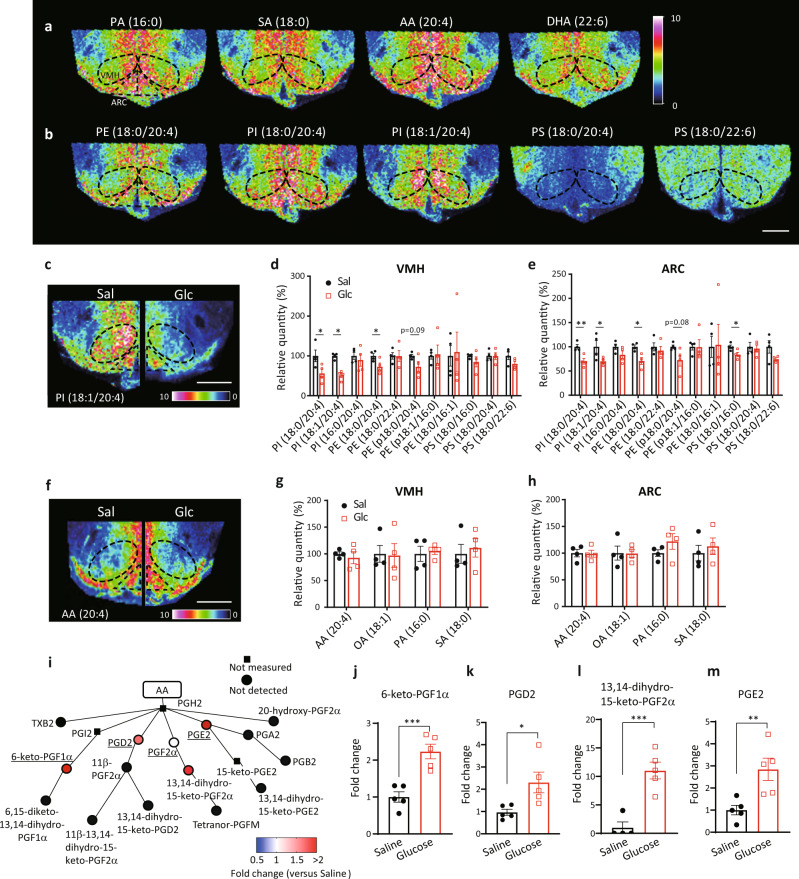
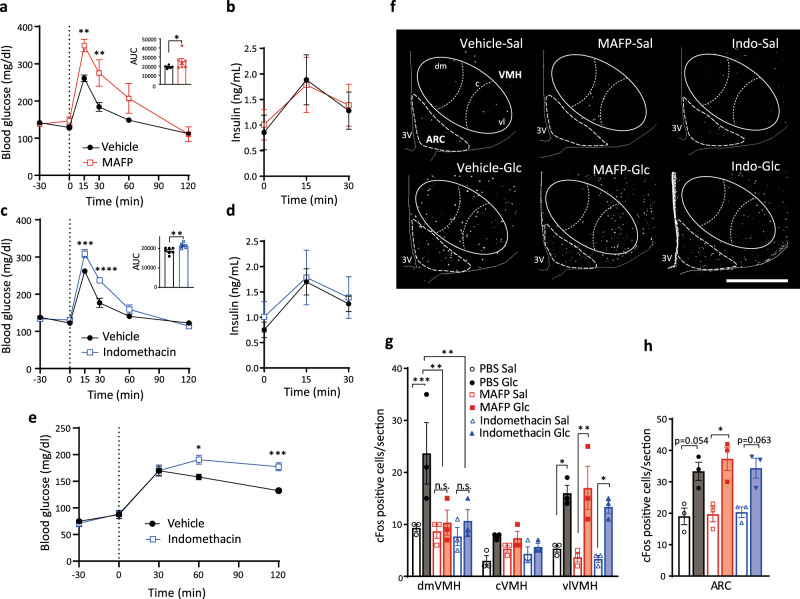
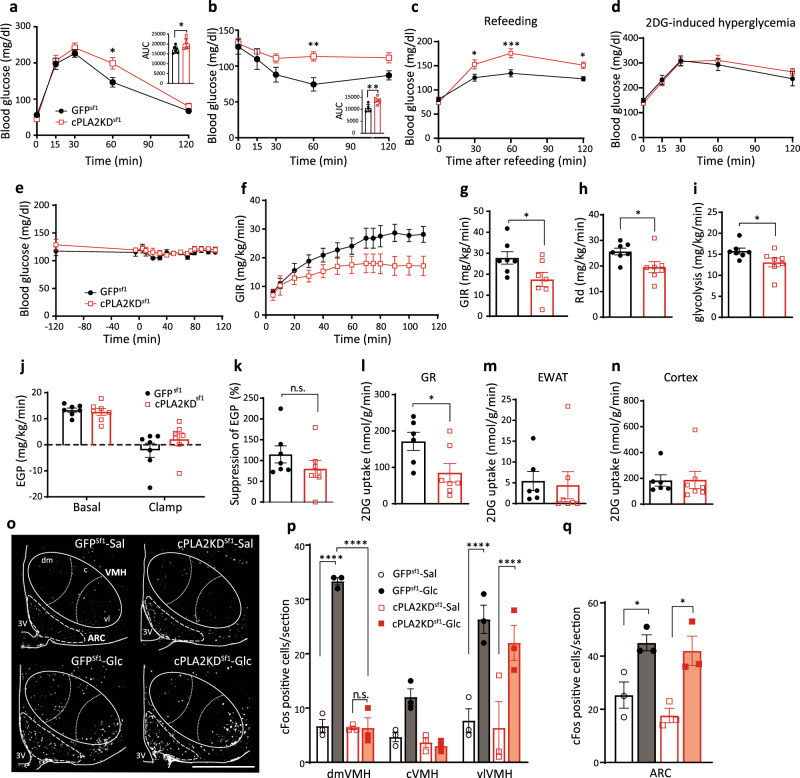
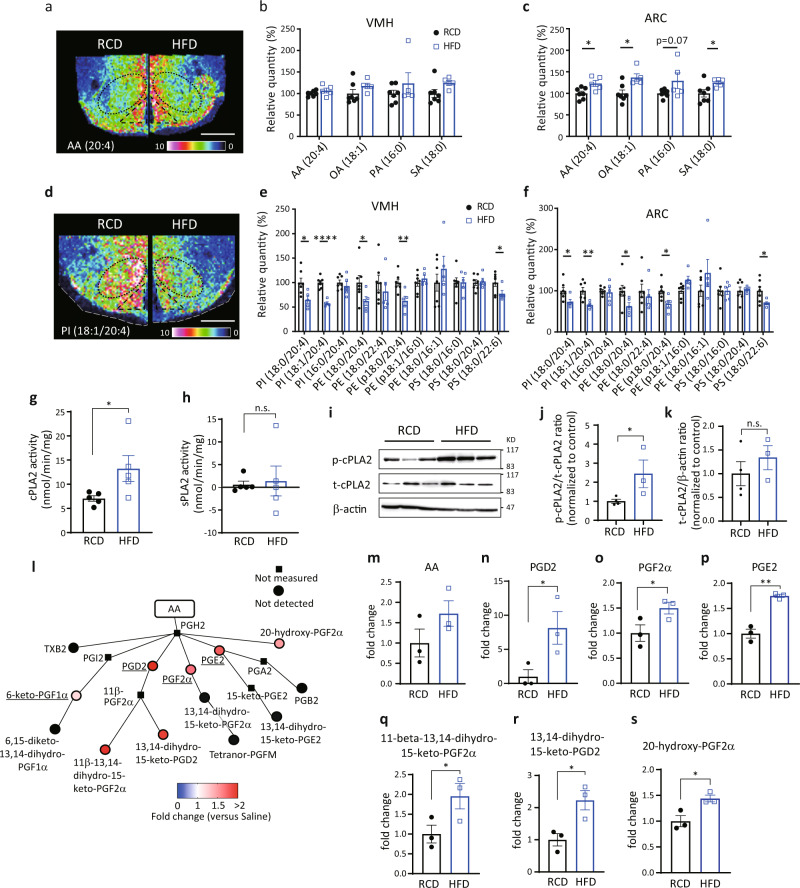
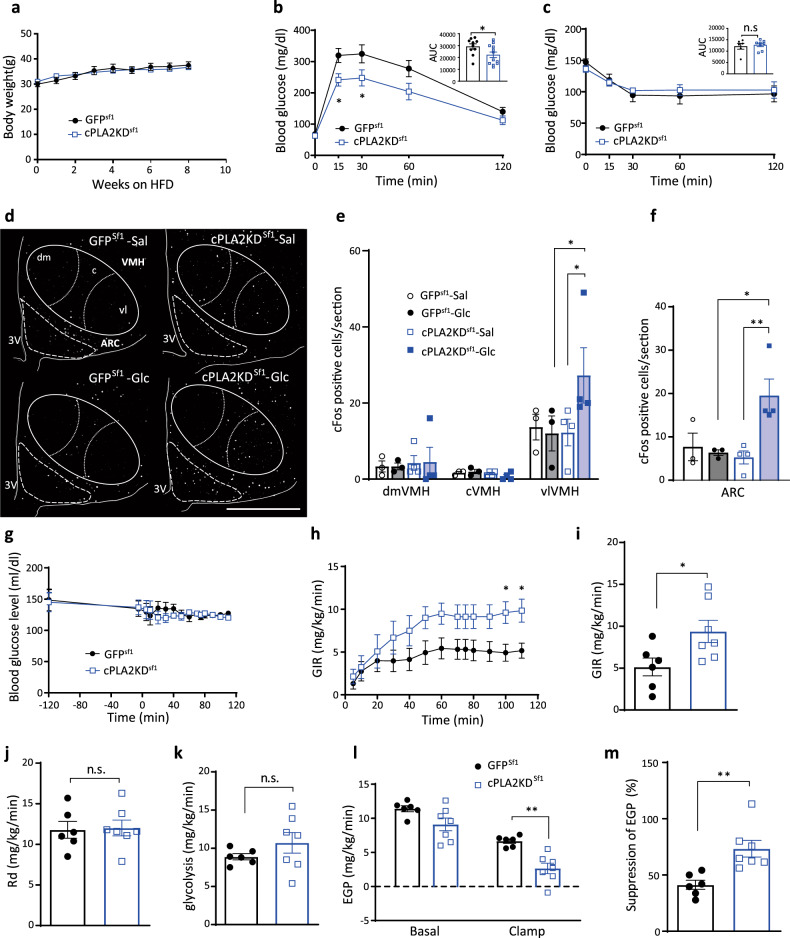
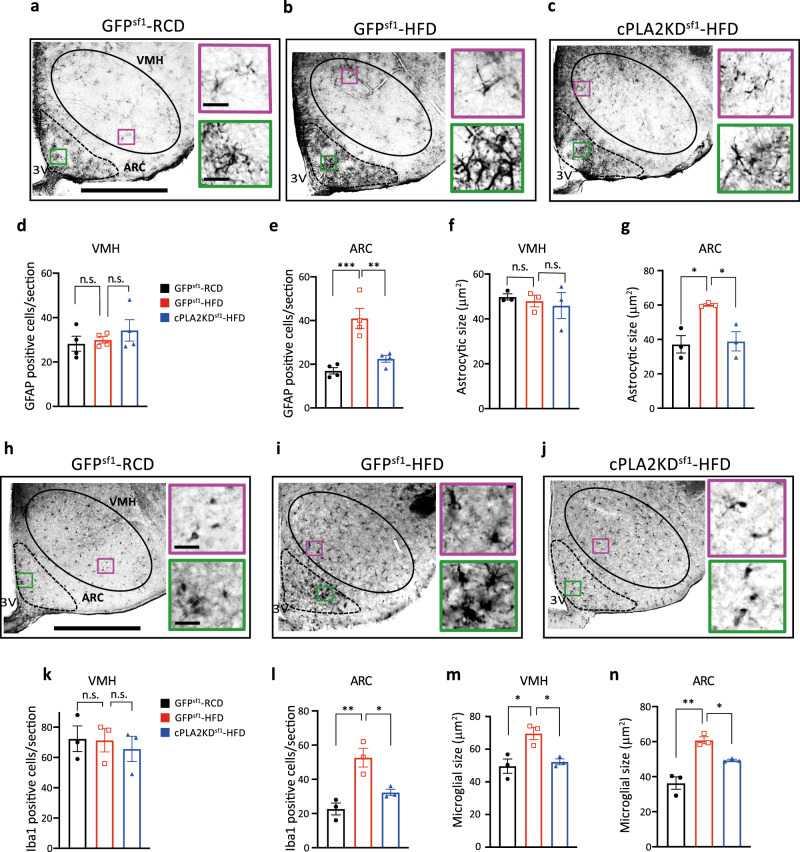
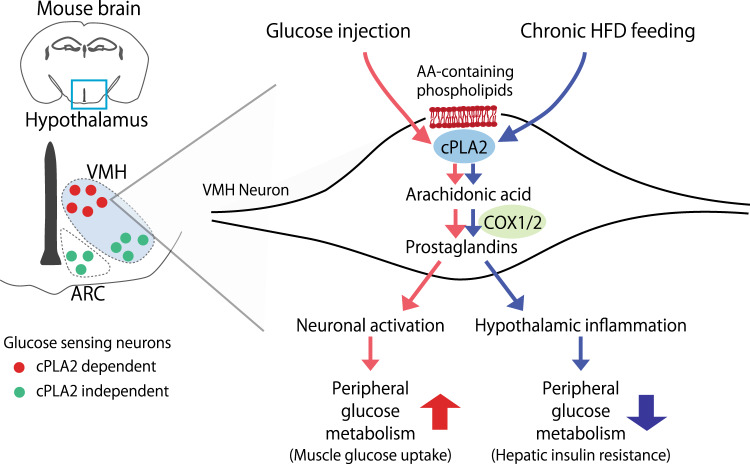
The hypothalamus plays a central role in monitoring and regulating systemic glucose metabolism. The brain is enriched with phospholipids containing poly-unsaturated fatty acids, which are biologically active in physiological regulation. Here, we show that intraperitoneal glucose injection induces changes in hypothalamic distribution and amounts of phospholipids, especially arachidonic-acid-containing phospholipids, that are then metabolized to produce prostaglandins. Knockdown of cytosolic phospholipase A2 (cPLA2), a key enzyme for generating arachidonic acid from phospholipids, in the hypothalamic ventromedial nucleus (VMH), lowers insulin sensitivity in muscles during regular chow diet (RCD) feeding. Conversely, the down-regulation of glucose metabolism by high fat diet (HFD) feeding is improved by knockdown of cPLA2 in the VMH through changing hepatic insulin sensitivity and hypothalamic inflammation. Our data suggest that cPLA2-mediated hypothalamic phospholipid metabolism is critical for controlling systemic glucose metabolism during RCD, while continuous activation of the same pathway to produce prostaglandins during HFD deteriorates glucose metabolism.


Conflict of interest statement

The authors declare no competing interests.

Figures

Fig. 1
Fig. 1. Hyperglycemia increases prostaglandin production derived from phospholipids.
a, b Representative results of imaging mass spectrometry (IMS) showing distributions of hypothalamic fatty acids (a) and phospholipids (b) from untreated RCD-fed mice. The dashed black line shows the position of the VMH. Scale bar: 500 μm. ch Distributions of phospholipids and fatty acids in the hypothalamus 30 min after injection of saline (Sal) or glucose (Glc; 2 g/kg). c, f Representative results of IMS on hypothalamic phosphatidyl-inositol (PI; 18:1/20:4) (c) and arachidonic acid (AA) (f) from mice i.p. injected with saline (left half) or glucose (right half). Scale bar: 500 μm. d, e Relative intensities of phospholipids in the VMH (d) and ARC (e) after injection with saline (n = 4) or glucose (n = 4). (two-tailed t test for each molecule, VMH: p = 0.0268 in PI (18:0/20:4), p = 0.0005 in PI (18:1/20:4), and p = 0.0491 in PE (18:0/20:4); ARC: p = 0.0073 in PI (18:0/20:4), p = 0.0347 in PI (18:1/20:4), p = 0.0106 in PE (18:0/20:4), and p = 0.0331 in PS(18:0/16:0), Glc vs Sal g, h Relative intensities of fatty acids in the VMH (g) and ARC (h) after injection with saline (n = 4) or glucose (n = 4). im LC-MS results showing the effects of glucose injection on AA metabolites in the whole hypothalamus. i Relative amounts of hypothalamic prostaglandins mediated by cyclooxygenase. Major prostaglandins were underlined. j 6-keto-PGF1α, k PGD2, l 13,14-dihydro-15-keto-PGF2α and m PGE2 were increased by glucose injection (two-tailed t test, p = 0.0009 in j, p = 0.0244 in k, p = 0.0011 in l, p = 0.0099 in m, n = 5/each, Glc vs Sal). dh and jm represent the mean ± SEM; *p < 0.05; **p < 0.01; ***p < 0.001. i represents the mean fold change in color. PA palmitic acid, SA stearic acid, AA arachidonic acid, DHA docosahexaenoic acid, PE phosphatidyl-ethanolamine, PI phosphatidyl-inositol, PS phosphatidyl-serine.
Fig. 2
Fig. 2. Hypothalamic PLA2- and COX-mediated AA metabolism regulates systemic glucose tolerance and modulates glucose responsiveness in the dmVMH.
a Glucose tolerance test (GTT; 0–120 min) after intra-hypothalamic injection (−30 min) of MAFP (n = 7) or vehicle (n = 7; two-way ANOVA followed by Sidak multiple comparison test, p = 0.0065 at time = 15, p = 0.0045 at time = 30, MAFP vs Vehicle; two-tailed t test in area under the curve (AUC) during GTT, p = 0.0422, MAFP vs Vehicle). b Blood insulin concentration of MAFP (n = 6) or vehicle (n = 6) injected mice during GTT. c GTT (0–120 min) after intra-hypothalamic injection (−30 min) of indomethacin (n = 6) or vehicle (n = 7; two-way ANOVA followed by Sidak multiple comparison test, p = 0.0002 at time = 15, p < 0.0001 at time = 30, indomethacin vs Vehicle; two-tailed t test in AUC during GTT, p = 0.0074, indomethacin vs Vehicle). d Blood insulin concentration of indomethacin (n = 6) or saline (n = 7) injected mice during GTT. e Blood glucose levels in refeeding after intra-hypothalamic injection (−30 min) of indomethacin (n = 6) or vehicle (n = 5; two-way ANOVA followed by Sidak multiple comparison test, p = 0.0141 at time = 60, p = 0.0004 at time = 120, indomethacin vs Vehicle). f Representative micrographs showing immunofluorescent cFos staining in the hypothalamus of saline (upper panels) or glucose (lower panels) injected mice after i.c.v. injection of PBS, MAFP, or indomethacin (indo). Scale bar: 500 μm. dm dorsomedial, c central, vl ventrolateral part of the VMH. g, h Quantification of cFos expression in the dorsomedial (dmVMH), central (cVMH), and ventrolateral (vlVMH) subregions of the VMH (g) and ARC (h) from mice injected with saline or glucose after i.c.v. injection of PBS, MAFP, or indomethacin (n = 3 in each experimental group; VMH: two-way ANOVA followed by Sidak multiple comparison test, for dmVMH: p = 0.0004 PBS Glc vs PBS Sal, p = 0.0011 PBS Glc vs MAFP Glc, p = 0.0015 PBS Glc vs Indomethacin Glc, for vlVMH, p = 0.0145 PBS Sal vs PBS Glc, p = 0.0011 MAFP Sal vs MAFP Glc, p = 0.0269 Indomethacin Sal vs Indomethacin Glc. For ARC: one-way ANOVA followed by Sidak multiple comparison test, p = 0.0124 MAFP Sal vs MAFP Glc. All data represent the mean ± SEM; *p < 0.05; **p < 0.01; ***p < 0.001; ****p < 0.0001.
Fig. 3
Fig. 3. Knockdown of Sf1-neuronal pla2g4a impairs systemic glucose metabolism.
a Glucose tolerance test in cPLA2KD Sf1 (n = 6) and GFPSf1 mice (n = 6; two-way ANOVA followed by Sidak multiple comparison test, p = 0.0126 at time = 60, cPLA2KDSf1 vs GFPsf1; two-tailed t test in area under the curve (AUC) during GTT, p = 0.0433, cPLA2KDSf1 vs GFPsf1). b Insulin tolerance test in cPLA2KDSf1 (n = 6) and GFPSf1 mice (n = 5; two-way ANOVA followed by Sidak multiple comparison test, p = 0.0094 at time = 60 cPLA2KDSf1 vs GFPsf1; two-tailed t test in AUC during GTT, p = 0.0071, cPLA2KDSf1 vs GFPsf1). c Blood glucose levels after refeeding in cPLA2KDSf1 (n = 6) and GFPSf1 mice (n = 9; two-way ANOVA followed by Sidak multiple comparison test, p = 0.0255 at time = 30, p = 0.0003 at time = 60, p = 0.0211 at time = 120, cPLA2KDSf1 vs GFPsf1). d 2-deoxy-glucose (2DG)-induced hyperglycemia in cPLA2KD Sf1 (n = 6) and GFPSf1 mice (n = 6). en Hyperinsulinemic–euglycemic clamp studies in cPLA2KDSf1 and GFPSf1 mice. e Blood glucose levels during hyperinsulinemic–euglycemic clamp studies in cPLA2KDSf1 or GFPSf1 mice. f The glucose infusion rate (GIR) required to maintain euglycemia during the clamp period in cPLA2KDSf1 (n = 7) or GFPSf1 mice (n = 7). g The average GIR between 75 and 115 min in cPLA2KDSf1 (n = 7) or GFPSf1 mice (n = 7; two-tailed t test, p = 0.0395, cPLA2KDSf1 vs GFPsf1). h The rate of glucose disappearance (Rd) during the clamp period, which represents whole-body glucose utilization (two-tailed t test, p = 0.0355, cPLA2KDSf1 vs GFPsf1). i The rates of whole-body glycolysis in cPLA2KDSf1 (n = 7) or GFPSf1 mice (n = 7; two-tailed t test, p = 0.0497, cPLA2KDSf1 vs GFPsf1). j Endogenous glucose production (EGP) during both the basal and clamp periods in cPLA2KDSf1 (n = 7) or GFPSf1 (n = 7). k Insulin-induced suppression of EGP, which represents hepatic insulin sensitivity in cPLA2KDSf1 (n = 7) or GFPSf1 (n = 7). ln Graphs showing 2-[14C]-Deoxy-d-Glucose uptake in red portions of the gastrocnemius (GR; l), white adipocyte (EWAT; m) and brain (cortex; n) during the clamp period in cPLA2KDSf1 (n = 7) or GFPSf1 mice (n = 7; two-tailed t test, p = 0.0352 in l, cPLA2KDSf1 vs GFPsf1). o Representative micrographs showing immunofluorescent cFos staining in the hypothalamus of cPLA2KDSf1 and GFPSf1 mice after saline or glucose injection (3 g/kg). Scale bar: 500 μm. p, q Quantification of cFos expression in the dmVMH, cVMH, vlVMH, and ARC of cPLA2KDSf1 or GFPSf1 mice after saline (n = 3) or glucose (n = 3) injection (3 g/kg; VMH: two-way ANOVA followed by Sidak multiple comparison test, for dmVMH: p < 0.0001 GFPSf1 Sal vs GFPSf1 Glc, p < 0.0001 GFPSf1 Glc vs cPLA2KDSf1 Glc, for vlVMH: p < 0.0001 GFPSf1 Sal vs GFPSf1 Glc, p < 0.0001 cPLA2KDSf1 Sal vs cPLA2KDSf1 Glc. For ARC: one-way ANOVA followed by Sidak multiple comparison test, p = 0.0425 GFPSf1 Sal vs GFPSf1 Glc, p = 0.0174 cPLA2KDSf1 Sal vs cPLA2KDSf1 Glc.) All data represent the mean ± SEM; *p < 0.05; **p < 0.01; ***p < 0.001; ****p < 0.0001.
Fig. 4
Fig. 4. HFD feeding increases prostaglandin production derived from phospholipids.
af Distributions of fatty acids and phospholipids in the hypothalamus in regular chew diet- (RCD-) or high-fat diet- (HFD-) fed mice for 8 weeks. a, d Representative results of IMS on hypothalamic arachidonic acid (AA) (a) and PI (18:1/20:4) (d) from RCD-fed mice (left) or HFD-fed mice (right). Scale bar: 500 μm. b, c Relative intensities of fatty acids in the VMH (b) or ARC (c) of RCD- (n = 7) or HFD-fed mice (n = 5; two-tailed t test for each molecule, ARC: p = 0.0190 in AA(20:4), p = 0.0104 in OA(18:1), p = 0.0387 in SA(18:0), RCD vs HFD). e, f Relative intensities of phospholipids in the VMH (e) or ARC (f) of RCD- (n = 7) or HFD-fed (n = 5) mice (two-tailed t test for each molecule, for VMH: p = 0.0196 in PI (18:0/20:4), p < 0.0001 for PI (18:1/20:4), p = 0.0362 for PE (18:0/20:4), p = 0.0080 for PE (p18:0/20:4), p = 0.0307 for PS (18:0/22:6), for ARC: p = 0.0325 for PI (18:0/20:4), p = 0.0061 for PI (18:1/20:4), p = 0.0282 for PE (18:0/20:4), p = 0.0192 for PE (p18:0/20:4), and p = 0.0347 for PS (18:0/22:6)). g, h Enzymatic activity of hypothalamic cPLA2 (g) and sPLA (h) in RCD- (n = 5) or HFD-fed (n = 5) mice (two-tailed t test, p = 0.0264 in g, RCD vs HFD). ik Relative amount of total-cPLA2 (t-cPLA2) and phosphorylated-cPLA2 (p-cPLA2) between RCD and HFD-fed mice. i Representative photos of western blotting. j, k Quantification of p-cPLA2 (j) and t-cPLA2 (k) between RCD (n = 4) and HFD (n = 3) fed mice (two-tailed t test, p = 0.0338 in j, RCD vs HFD). l Relative amounts of prostaglandins in the hypothalamus after 8 weeks in HFD-fed mice (n = 3) compared with those of RCD-fed mice (n = 3). Major prostaglandins were underlined. ms Bar graphs showing COX-mediated production of AA (m), PGD2 (n), PGF2α (o), PGE2 (p), 11-beta-13,14-dihydro-15-keto-PGF2α (q), 13,14-dihydro-15-keto-PGD2 (r), and 20-hydroxy-PGF2α (s) in 8 weeks of HFD-fed mice (n = 3) compared with RCD-fed mice (n = 3; two-tailed t test, p = 0.0256 in n, p = 0.0339 in o, p = 0.0013 in p, p = 0.0354 in q, p = 0.0260 in r, p = 0.0250 in s, RCD vs HFD). All data represent the mean ± SEM; *p < 0.05; **p < 0.01; ***p < 0.001; ****p < 0.0001.
Fig. 5
Fig. 5. Knockdown of cPLA2 improves HFD-induced impairment of glucose metabolism.
a Body weight change in cPLA2KDSf1 mice (n = 12) and GFPSf1 mice (n = 11). b Glucose tolerance test on cPLA2KDSf1 mice (n = 12) and GFPSf1 mice (n = 10; two-way ANOVA followed by Sidak multiple comparison test, p = 0.0415 at time = 15, p = 0.0482 at time = 30, cPLA2KDSf1 vs GFPsf1; two-tailed t test in area under the curve (AUC) during GTT, p = 0.0428, cPLA2KDSf1 vs GFPsf1). c Insulin tolerance test on cPLA2KDSf1 (n = 8) mice and GFPSf1 mice (n = 6) during 8 weeks of HFD feeding. d Representative micrographs showing immunofluorescent cFos staining in the hypothalamus of HFD-fed cPLA2KDSf1 and GFPSf1 mice after saline or glucose injection. Scale bar: 500 μm. e, f Quantification of cFos expression in the dmVMH, cVMH, vlVMH (e) and ARC (f) of HFD-fed cPLA2KDSf1 or GFPSf1 mice after saline or glucose injection (n = 3–4 in each experimental group; VMH: two-way ANOVA followed by Sidak multiple comparison test. for vlVMH: p = 0.0231 cPLA2KDSf1 Sal vs cPLA2KDSf1 Glc, p = 0.014 GFPSf1 Glc vs cPLA2KDSf1 Glc. For ARC: one-way ANOVA followed by Sidak multiple comparison test, p = 0.0176 cPLA2KDSf1 Sal vs cPLA2KDSf1 Glc, p = 0.0444 GFPSf1 Glc vs cPLA2KDSf1 Glc). gm Hyperinsulinemic–euglycemic clamp studies in HFD-fed cPLA2KDSf1 (n = 7) or GFPSf1 (n = 7) mice. g Blood glucose levels during hyperinsulinemic–euglycemic clamp studies in HFD-fed cPLA2KDSf1 (n = 7) or GFPSf1 (n = 7) mice. h The glucose infusion rate (GIR) required to maintain euglycemia during the clamp period in cPLA2KDSf1 (n = 7) or GFPSf1 (n = 6) mice. i The average GIR between 75 and 115 min in cPLA2KDSf1 (n = 7) or GFPSf1 (n = 6) mice (two-tailed t test, p = 0.0324, cPLA2KDSf1 vs GFPSf1). j The rate of glucose disappearance (Rd) during the clamp period, which represents whole-body glucose utilization. k The rates of whole-body glycolysis in cPLA2KDSf1 or GFPSf1 mice. l Endogenous glucose production (EGP) during both basal and clamp periods in cPLA2KDSf1 or GFPSf1 mice. m The percent-suppression levels of EGP induced by insulin infusion, which represents hepatic insulin sensitivity in cPLA2KDSf1 (n = 7) or GFPSf1 (n = 6) mice (two-tailed t test, p = 0.0038, cPLA2KDSf1 vs GFPSf1). All data represent the mean ± SEM; *p < 0.05; **p < 0.01.
Fig. 6
Fig. 6. Knockdown of cPLA2 prevents HFD-induced microgliosis and astrogliosis.
ac Left: representative micrographs showing immunochemistry GFAP staining in the hypothalamus of RCD-fed GFPSf1 mice (GFPSf1-RCD) (a), HFD-fed GFPSf1 mice (GFPSf1-HFD) (b), and HFD-fed cPLA2KDSf1 (cPLA2KDSf1-HFD) mice (c). Scale bar: 500 μm. Right: magnified areas in the VMH and ARC in the left. Scale bar: 30 μm. d,e, Quantification of GFAP-positive cells in the VMH (d) or ARC (e) of GFPSf1-RCD (n = 4), GFPSf1-HFD (n = 4) and cPLA2KDSf1-HFD (n = 4) mice (one-way ANOVA followed by Sidak multiple comparison test, in e, p = 0.0007 GFPSf1 RCD vs GFPSf1 HFD, p = 0.0045 GFPSf1 HFD vs cPLA2KDSf1 HFD). f,g, Size of GFAP-positive cells in in the VMH (f) or ARC (g) of GFPSf1-RCD (n = 3), GFPSf1-HFD (n = 3), and cPLA2KDSf1-HFD (n = 3) mice (one-way ANOVA followed by Sidak multiple comparison test, in g, p = 0.0002 GFPSf1 RCD vs GFPSf1 HFD, p = 0.0012 GFPSf1 HFD vs cPLA2KDSf1 HFD). hj Left: Representative micrographs showing immunochemistry Iba1 staining in the hypothalamus of GFPSf1-RCD (h), GFPSf1-HFD (i) and cPLA2KDSf1-HFD mice (j). Scale bar: 500 μm. Right: magnified areas in the VMH and ARC from the left photos. Scale bar: 30 μm. k, l Quantification of Iba1-positive cells in the VMH (k) or ARC (l) of GFPSf1-RCD (n = 3), GFPSf1-HFD (n = 3), and cPLA2KDSf1-HFD (n = 3) mice (one-way ANOVA followed by Sidak multiple comparison test, in l, p = 0.0049 GFPSf1 RCD vs GFPSf1 HFD, p = 0.0310 GFPSf1 HFD vs cPLA2KDSf1 HFD). m, n Size of Iba1-positive cells in the VMH (m) or ARC (n) of GFPSf1-RCD (n = 3), GFPSf1-HFD (n = 3), and cPLA2KDSf1-HFD (n = 3) mice (one-way ANOVA followed by Sidak multiple comparison test, in m, p < 0.0001 GFPSf1 RCD vs GFPSf1 HFD, p = 0.0004 GFPSf1 HFD vs cPLA2KDSf1 HFD, in n, p < 00001 GFPSf1 RCD vs GFPSf1 HFD, p = 0.0004 GFPSf1 HFD vs cPLA2KDSf1). All data represent the mean ± SEM; *p < 0.05; **p < 0.01; ***p < 0.001.
Fig. 7
Fig. 7. Distinct roles of prostaglandin in the regulation of peripheral glucose metabolism.
In RCD-fed mice, a glucose injection activates cPLA2 in the VMH, which increases the production of prostaglandins from neurons. The increase in prostaglandins is critical for the activation of dmVMH and glucose metabolism in peripheral tissues. Chronic HFD feeding also increases the cPLA2-mediated prostaglandin production from VMH neurons. The chronic effect of prostaglandin enhances hypothalamic inflammation and thus impairs peripheral glucose metabolism.

References

    1. Pozo M, Claret M. Hypothalamic control of systemic glucose homeostasis: the pancreas connection. Trends Endocrinol. Metab. 2018;29:581–594. doi: 10.1016/j.tem.2018.05.001. - DOI - PubMed
    1. Ruud J, Steculorum SM, Brüning JC. Neuronal control of peripheral insulin sensitivity and glucose metabolism. Nat. Commun. 2017;8:15259. doi: 10.1038/ncomms15259. - DOI - PMC - PubMed
    1. Garfield AS, et al. A parabrachial-hypothalamic cholecystokinin neurocircuit controls counterregulatory responses to hypoglycemia. Cell Metab. 2014;20:1030–1037. doi: 10.1016/j.cmet.2014.11.006. - DOI - PMC - PubMed
    1. Meek TH, et al. Functional identification of a neurocircuit regulating blood glucose. Proc. Natl Acad. Sci. USA. 2016;113:E2073–E2082. doi: 10.1073/pnas.1521160113. - DOI - PMC - PubMed
    1. Myers MG, Olson DP. Central nervous system control of metabolism. Nature. 2012;491:357–363. doi: 10.1038/nature11705. - DOI - PubMed

Publication types

MeSH terms