. 2021 Apr 20;12(1):2340.
doi: 10.1038/s41467-021-22544-y.

Epigenomic landscape of human colorectal cancer unveils an aberrant core of pan-cancer enhancers orchestrated by YAP/TAZ

Affiliations

Epigenomic landscape of human colorectal cancer unveils an aberrant core of pan-cancer enhancers orchestrated by YAP/TAZ

Giulia Della Chiara et al. Nat Commun. .

Abstract

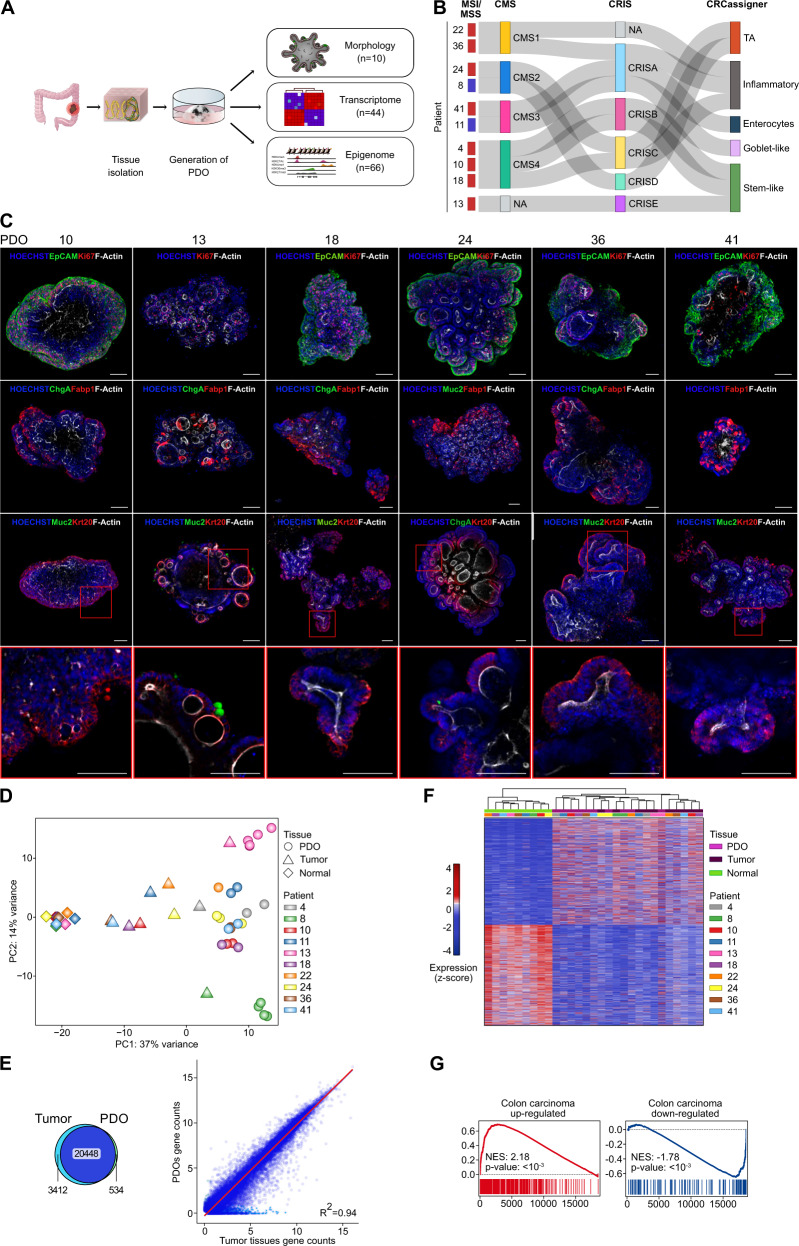
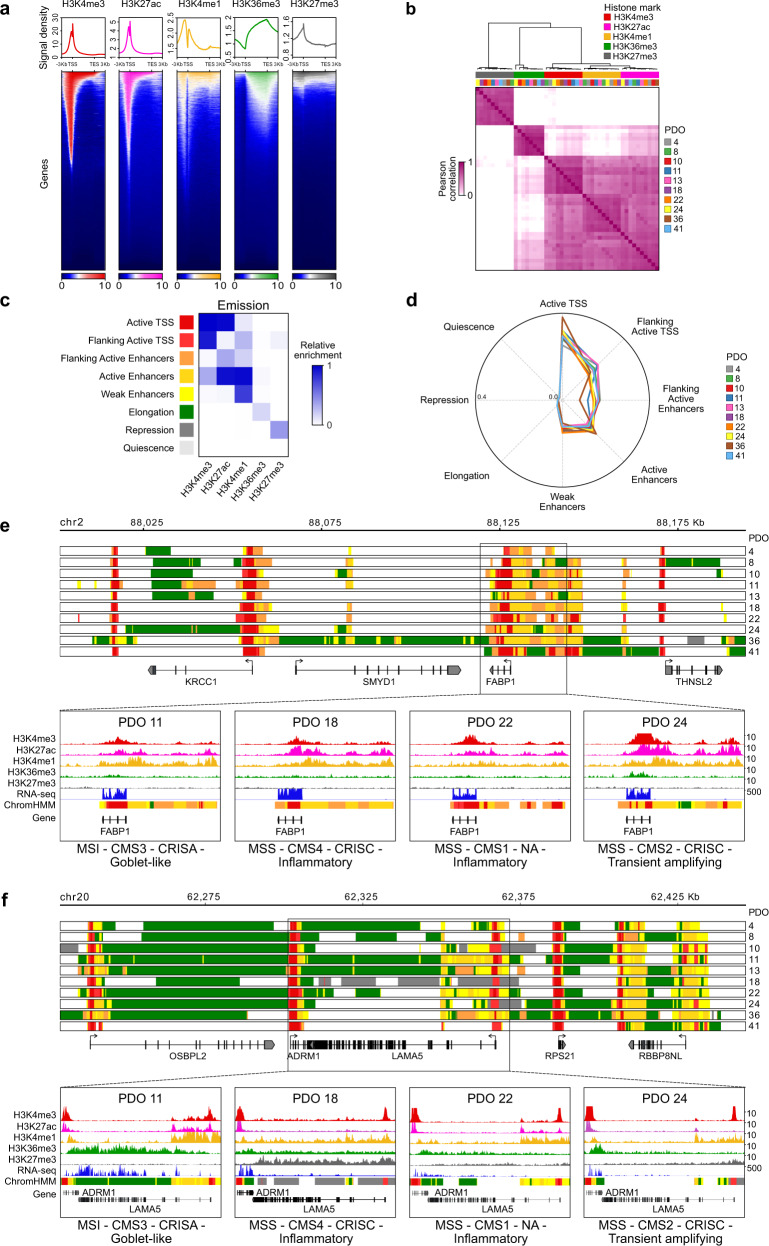
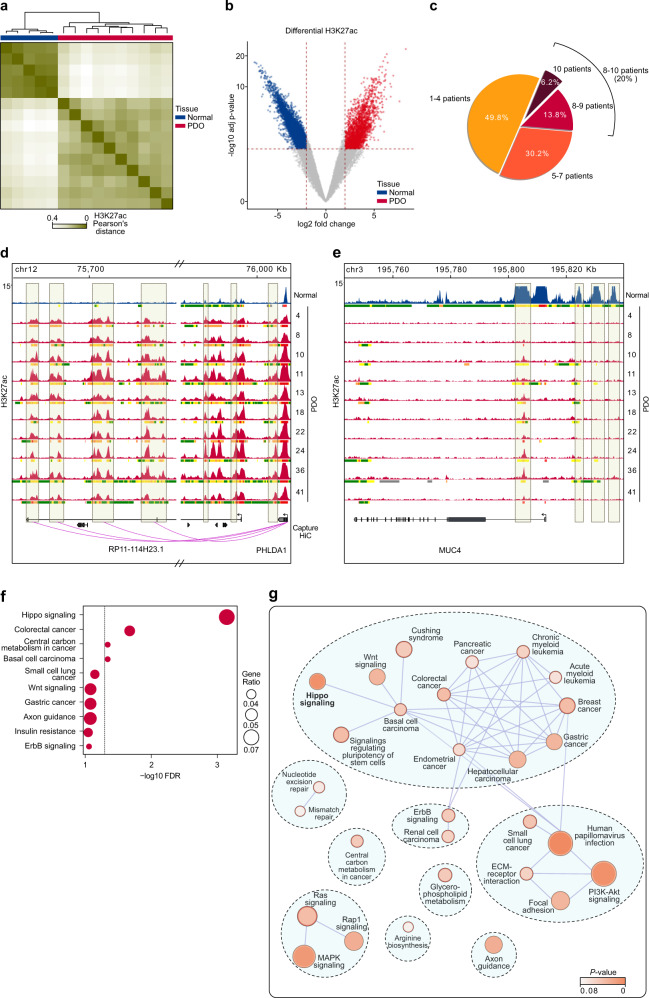
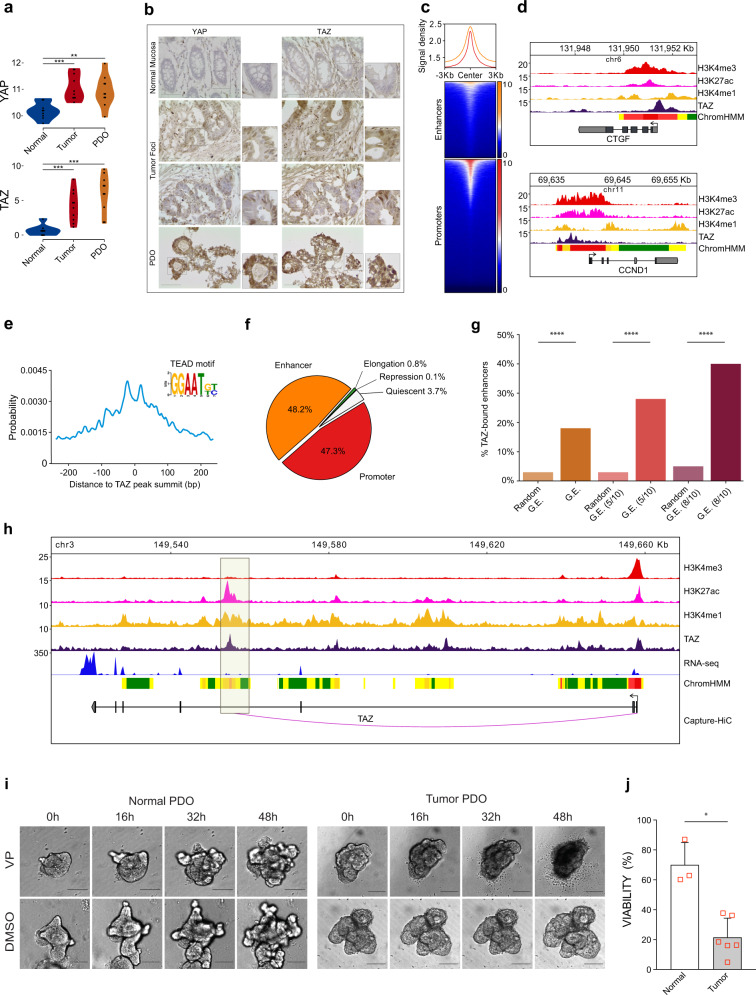
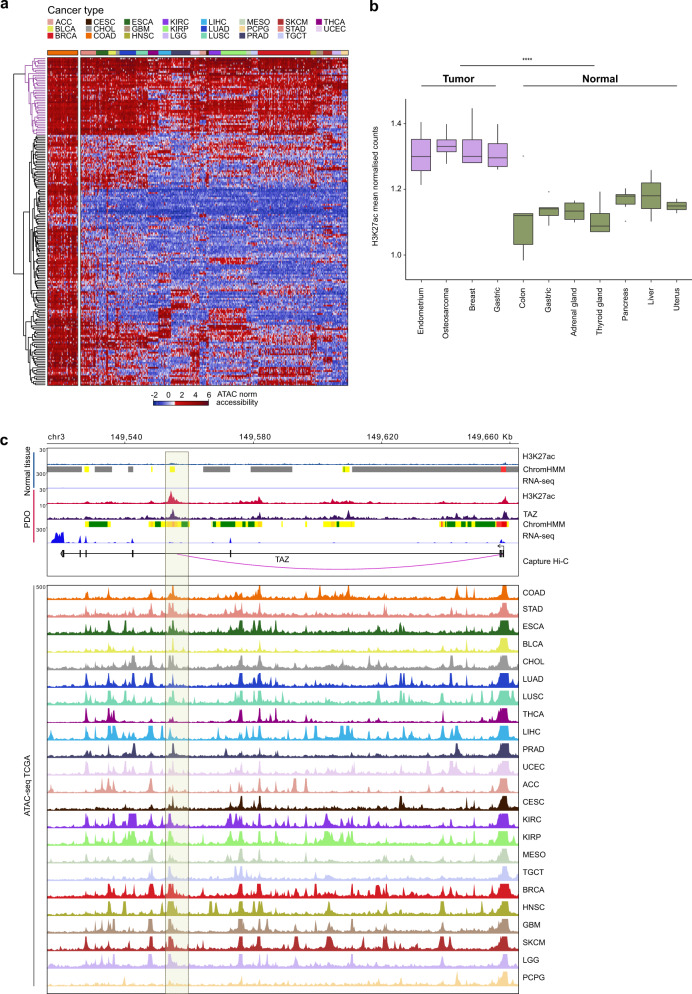
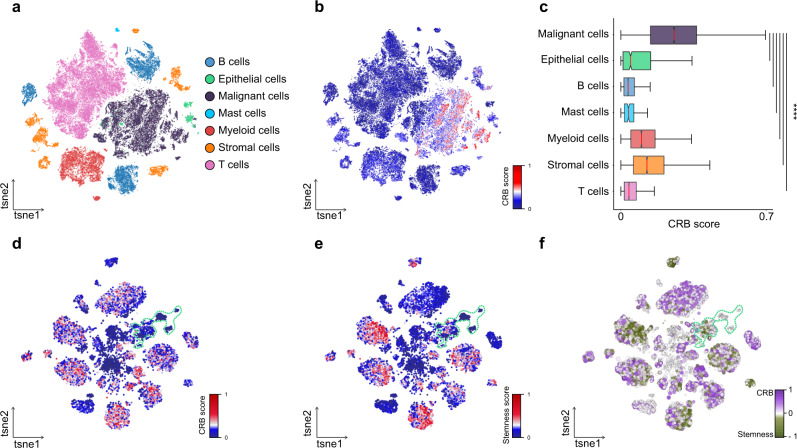
Cancer is characterized by pervasive epigenetic alterations with enhancer dysfunction orchestrating the aberrant cancer transcriptional programs and transcriptional dependencies. Here, we epigenetically characterize human colorectal cancer (CRC) using de novo chromatin state discovery on a library of different patient-derived organoids. By exploring this resource, we unveil a tumor-specific deregulated enhancerome that is cancer cell-intrinsic and independent of interpatient heterogeneity. We show that the transcriptional coactivators YAP/TAZ act as key regulators of the conserved CRC gained enhancers. The same YAP/TAZ-bound enhancers display active chromatin profiles across diverse human tumors, highlighting a pan-cancer epigenetic rewiring which at single-cell level distinguishes malignant from normal cell populations. YAP/TAZ inhibition in established tumor organoids causes extensive cell death unveiling their essential role in tumor maintenance. This work indicates a common layer of YAP/TAZ-fueled enhancer reprogramming that is key for the cancer cell state and can be exploited for the development of improved therapeutic avenues.


Conflict of interest statement

M.P. is co-founder, member of the board of directors, and stakeholder of the company CheckmAb s.r.l. The remaining authors declare no competing interests.

Figures

Fig. 1
Fig. 1. Establishment of a CRC PDO library that recapitulates the heterogeneity of the primary tumors.
a Schematic depicting the generation of a patient-derived organoid (PDO) library from primary CRC tissues and its subsequent morphological, transcriptomic, and epigenomic profiling. b Genetic and molecular classification of primary tumors revealed the heterogeneity of the organoid library. CRC patients are classified based on the consensus molecular subtypes, the CRC intrinsic classifier, and the CRCassigner. MSI Microsatellite instable (blue), MSS Microsatellite stable (red), CMS Consensus molecular subtypes, CRIS CRC intrinsic classifier. c Representative confocal images of 3D immunofluorescence whole-mount analysis on human CRC PDOs. Different markers of colon cell types are shown: polarity and structure (F-Actin, first row), the epithelium (EpCAM, first row), proliferation (Ki67, first row), absorptive cells (FABP1, second row), enteroendocrine cells (CHGA, second and third row), goblet cells (MUC2, third row), and top epithelial crypt cells (KRT20, third row). The fourth row provides an enlargement of the boxed area in the third row. Scale bars, 100 µm. d PCA on normalised gene counts from RNA-seq data distinguished normal colon mucosa, primary tumor, and PDOs. e, Venn diagram showing the number of concordant expressed genes between tumors and PDOs. Mean log2 normalized gene counts between primary tumors and PDOs were well correlated (Pearson correlation). See Supplementary Fig. 1b–d. f Hierarchical clustering analysis using differentially expressed genes (DEG, two-sided adjusted P-value ≤ 0.01 by Wald test with Benjamini–Hochberg false discovery rate correction) between tumor and normal colon tissues clustered PDOs together with parental tumors. Tissue populations and patients are represented by color-coded bars above the heatmap. g PDOs are enriched in gene signatures of CRC clinical specimen. GSEA on the ranked list of genes from the comparison between PDOs and normal colon tissue with the normalized enrichment score (NES) and nominal P-value using 1000 permutations reported.
Fig. 2
Fig. 2. Characterization of the human CRC epigenome using ChromHMM analysis.
a Histone modifications localization in relation to the gene body as well as regions surrounding ± 3 Kb of the transcription start (TSS) and end (TES) sites. Representative density plots of average intensity (top) and corresponding heatmaps (bottom) display the relative distribution of H3K4me3 (red), H3K27ac (pink), H3K4me1 (yellow), H3K36me3 (green), and H3K27me3 (gray) signals for all the genes present in the GENCODEv25 annotation. b Pearson correlation heatmap of ChIP-seq data for the complete set of five histone modifications across all patient-derived organoids (PDOs). See Supplementary Fig. 2a. c Combinatorial pattern of histone marks in an 8-state model using ChromHMM. The heatmap (Emission plot) displays the frequency of the histone modifications found in each state (Supplementary Fig. 2b). d The probability of each ChromHMM-defined chromatin state overlapping ATAC-seq regions for TCGA colon adenocarcinoma samples is shown across PDOs using a spider plot. ef Representative tracks of ChromHMM states for the (e) FABP1 and (f) LAMA5 (Supplementary Fig. 3a) genomic loci in all PDOs. The tracks denote regions identified as promoter (red), active enhancer (orange), weak enhancer (yellow), elongation (green), repressed (gray) or quiescent (white) states (Fig. 2c). The expanded regions show H3K4me3, H3K27ac, H3K4me1, H3K36me3, and H3K27me3 profiles, along with RNA-seq signal and ChromHMM states for PDOs of different molecular subtypes as indicated.
Fig. 3
Fig. 3. Differentially activated enhancers in human CRC.
a Unsupervised clustering analysis and Pearson correlation heatmap of H3K27ac ChIP-seq data for the 33,131 ChromHMM-defined active enhancers clearly distinguish patient-derived organoids (PDOs) from normal colon tissues. b Volcano plot of differentially enriched enhancer regions between PDOs and normal colon mucosa. Dotted lines indicate thresholds for two-sided adjusted P-value < 0.01 and |log2 fold-change > 2 (Wald test with Benjamini–Hochberg false discovery rate correction). c Percentage of gained enhancers shared by different PDOs (see Supplementary Fig. 4b, c). de Representative tracks of H3K27ac and ChromHMM profiles, illustrating examples of gained (d) and lost (e) enhancer regions in PDOs compared to normal colon mucosa. Shaded boxes indicate the presence or absence of H3K27ac peaks. Interactions between gained enhancers and promoter regions based on chromosome conformation capture (capture Hi-C) data on human colon cancer are shown below the graph. f The Hippo signaling pathway is the most significantly enriched pathway related to the gained enhancer-associated genes that are upregulated in PDOs compared to normal tissues. The size of the circles corresponds to the number of gained-enhancer associated genes present in the geneset of a particular KEGG pathway (Gene Ratio). The dotted line indicates the threshold for significantly enriched pathways based on a two-sided Fisher’s exact test with a false discovery rate (FDR) < 0.05. g Visualization of pathway network for tumor-upregulated genes annotated to gained enhancers based on functional enrichment analysis. Pathway terms are represented by circles, the size of which is proportional to the number of genes. The circles are colored according to the enrichment P-value based on a two-sided Fisher’s exact test.
Fig. 4
Fig. 4. YAP/TAZ regulates the conserved human CRC enhancerome.
a YAP and TAZ are transcriptionally upregulated in primary tumors (n = 10) and patient-derived organoids (PDOs n = 10) compared to normal colon tissues (n = 9). Violin plots of log2 normalized gene counts. **P < 0.01, ***P < 0.001, two-sided Wilcoxon rank sum exact test. b Representative immunohistochemistry images with insets showing YAP/TAZ nuclear localization in tumor tissues (middle) and PDOs (bottom) compared to normal mucosa (top). Scale bars, 50 µm, magnification ×40. c Relative distribution of TAZ peaks around ChromHMM-defined active enhancers (n = 33,131, yellow) and promoters (red). d Genomic overview of YAP/TAZ canonical targets showing H3K4me3, H3K27ac, H3K4me1, TAZ profiles, and ChromHMM states (see Supplementary Fig. 5b and Fig. 2c, e for details on ChromHMM tracks). e TEAD binding motif enrichment around the summit of TAZ peaks. f Distribution of TAZ peaks across ChromHMM-defined functional elements. g TAZ enrichment in human CRC gained enhancers (G.E.) increases with the level of enhancer conservation across PDOs. The bar plots show the percentage of enhancers in each G.E. subset that overlap a TAZ peak or the percentage (mean ± s.d.) of TAZ-bound regions in 1000 random sets generated for each G.E. subsets: (i) all G.E., (ii) G.E. conserved in >5 patients, and (iii) G.E. conserved in >8 patients (see “Methods”). ***P < 0.001, one-sided empirical P-value. h TAZ genomic overview showing H3K4me3, H3K27ac, H3K4me1, and TAZ profiles, RNA-seq signals, ChromHMM states, and capture Hi-C promoter-enhancer interactions. i YAP/TAZ-inhibition affects patient-derived tumor organoid growth. Representative images of fully formed normal (left) and tumor (right) organoids cultured for 48 h following treatment with 1 μM of verteporfin (VP; top) or DMSO (bottom). Scale bar: 100 μm, magnification ×10. j VP treatment significantly reduces cell viability in tumor compared to normal PDOs. Viability was assessed by flow cytometry 48 h after exposure and normalized to DMSO (mean ± s.d., n: Normal = 3 and Tumor = 6 independent CRC patients; see Supplementary Fig. 5g). *P = 0.012, one-sided Mann–Whitney U exact test.
Fig. 5
Fig. 5. Conserved human CRC enhancer regions are accessible across diverse cancer types.
a Chromatin accessibility profiles of the 195 conserved gained enhancers in 23 diverse primary human cancer types reveal a signature of 46 pan-CRC enhancers with active chromatin profiles across cancer types (cluster in purple). The heatmap shows hierarchical clustering of log2 normalized insertion counts of ATAC-seq data derived from TCGA (Corces et al.). Colon adenocarcinoma samples are the first cancer type reported on the left of the heatmap. The color-coded bar above the heatmap represents the different cancer types: ACC adrenocortical carcinoma, BLCA bladder urothelial carcinoma, BRCA breast invasive carcinoma, CESC cervical squamous cell carcinoma, and endocervical adenocarcinoma, CHOL cholangiocarcinoma, COAD colon adenocarcinoma, ESCA esophageal carcinoma, GBM glioblastoma multiforme, HNSC head and neck squamous cell carcinoma, KIRC kidney renal clear cell carcinoma, KIRP kidney renal papillary cell carcinoma, LGG brain lower grade glioma, LIHC liver hepatocellular carcinoma, LUAD lung adenocarcinoma, LUSC lung squamous cell carcinoma, MESO mesothelioma, PCPG pheochromocytoma and paraganglioma, PRAD prostate adenocarcinoma, SKCM skin cutaneous melanoma, STAD stomach adenocarcinoma, TGCT testicular germ cell tumors, THCA thyroid carcinoma, UCEC uterine corpus endometrial carcinoma. b Differences in the H3K27ac intensities of the pan-cancer enhancers in primary tumors (n = 28) relative to normal tissues (n = 15) from public ChIP-seq data. Boxplots describe the median (middle line) and interquartile range (box denoting first and third percentile) with whiskers denoting the minimum and maximum within the 1.5× interquartile range and outlying points beyond the whiskers plotted individually. ****P < 0.0001, two-sided Wilcoxon rank sum exact test. c Genomic overview of the TAZ locus in representative normal tissue and patient-derived organoid (PDO) samples, and in TCGA cancer types. Upper panel: H3K27ac profiles, ChromHMM states and RNA-seq signals in normal tissue; H3K27ac and TAZ profiles, ChromHMM states, and RNA-seq signals in PDO; and CRC capture Hi-C data. Bottom panel: ATAC-seq profiles for 23 TCGA cancer types. The shaded box indicates a CRC-conserved and YAP/TAZ-bound ChromHMM-defined active enhancer for which a promoter-enhancer interaction is reported using CRC capture Hi-C data. See Fig. 2c, e for details on ChromHMM tracks.
Fig. 6
Fig. 6. Distribution of cancer epigenetic deregulation at single-cell level.
a t-distributed stochastic neighbor embedding (t-SNE) visualization depicting the major cell types identified in scRNA-seq data of primary tumor and normal tissues from 23 CRC patients. b t-SNE visualization of the CRB scores across all cell populations. c Malignant cells display significantly higher CRB scores. Distribution of the CRB score in the malignant (gray; n = 17,469) and non-malignant epithelial clusters (green; n = 1070), and in all other major cell populations (B cells n = 9146; Mast cells n = 187; Myeloid cells n = 6769; Stromal cells n = 5933; T cells n = 23,115). Boxplots describe the median (middle line) and interquartile range (box denoting first and third percentile) with whiskers denoting the minimum and maximum within the 1.5× interquartile range. ****P < 0.0001, two-sided Mann–Whitney U test. de t-SNE representation of the CRB (d) and stemness (e) scores across 18,539 epithelial cells. Contour lines denote normal epithelial cells. f The cancer regulatory blueprint does not relate to stemness. t-SNE representation of the difference between the CRB and stemness score across all epithelial cells. Cells depicted in gray display similar levels of the two scores, whereas cells in purple and green display mutually exclusive high levels of CRB or stemness, respectively. Contour lines denote normal epithelial cells.

References

    1. Ferlay J, et al. Cancer incidence and mortality worldwide: sources, methods and major patterns in GLOBOCAN 2012. Int J. Cancer. 2015;136:E359–E386. doi: 10.1002/ijc.29210. - DOI - PubMed
    1. Guinney J, et al. The consensus molecular subtypes of colorectal cancer. Nat. Med. 2015;21:1350–1356. doi: 10.1038/nm.3967. - DOI - PMC - PubMed
    1. Isella C, et al. Selective analysis of cancer-cell intrinsic transcriptional traits defines novel clinically relevant subtypes of colorectal cancer. Nat. Commun. 2017;8:15107. doi: 10.1038/ncomms15107. - DOI - PMC - PubMed
    1. Flavahan, W. A., Gaskell, E. & Bernstein, B. E. Epigenetic plasticity and the hallmarks of cancer. Science357, eaal2380 (2017). - PMC - PubMed
    1. You JS, Jones PA. Cancer genetics and epigenetics: two sides of the same coin? Cancer Cell. 2012;22:9–20. doi: 10.1016/j.ccr.2012.06.008. - DOI - PMC - PubMed

Publication types

Substances