. 2021 Apr 20;7(1):38.
doi: 10.1038/s41522-021-00207-6.

Seasonal dynamics of diet-gut microbiota interaction in adaptation of yaks to life at high altitude

Affiliations

Seasonal dynamics of diet-gut microbiota interaction in adaptation of yaks to life at high altitude

Na Guo et al. NPJ Biofilms Microbiomes. .

Abstract

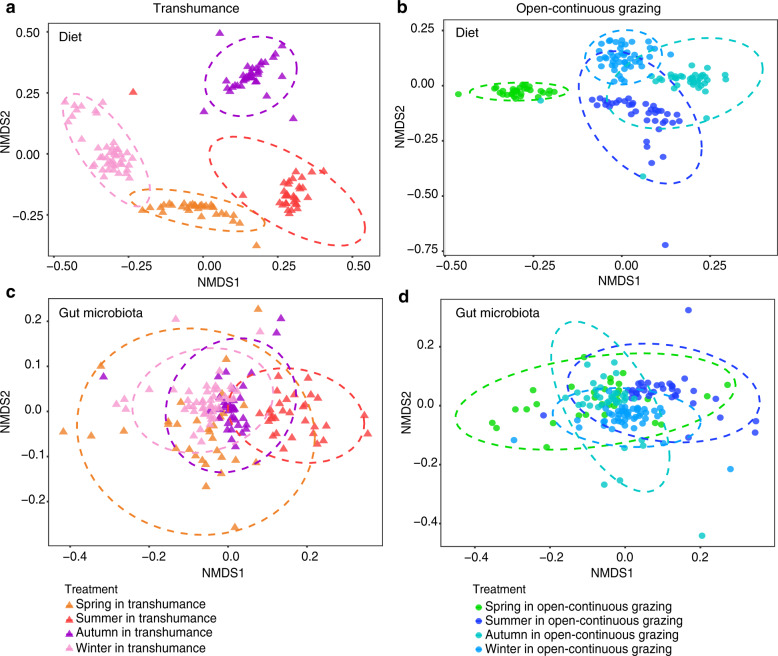
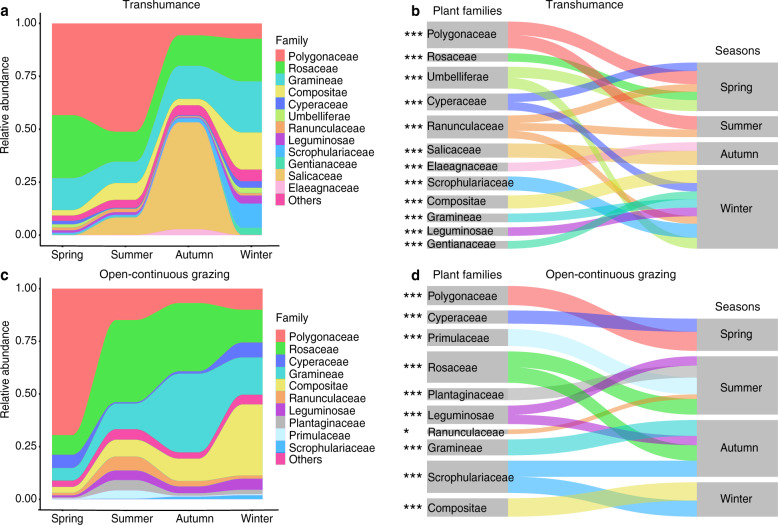
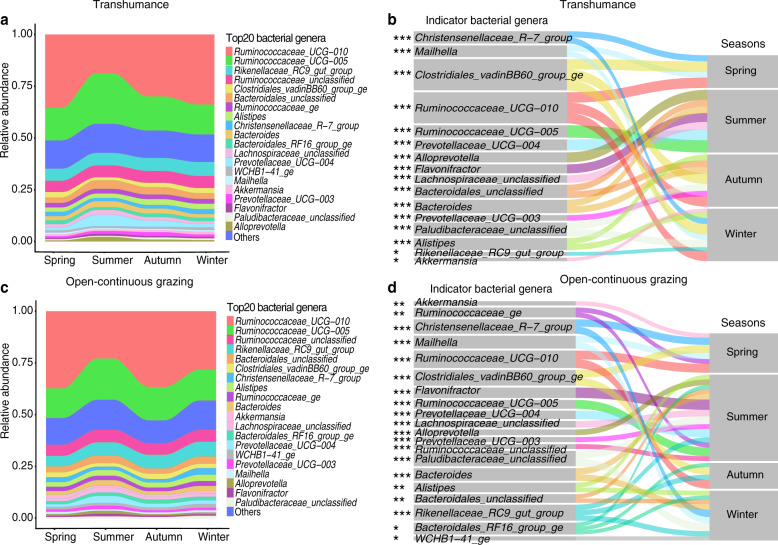
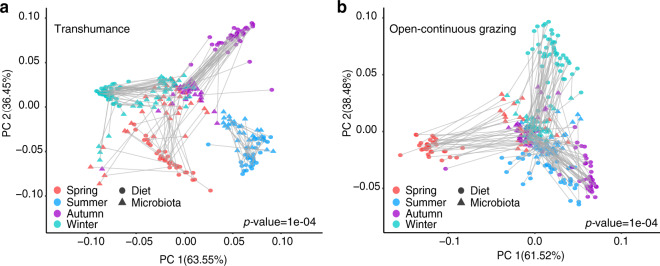
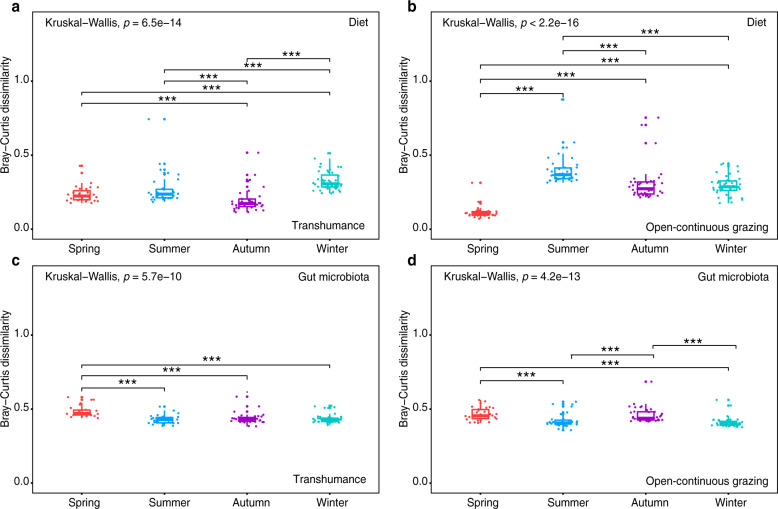
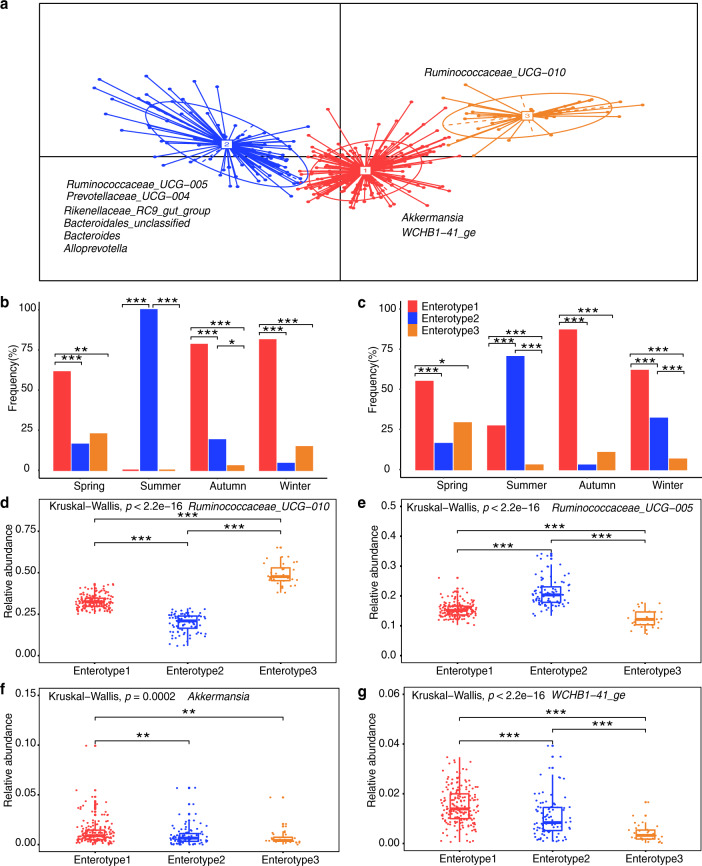
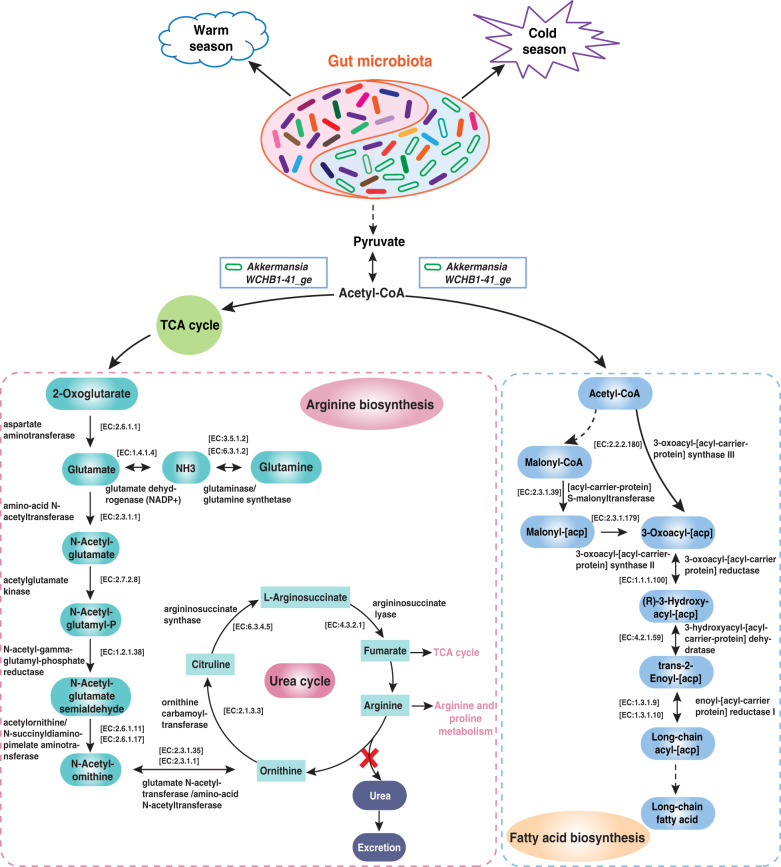
Dietary selection and intake affect the survival and health of mammals under extreme environmental conditions. It has been suggested that dietary composition is a key driver of gut microbiota variation; however, how gut microbiota respond to seasonal dietary changes under extreme natural conditions remains poorly understood. Sequencing plant trnL (UAA) region and 16S rRNA gene analysis were employed to determine dietary composition and gut microbiota in freely grazing yaks on the Tibetan plateau. Dietary composition was more diverse in winter than in summer, while Gramineae and Rosaceae were consumed frequently all year. Turnover of seasonal diet and gut microbiota composition occurred consistently. Yaks shifted enterotypes in response to dietary change between warm and cold seasons to best utilize nitrogen and energy, in particular in the harsh cold season. Our findings provide insights into understanding seasonal changes of diet-microbiota linkages in the adaptation of mammals to high altitudes.


Conflict of interest statement

The authors declare no competing interests.

Figures

Fig. 1
Fig. 1. Seasonal changes in both diet and gut microbiota community structures of yaks in transhumance and open-continuous grazing regimes.
Within and among seasons, Bray–Curtis dissimilarity in diet and microbiota are presented in Supplementary Table 2. Rows show the same ordinations for diet (a and b) and microbiota (c and d) compositions. Diet composition and gut microbiota represent transhumance (a and c) and open-continuous grazing (b and d) regimes. Individual yak diet compositions from samples collected in (a) spring (n = 32), summer (n = 33), autumn (n = 37), and winter (n = 45) in transhumance grassland (anosim analysis: R = 0.94, p = 0.0001; adonis analysis: R2 = 0.78, p = 0.0001), (b) spring (n = 31), summer (n = 39), autumn (n = 38), and winter (n = 47) in open-continuous grazing grassland (anosim analysis: R = 0.88, p = 0.0001; adonis analysis: R2 = 0.67, p < 0.0001), and gut microbiota compositions in (c) spring (n = 31), summer (n = 31), autumn (n = 37) and winter (n = 48) in transhumance grassland (anosim analysis: R = 0.50, p < 0.0001; adonis analysis: R2 = 0.16, p < 0.0001) and (d) spring (n = 31), summer (n = 37), autumn (n = 38), winter (n = 47) in open-continuous grazing grassland (anosim analysis: R = 0.47, p < 0.0001; adonis analysis: R2 = 0.16, p < 0.0001) plotted on nonmetric multidimensional scaling (NMDS) according to the Bray–Curtis dissimilarity. Analysis of similarities (ANOSIM), adonis analysis and permutational multivariate analysis of variance (PERMANOVA) were used for statistical testing of treatment similarities. The dotted ellipse borders represent the 95% confidence interval.
Fig. 2
Fig. 2. Seasonal changes of dietary compositions of yaks in transhumance and open-continuous grazing regimes.
Stream-graph displays the relative abundance of plant family-level taxa in spring, summer, autumn, and winter in transhumance (a) and open-continuous grazing (c) regimes. Low abundance taxa (<5%) are grouped together as “others”. Indicator families that are related to each season are tracked using Sankey plots in transhumance (b) and open-continuous grazing (d) regimes. Lines represent associations between indicator families and seasons, which are colored by plant family. Line width is scaled to reflect indicator value (higher indicator value of family is more strongly associated with season). Indicator values are presented in Supplementary Fig. 7. The statistical p values mean the family associated with seasons, *p < 0.05, **p < 0.01, ***p < 0.001.
Fig. 3
Fig. 3. Seasonal dynamics in above-ground biomass (AGB) and chemical composition (dry matter basis) of the diets year-round in the open-continuous grazing grassland.
a Line chart represents the AGB (kg DM/ha). The dashed line is the mean AGB year-round. b Line chart represents chemical composition (crude protein (CP), ether extract (EE), acid detergent fiber (NDF), and neutral detergent fiber (ADF)) of diet year-round. The dashed lines are the mean of each chemical composition year-round and are colored by each chemical composition. Values and error bars are shown as means ± SE. Average contents of CP are correlated negatively with those of NDF (R2 = 0.59, p < 0.001) (c) and ADF (R2 = 0.78, p < 0.001) (d). Statistic tests are performed by the t-test with FDR (false discovery rate) corrected p-value, *p < 0.05, **p < 0.01, ***p < 0.001.
Fig. 4
Fig. 4. Seasonal variations of yak gut microbiota at the genus level in transhumance and open-continuous grazing regimes.
Relative abundance of the 20 most abundant genera over seasons (spring, summer, autumn, and winter) are aggregated and colored on a stream-graph in (a) transhumance and (c) open-continuous grazing regimes. Low abundance taxa (except for 20 most abundant genera) are grouped together as “others”. Indicator genera that are related to each season are tracked using Sankey plots in transhumance (b) and open-continuous grazing (d) regimes. Lines represent associations between indicator genera and seasons, which are colored by genus level. Line width is scaled to reflect indicator value (higher indicator value of genus is more strongly associated with the season). Indicator value are shown in Supplementary Fig. 7. The statistical p values mean the genus associated with seasons. *p < 0.05, **p < 0.01, ***p < 0.001.
Fig. 5
Fig. 5. Seasonal clustering patterns in diet–microbiota lineages of yak in transhumance and open-continuous grazing regimes.
The diet and microbiota compositions are determined with Bray–Curtis distance in (a) transhumance and (b) open-continuous grazing regimes, which are colored by season. Procrustes rotates the results of separate principal coordinates of diet composition (circle symbols) and gut microbiota composition (triangle symbols). Significant dissimilarities occurred between diet and microbiota ordinations by p-value.
Fig. 6
Fig. 6. Bray–Curtis dissimilarities within seasons in dietary diversity and gut microbial diversity across seasons in transhumance and open-continuous grazing regimes.
Rows show the dissimilarities for diet (a and b) and gut microbiota (c and d) within seasons. Each column organizes the data so that diet and gut microbiota Bray–Curtis dissimilarities represent transhumance (a, c) and open-continuous grazing (b, d) regimes. All boxplot distributions are tested by non-parametric Kruskal–Wallis and Wilcoxon with FDR (false discovery rate) corrected p-value, center values indicate the median and error bars. *p < 0.05, **p < 0.01, ***p < 0.001.
Fig. 7
Fig. 7. Enterotype distributions of yak gut microbiota associated with season using Bray–Curtis dissimilarity.
Identification of yak enterotypes is presented in Supplementary Fig. 9. a Visualizations of enterotypes, as identified by PAM (partitioning around medoid) clustering. Genera corresponding to each enterotype are identified by their relative abundance (see Supplementary Fig. 10). b and c Proportion of samples for each enterotype in spring, summer, autumn, and winter in (b) transhumance and (c) open-continuous grazing regimes. dg Relative abundance of bacterial taxa characteristic of each enterotype. Ten genera were chosen based on their average contribution to overall Bray–Curtis dissimilarity. All six bacterial genera are presented in Supplementary Fig. 10. Colors correspond to enterotype clusters. All bar distributions are tested by Fisher’s exact test with FDR (false discovery rate) corrected two-tailed p-values (b and c). All boxplot distributions are tested by non-parametric Kruskal–Wallis and Wilcoxon with FDR-corrected p-value, center values indicated the median and error bars (dg). *p < 0.05, **p < 0.01, ***p < 0.001.
Fig. 8
Fig. 8. Metabolic pathway associated with Akkermansis and uncultured Eubacterium WCHB1-41_ge on host metabolism.
The compositions of Akkermansis and uncultured Eubacterium WCHB1-41_ge are the key factors that influence arginine biosynthesis and fatty acid biosynthesis and were significantly higher during the cold season. These microbiota may contribute to energy production during cold season, which is the period of insufficient dietary and protein intake. All enzymes and EC (Enzyme Nomenclature) numbers were obtained from Kyoto Encyclopedia of Genes and Genomes (KEGG) database.

Similar articles

Cited by

References

    1. Meyer MC, et al. Permanent human occupation of the central Tibetan Plateau in the early Holocene. Science. 2017;355:64. doi: 10.1126/science.aag0357. - DOI - PubMed
    1. Qiu Q, et al. Yak whole-genome resequencing reveals domestication signatures and prehistoric population expansions. Nat. Commun. 2015;6:10283. doi: 10.1038/ncomms10283. - DOI - PMC - PubMed
    1. Qiu Q, et al. The yak genome and adaptation to life at high altitude. Nat. Genet. 2012;44:946–949. doi: 10.1038/ng.2343. - DOI - PubMed
    1. Zhang Z, et al. Convergent evolution of rumen microbiomes in high-altitude mammals. Curr. Biol. 2016;26:1873–1879. doi: 10.1016/j.cub.2016.05.012. - DOI - PubMed
    1. Johnson AJ, et al. Daily sampling reveals personalized diet–microbiome associations in humans. Cell Host Microbe. 2019;25:789–802. doi: 10.1016/j.chom.2019.05.005. - DOI - PubMed

Publication types

LinkOut - more resources