. 2021 Apr 20;11(1):8535.
doi: 10.1038/s41598-021-87769-9.

Long-term depression at hippocampal mossy fiber-CA3 synapses involves BDNF but is not mediated by p75NTR signaling

Affiliations

Long-term depression at hippocampal mossy fiber-CA3 synapses involves BDNF but is not mediated by p75NTR signaling

Machhindra Garad et al. Sci Rep. .

Abstract

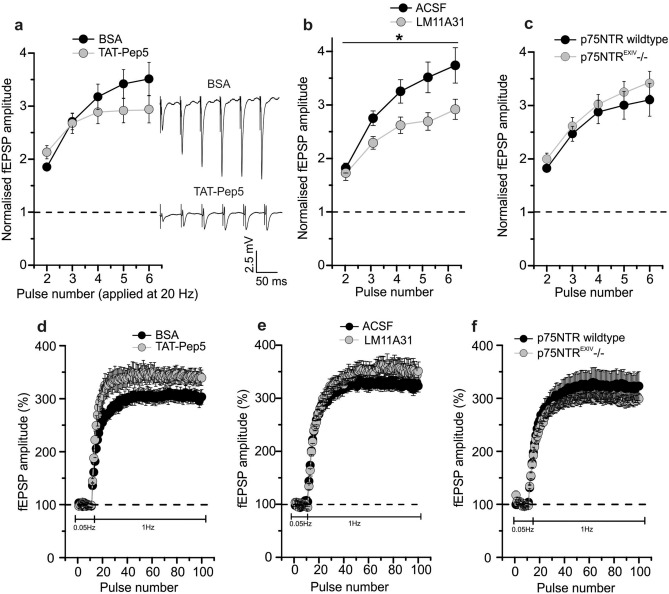
BDNF plays a crucial role in the regulation of synaptic plasticity. It is synthesized as a precursor (proBDNF) that can be proteolytically cleaved to mature BDNF (mBDNF). Previous studies revealed a bidirectional mode of BDNF actions, where long-term potentiation (LTP) was mediated by mBDNF through tropomyosin related kinase (Trk) B receptors whereas long-term depression (LTD) depended on proBDNF/p75 neurotrophin receptor (p75NTR) signaling. While most experimental evidence for this BDNF dependence of synaptic plasticity in the hippocampus was derived from Schaffer collateral (SC)-CA1 synapses, much less is known about the mechanisms of synaptic plasticity, in particular LTD, at hippocampal mossy fiber (MF) synapses onto CA3 neurons. Since proBDNF and mBDNF are expressed most abundantly at MF-CA3 synapses in the rodent brain and we had shown previously that MF-LTP depends on mBDNF/TrkB signaling, we now explored the role of proBDNF/p75NTR signaling in MF-LTD. Our results show that neither acute nor chronic inhibition of p75NTR signaling impairs MF-LTD, while short-term plasticity, in particular paired-pulse facilitation, at MF-CA3 synapses is affected by a lack of functional p75NTR signaling. Furthermore, MF-CA3 synapses showed normal LTD upon acute inhibition of TrkB receptor signaling. Nonetheless, acute inhibition of plasminogen activator inhibitor-1 (PAI-1), an inhibitor of both intracellular and extracellular proBDNF cleavage, impaired MF-LTD. This seems to indicate that LTD at MF-CA3 synapses involves BDNF, however, MF-LTD does not depend on p75NTRs. Altogether, our experiments demonstrate that p75NTR signaling is not warranted for all glutamatergic synapses but rather needs to be checked separately for every synaptic connection.


Conflict of interest statement

The authors declare no competing interests.

Figures

Figure 1
Figure 1
Mossy fiber (MF)-CA3 synapses show BDNF-dependent LTD, frequency facilitation and paired-pulse facilitation. (a) LTD magnitude at MF-CA3 synapses induced by low frequency stimulation (LFS, 900 pulses, 1 Hz) was similar to AC synapses (filled circle: MF (n = 16/N = 12); open circle: AC fibers (n = 10/N = 7)). Representative averaged original responses are shown for both, MF and AC fiber LTD. In the graph, “1” depicts mean fEPSP amplitudes of first 10 min of baseline and “2” indicates mean fEPSP amplitudes between 55 and 60 min after induction of LTD. (b) LTD at MF-CA3 synapses is significantly impaired in the presence of tiplaxtinin (150 µM; an inhibitor of plasminogen activator inhibitor-1) in comparison to DMSO treated control (filled circle: DMSO (n = 8/N = 6); filled gray circle:Tiplaxtinin (n = 8/N = 6). The inset shows representative averaged original fEPSP responses. For MF-LTD in DMSO and in the presence of tiplaxtinin, “1” depicts mean fEPSP amplitudes of first 10 min of baseline and “2” depict mean fEPSP amplitudes between 55 and 60 min after induction of LTD. (c) and (e) Tiplaxtinin treated slices showed significantly decreased frequency facilitation (c) and paired-pulse facilitation (e) at MF-CA3 synapses (filled circle: DMSO (n = 9/N = 7); filled gray circle:Tiplaxtinin (n = 9/N = 7). (d) and (f) Input–output curve of basal synaptic responses (c; filled circle: DMSO (n = 7/N = 5); filled gray circle: Tiplaxtinin (n = 9/N = 7)) and train facilitation (e; filled circle: DMSO (n = 9/N = 7); filled gray circle: Tiplaxtinin (n = 9/N = 7)) at MF synapses exhibited no change in presence of tiplaxtinin compared to DMSO control. Data shown as mean ± SEM. Scale bars are exhibited in the inset. *p < 0.05 (two-tailed Student’s t-test, Mann–Whitney U-test or ANOVA).
Figure 2
Figure 2
LTD at MF synapses is not mediated via p75NTR or TrkB receptor signaling. (a), (c) and (d) MF LTD is not impaired in the presence of bath applied TAT-Pep5 (1 µM, a), LM11A31 (100 nM, c) or K252a (200 nM, d) in comparison to the respective solvent controls (filled circle: BSA (a, n = 8/N = 6), ACSF (c, n = 16/N = 12) and DMSO (d, n = 12/N = 6); filled gray circle: TAT-Pep5 (a, n = 11/N = 10), LM11A31 (c, n = 11/N = 6) and K252a (d, n = 9/N = 5)). b) Recordings in slices of p75NTREXIV−/− mice displayed no influence of p75NTR chronic deficiency on LTD magnitudes at MF synapses (filled circle: p75NTR wildtype (n = 8/N = 5); filled gray circle: p75NTREXIV−/− (n = 12/N = 7)). (e) Unaltered MF LTD in the presence of bath applied ANA-12 (20 µM), in comparison to the respective solvent control (filled circle: DMSO (n = 16/N = 11); filled gray circle: ANA-12 (e, n = 11/N = 6). The figure insets show representative averaged original fEPSP traces. For all MF-LTD experiments, “1” indicates mean fEPSP amplitudes of first 10 min of baseline and “2” depicts mean fEPSP amplitudes between 55 and 60 min after induction of LTD. Data expressed as mean ± SEM. Corresponding scale bars are shown as insets.
Figure 3
Figure 3
Paired-pulse LFS induced LTD at MF-CA3 synapses is also independent of p75NTR signaling. (a) Paired-pulse (pp) LFS induced significant LTD at MF synapses (filled circle: ppLFS (n = 10/N = 7)). The inset shows representative averaged original fEPSP responses. For MF-LTD, “1” depicts mean fEPSP amplitudes of first 10 min of baseline, “2” depict mean fEPSP amplitudes between 55 and 60 min after induction of LTD, and “3” shows mean fEPSP amplitude after DCG-IV incubation to verify pure MF origin. (b) MF-CA3 synapses exhibited comparable LTD magnitude in presence of TAT-Pep5 (1 µM; p75NTR inhibitor) compared to BSA control (filled circle: BSA (n = 8/N = 5); filled gray circle: TAT-Pep5 (n = 10/N = 5)). The inset shows representative averaged original fEPSP responses. For MF-LTD in BSA and in the presence of TAT-Pep5, “1” depicts mean fEPSP amplitudes of first 10 min of baseline and “2” depict mean fEPSP amplitudes between 55 and 60 min after induction of LTD. Data shown as mean ± SEM. Corresponding scale bars are shown as insets. *p < 0.05 (1-sample Student’s t-test or two-tailed Student’s t-test).
Figure 4
Figure 4
Influence of acute or chronic inhibition of p75NTR signaling on basal synaptic responses and short-term synaptic plasticity at hippocampal mossy fiber synapses. (a) and (b) input–output (IO) curve in the presence of 1 µM TAT-Pep5 (a) or 100 nM LM11A31 (b) for acute inhibition or modulation of MF-transmission. (c) IO curve in p75NTREXIV−/− mice (chronic inhibition). (d) and (e) paired-pulse facilitation (PPF) at different inter-stimulus intervals of (20, 50, 100 and 200 ms) in the presence of TAT-Pep5 (d) or LM11A31 (e). The inset displays representative averaged original responses for PPF at an ISI of 20 ms for BSA and TAT-Pep5. Scale bars are shown in the inset. (f) PPF in p75NTREXIV−/− mice. Data expressed as mean ± SEM. *p < 0.05 (ANOVA).
Figure 5
Figure 5
Effect of acute or chronic inhibition of p75NTR signaling on longer lasting short-term synaptic plasticity properties at hippocampal mossy fiber-CA3 synapses. (a) and (b) extended paired-pulse facilitation paradigm (i.e. train facilitation at 20 Hz) in the presence of bath applied 1 µM TAT-Pep5 (a) and 100 nM LM11A31 (b) compared to solvent controls. Representative averaged original responses are exhibited for train facilitation in presence of BSA and TAT-Pep5 in the ACSF. Scale bars are displayed in the inset. (c) Train facilitation in p75NTREXIV−/− mice compared to wildtype littermates. (d) and (e) frequency facilitation at 1 Hz in presence of TAT-Pep5 (d) and LM11A31 (e). (f) Frequency facilitation in p75NTREXIV−/− mice. Data displayed as mean ± SEM. *p < 0.05 (ANOVA, Mann–Whitney U-test or two-tailed Student’s t-test).

References

    1. Lessmann V, Gottmann K, Malcangio M. Neurotrophin secretion: current facts and future prospects. Prog. Neurobiol. 2003;69:341–374. doi: 10.1016/S0301-0082(03)00019-4. - DOI - PubMed
    1. Mowla SJ, et al. Biosynthesis and post-translational processing of the precursor to brain-derived neurotrophic factor. J. Biol. Chem. 2001;276:12660–12666. doi: 10.1074/jbc.M008104200. - DOI - PubMed
    1. Brigadski T, Leßmann V. The physiology of regulated BDNF release. Cell Tissue Res. 2020;382:15–45. doi: 10.1007/s00441-020-03253-2. - DOI - PMC - PubMed
    1. Mowla SJ, et al. Differential sorting of nerve growth factor and brain-derived neurotrophic factor in hippocampal neurons. J. Neurosci. 1999;19:2069–2080. doi: 10.1523/JNEUROSCI.19-06-02069.1999. - DOI - PMC - PubMed
    1. Lee R, Kermani P, Teng KK, Hempstead BL. Regulation of cell survival by secreted proneurotrophins. Science. 2001;294:1945–1948. doi: 10.1126/science.1065057. - DOI - PubMed

Publication types

MeSH terms