. 2021 Sep;28(9):2765-2777.
doi: 10.1038/s41418-021-00782-3. Epub 2021 Apr 20.

SARS-CoV-2 spike protein dictates syncytium-mediated lymphocyte elimination

Affiliations

SARS-CoV-2 spike protein dictates syncytium-mediated lymphocyte elimination

Zhengrong Zhang et al. Cell Death Differ. 2021 Sep.

Abstract

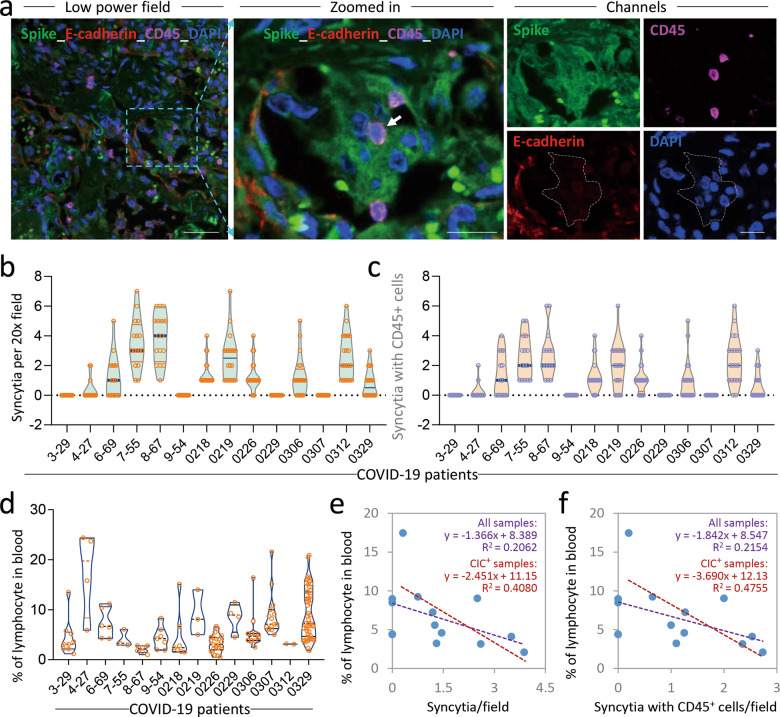
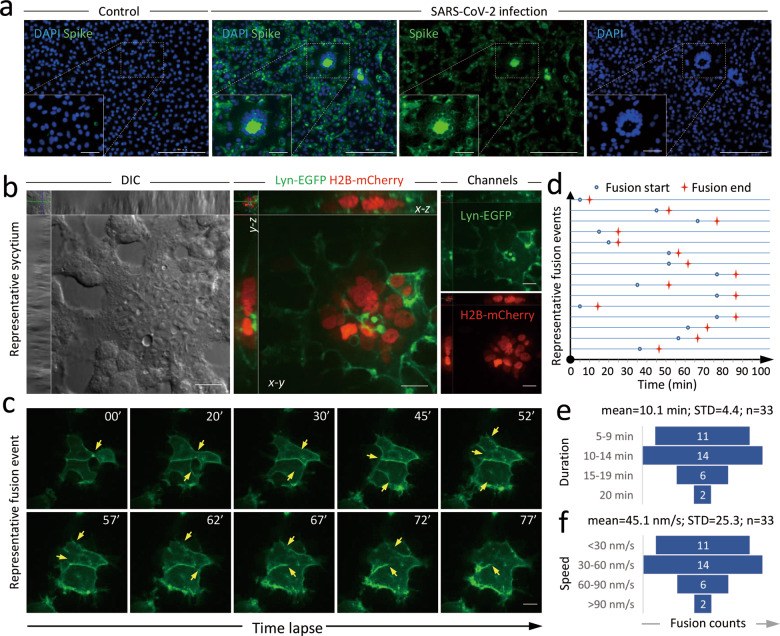
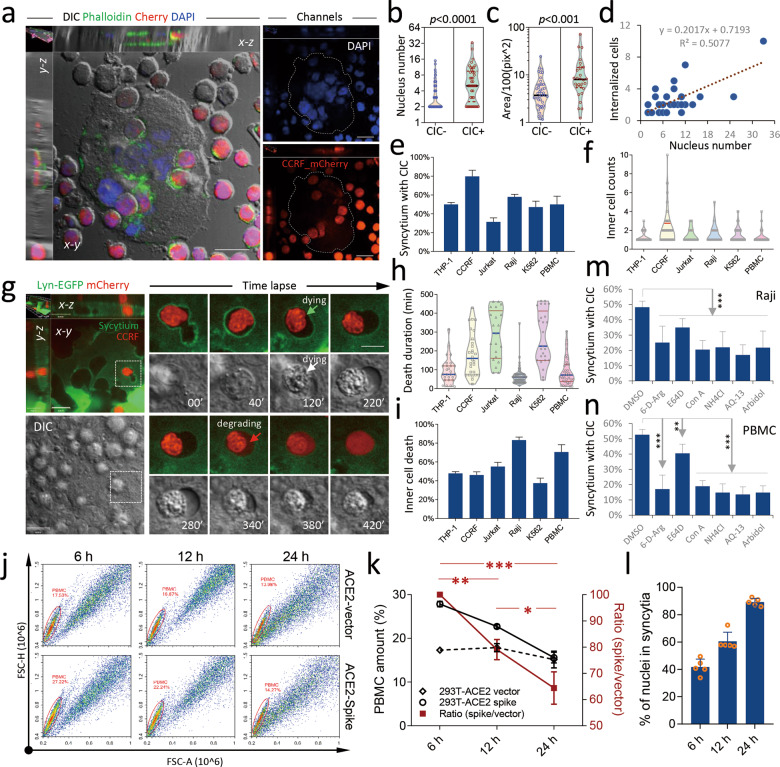
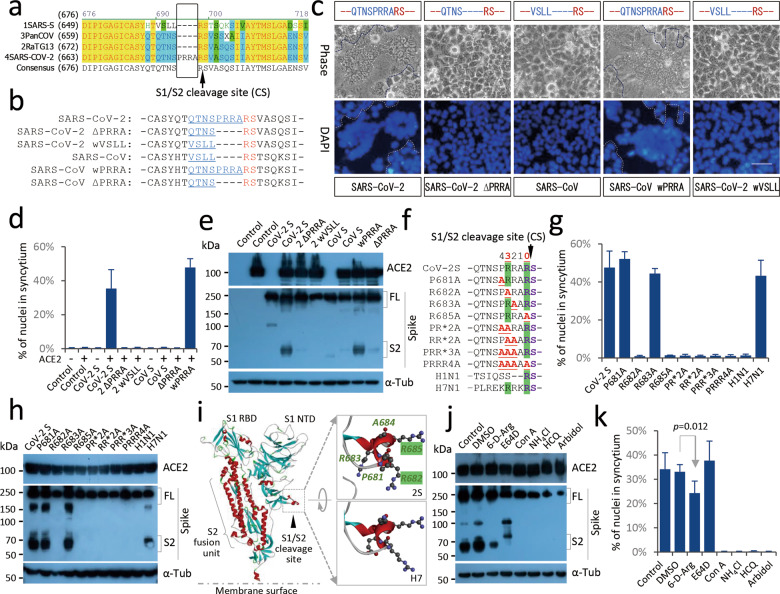
The severe acute respiratory syndrome coronavirus 2 (SARS-CoV-2) virus is highly contagious and causes lymphocytopenia, but the underlying mechanisms are poorly understood. We demonstrate here that heterotypic cell-in-cell structures with lymphocytes inside multinucleate syncytia are prevalent in the lung tissues of coronavirus disease 2019 (COVID-19) patients. These unique cellular structures are a direct result of SARS-CoV-2 infection, as the expression of the SARS-CoV-2 spike glycoprotein is sufficient to induce a rapid (~45.1 nm/s) membrane fusion to produce syncytium, which could readily internalize multiple lines of lymphocytes to form typical cell-in-cell structures, remarkably leading to the death of internalized cells. This membrane fusion is dictated by a bi-arginine motif within the polybasic S1/S2 cleavage site, which is frequently present in the surface glycoprotein of most highly contagious viruses. Moreover, candidate anti-viral drugs could efficiently inhibit spike glycoprotein processing, membrane fusion, and cell-in-cell formation. Together, we delineate a molecular and cellular rationale for SARS-CoV-2 pathogenesis and identify novel targets for COVID-19 therapy.


Conflict of interest statement

The authors declare no competing interests.

Figures

Fig. 1
Fig. 1. Cell-in-cell structures in lung autopsies of patients with COVID-19.
a Representative images of a syncytium with CD45-positive cell internalized (indicated by white arrow) in a human COVID-19 lung specimen. White dashed lines depict shape of target syncytium. Tissue was stained with antibodies against SARS-CoV-2 S protein in green, E-cadherin in red and CD45 in magenta. Scale bars: 50 μm for the left image, 20 μm for zoomed images in the middle and multi-channel images on the right. Quantification of syncytia formation (b), and syncytia internalizing CD45-positive cells (c) in the lung specimens of patients with COVID-19. In total, more than 16 fields of view with a 20x objective lens per specimen were analyzed. d The percentage of lymphocytes in peripherial blood of COVID-19 patients during hospitalization. The peripherial lymphocytes were negatively associated with syncytia number (e) and cell-in-cell structures with CD45+ cells internalized by syncytia (f) in the lung tissues of patients with COVID-19. The purple liner trendlines were predicted based on data from all examined samples (n = 14); the red liner trendlines were predicted based on data from samples with cell-in-cell structures (CIC+) (n = 10).
Fig. 2
Fig. 2. Expression of SARS-CoV-2 spike protein induces rapid membrane fusion.
a Representative images of syncytia formation in Vero-ACE2 cells upon SARS-CoV-2 infection. Cells were stained with anti-SARS-CoV-2 S antibody in green. Control: no infection. Scale bars: 50 μm for the inserts in the lower left corner; 200 μm for full images. b Representative images of a syncytium formed in 293T-ACE2 cells expressing exogenous SARS-CoV-2 spike glycoprotein, Lyn-EGFP (cell membrane, green), and H2B-mCherry (nucleus, red). Scale bars: 20 μm. c Image sequence showing dynamic membrane fusion, indicated by the disappearance of Lyn-EGFP signal, in 293T-ACE2 cells expressing exogenous SARS-CoV-2 spike protein. Yellow arrows indicate sites where fusion is taking place. Scale bar: 20 μm. Related to Supplementary Movie S1. d Timeline graph showing representative fusion events. Each blue line indicates one fusion event. Blue circles indicate the beginning of membrane fusion. Red stars indicate the completion of membrane fusion. Quantification of the duration (e) and the speed (f) of membrane fusion induced by SARS-CoV-2 spike protein expression.
Fig. 3
Fig. 3. Syncytia internalize lymphocytes for cell-in-cell mediated death.
a Representative images of a syncytium internalizing CCRF-mCherry cells to form cell-in-cell structures. Cells were stained with Phalloidin (green) and DAPI (blue). Scale bar: 20 μm. Graph plots of nuclei number (b) and area (c) of syncytia that internalizing CCRF-mCherry cells (CIC+, n = 41) or not (CIC−, n = 75). d Positive correlation between the nucleus number of syncytia and internalized CCRF-mCherry number. Analysis was performed by Spearman rank correlation. n = 41. Quantification of the formation frequency (e) and internalized cells (f) in cell-in-cell structures formed between syncytia and indicated cells. Data represent the mean ± SD of 10 or more fields with more than 100 syncytia analyzed each for e. n (left to right) = 44, 51, 28, 36, 43 and 45, respectively, for f. g Representative images and image sequence for the death of an internalized CCRF-mCherry cell within a syncytium. Green arrow indicates the dying of the internalized CCRF-mCherry cell; red arrow indicates the degradation of the internalized CCRF-mCherry cell. Scale bars: 20 μm for the left images; 10 μm for the right images. Plots of the duration (h) and frequency (i) of the death of the indicated cells in syncytia. n (left to right) = 24, 28, 21, 55, 24 and 38, respectively, for h. Data are the mean ± SD from 10 or more fields with more than 50 cell-in-cell structures analyzed each for i. j Representative FCM graphs for the respective cocultures of PBMC with 293T-ACE2-vector and 293T-ACE2-spike cells for different periods as indicated. k The quantification of PBMC changes over the indicated times in co-culture experiments. j The right Y axis is for the PBMC ratio between the two co-culture experiments (293T-ACE2-vector and 293T-ACE2-spike, respectively). Data are the mean ± SD of results from triplicate experiments. **p < 0.05, **p < 0.001, ***p < 0.0001. PBMC were added into the 293T-ACE2 cells 12 h post transfection with the empry vector or spike construct, respectively. l Quantification of syncytia formation in 293T-ACE2-spike cells at the indicated time points post PBMC adding. Data are the mean ± SD of results from 5 fields (20x objective lens) each. Note: syncytia were not formed in 293T-ACE2-vector cells. The inhibitory effects of the indicated compounds on the formation of cell-in-cell structures formed between syncytia and Raji cells (m), or PBMC (n). Data are the mean ± SD from 10 or more fields with more than 100 syncytia analyzed for each field. **p < 0.001, ***p < 0.0001.
Fig. 4
Fig. 4. Membrane fusion is dictated by a bi-arginine motif preceding the S1/S2 cleavage site.
a Alignment of spike protein sequences flanking the S1/S2 cleavage site from SARS-CoV (1SARS-S), pangolin coronavirus (3PanCOV), bat coronavirus (2RaTG13), SARS-CoV-2. Arrow indicates the S1/S2 cleavage site. b The pre-cleavage sequences (in blue) for the indicated mutants. “RS” in red indicates the S1/S2 cleavage site. c Representative cropped images for cell fusion upon expression of the indicated mutants. Scale bar: 100 μm. Quantification of syncytia formation (d) upon expression of the indicated mutants as detected by western blot (e). Data are the mean ± SD of results from 4-5 fields (20x objective lens) each for d. f SARS-CoV-2 spike mutants with indicated single or combined residue replacement with “A” in red, or the sequences of the pre-cleavage motif from surface glycoprotein of H1N1 or H7N1. Arrow indicates the S1/S2 cleavage site. Green shadow indicates two critical arginine for cleavage. Quantification of the syncytia formation (g) upon expression of the indicated mutants as detected by western blot (h). Data are the mean ± SD of results from 4-5 fields (20x objective lens) each for g. i 3-dimensional structure modeling of the SARS-CoV-2 spike monomer colored by the secondary structure. The zoomed images indicate the spatial residue patterns (0–4 positions shown in f), in the style of scaled ball and stick, for the cleavage sites of SARS-CoV-2 spike (2S), or H7N1 mutant (H7). Amino acid residues were indicated in number for the upper image (2S). S1 RBD: receptor binding domain in S1 fragment; S1 NTD: N terminal domain in S1 fragment. Effects of the indicated compounds on the processing of the spike protein (j) and syncytia formation (k). Data are the mean ± SD of results from 4-5 fields (20x objective lens) each for k.
Fig. 5
Fig. 5. A working model for SARS-CoV-2-induced lymphocyte loss via syncytia-mediated cell-in-cell formation.
The infection of ACE2-expressing cells by SARS-CoV-2 virus leads to the surface expression of viral spike glycoprotein, which harbors a bi-arginine motif that is required for protease-mediated processing and controls membrane fusion. The engagement of spike protein with its receptor ACE2 triggers membrane fusion, mediated by the S2 domain of the viral spike glycoprotein, between the neighboring cells, leading to the production of multinucleated syncytium. The syncytia are capable of targeting lymphocytes for internalization and cell-in-cell mediated death, conceivably contributing to lymphopenia in COVID-19 patients.

References

    1. Zhou P, Yang XL, Wang XG, Hu B, Zhang L, Zhang W, et al. A pneumonia outbreak associated with a new coronavirus of probable bat origin. Nature. 2020;579:270–3. doi: 10.1038/s41586-020-2012-7. - DOI - PMC - PubMed
    1. Wu F, Zhao S, Yu B, Chen Y-M, Wang W, Song Z-G, et al. A new coronavirus associated with human respiratory disease in China. Nature. 2020;10.1038/s41586-020-2008-3. - PMC - PubMed
    1. Zhu N, Zhang D, Wang W, Li X, Yang B, Song J, et al. A novel coronavirus from patients with pneumonia in China, 2019. N. Engl J Med. 2020;382:727–33. doi: 10.1056/NEJMoa2001017. - DOI - PMC - PubMed
    1. Li F. Structure, function, and evolution of coronavirus spike proteins. Annu Rev Virol. 2016;3:237–61. doi: 10.1146/annurev-virology-110615-042301. - DOI - PMC - PubMed
    1. Jiang X, Zhang Z, Wang C, Ren H, Gao L, Peng H, et al. Bimodular effects of D614G mutation on the spike glycoprotein of SARS-CoV-2 enhance protein processing, membrane fusion, and viral infectivity. Signal Transduct Target Ther. 2020;5:268–71. doi: 10.1038/s41392-020-00392-4. - DOI - PMC - PubMed

Publication types

Substances