

ROS-Triggered Autophagy Is Involved in PFOS-Induced Apoptosis of Human Embryo Liver L-02 Cells
- PMID: 33880372
- PMCID: PMC8046535
- DOI: 10.1155/2021/6625952
ROS-Triggered Autophagy Is Involved in PFOS-Induced Apoptosis of Human Embryo Liver L-02 Cells
Abstract
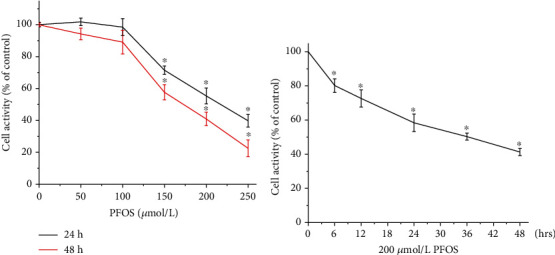
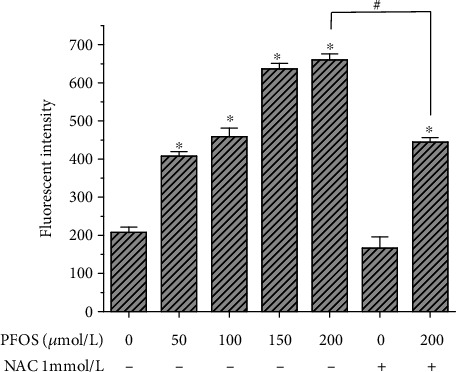
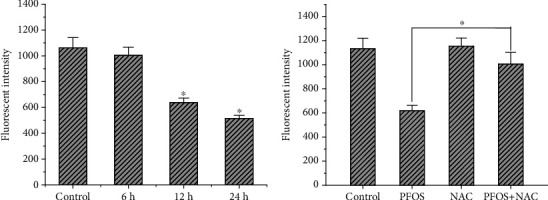
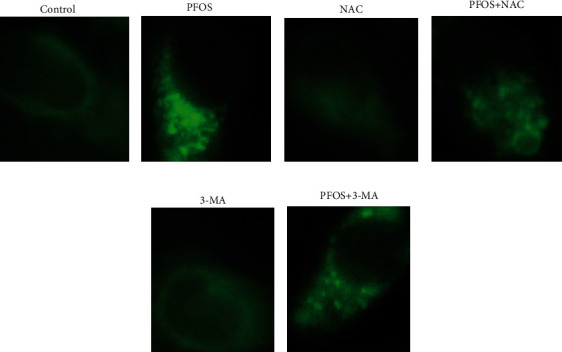
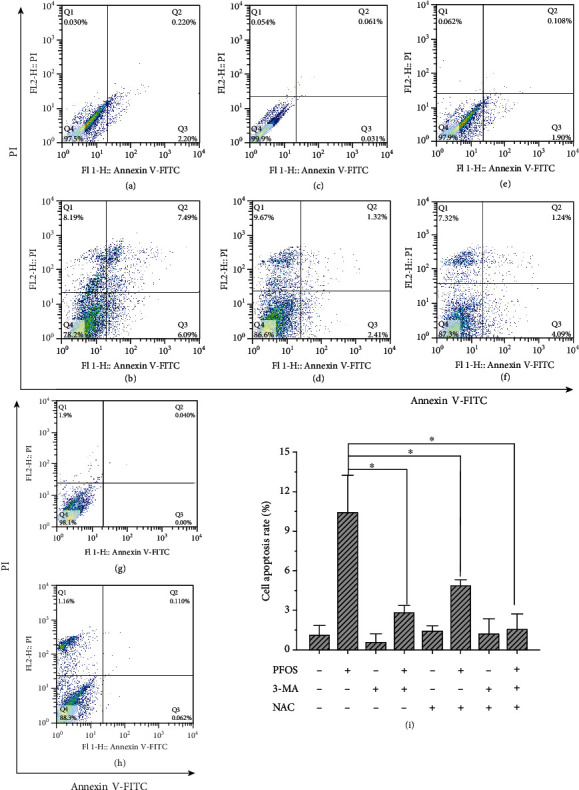
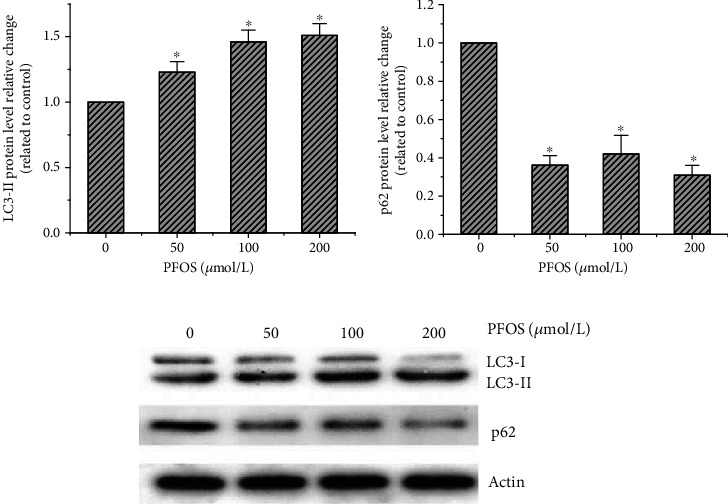
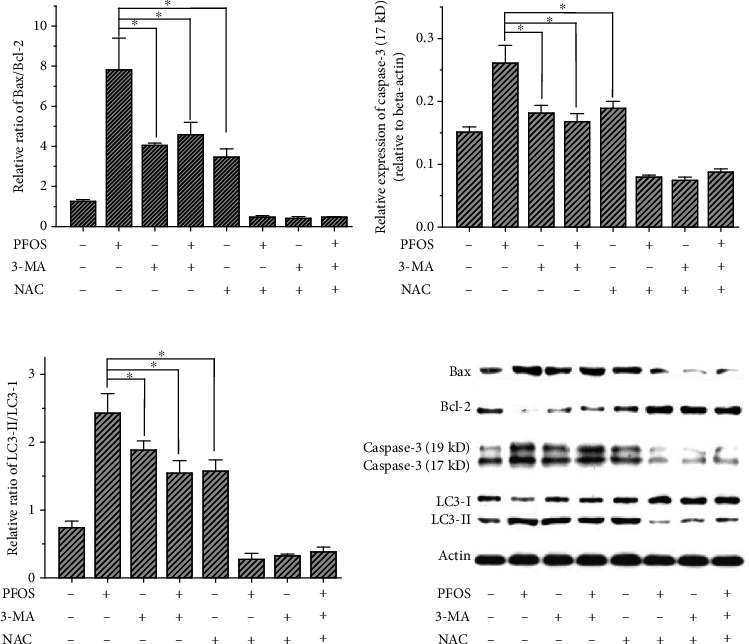
The liver is the primary target organ for perfluorooctane sulphonate (PFOS), a recently discovered persistent organic pollutant. However, the mechanisms mediating hepatotoxicity remain unclear. Herein, we explored the relationship between reactive oxygen species (ROS) and autophagy and apoptosis induced by PFOS in L-02 cells, which are incubated with different concentrations of PFOS (0, 50, 100, 150, 200, or 250 μmol/L) for 24 or 48 hrs at 37°C. The results indicated that PFOS exposure decreased cell activities, enhanced ROS levels in a concentration-dependent manner, decreased mitochondrial membrane potential (MMP), and induced autophagy and apoptosis. Compared with the control, 200 μmol/L PFOS increased ROS levels; enhanced the expression of Bax, cleaved-caspase-3, and LC3-II; induced autophagy; decreased MMP; and lowered Bcl-2, p62, and Bcl-2/Bax ratio. The antioxidant N-acetyl cysteine (NAC) protected MMP against PFOS-induced changes and diminished apoptosis and autophagy. Compared with 200 μmol/L PFOS treatment, NAC pretreatment reversed the increase in ROS, Bax, and cleaved-caspase-3 protein caused by PFOS, lowered the apoptosis rate increased by PFOS, and increased the levels of MMP and Bcl-2/Bax ratio decreased by PFOS. The autophagy inhibitor 3-methyladenine and chloroquine decreased apoptosis and cleaved-caspase-3 protein level and increased the Bcl-2/Bax ratio. In summary, our results suggest that ROS-triggered autophagy is involved in PFOS-induced apoptosis in L-02 cells.
Copyright © 2021 Huai-cai Zeng et al.
Conflict of interest statement
The authors have no conflict of interests to declare regarding the publication of this work.
Figures
Similar articles
-
Perfluorooctane sulphonate induces oxidative hepatic damage via mitochondria-dependent and NF-κB/TNF-α-mediated pathway.Chemosphere. 2018 Jan;191:1056-1064. doi: 10.1016/j.chemosphere.2017.08.070. Epub 2017 Aug 15. Chemosphere. 2018. PMID: 28939271
-
Perfluorooctane sulfonate induces hepatotoxicity through promoting inflammation, cell death and autophagy in a rat model.J Toxicol Sci. 2025;50(2):45-55. doi: 10.2131/jts.50.45. J Toxicol Sci. 2025. PMID: 39894534
-
Cucurbitacin E induces caspase-dependent apoptosis and protective autophagy mediated by ROS in lung cancer cells.Chem Biol Interact. 2016 Jun 25;253:1-9. doi: 10.1016/j.cbi.2016.04.028. Epub 2016 Apr 20. Chem Biol Interact. 2016. PMID: 27106530
-
Perfluorooctane sulfonate induces apoptosis in lung cancer A549 cells through reactive oxygen species-mediated mitochondrion-dependent pathway.J Appl Toxicol. 2013 Nov;33(11):1268-76. doi: 10.1002/jat.2785. Epub 2012 Sep 13. J Appl Toxicol. 2013. PMID: 22976841
-
PFOS-induced apoptosis through mitochondrion-dependent pathway in human-hamster hybrid cells.Mutat Res. 2013 Jun 14;754(1-2):51-7. doi: 10.1016/j.mrgentox.2013.04.004. Epub 2013 Apr 22. Mutat Res. 2013. PMID: 23618922
Cited by
-
Adverse Effects of Perfluorooctane Sulfonate on the Liver and Relevant Mechanisms.Toxics. 2022 May 19;10(5):265. doi: 10.3390/toxics10050265. Toxics. 2022. PMID: 35622678 Free PMC article. Review.
-
Research Progress on Neurodevelopmental Toxicity in Offspring after Indirect Exposure to PFASs in Early Life.Toxics. 2023 Jun 30;11(7):571. doi: 10.3390/toxics11070571. Toxics. 2023. PMID: 37505537 Free PMC article. Review.
-
Identification of Plant Peroxidases Catalyzing the Degradation of Fluorinated Aromatics Using a Peroxidase Library Approach.Eng Life Sci. 2024 Sep 17;24(11):e202400054. doi: 10.1002/elsc.202400054. eCollection 2024 Nov. Eng Life Sci. 2024. PMID: 39502856 Free PMC article.
-
PFAS Molecules: A Major Concern for the Human Health and the Environment.Toxics. 2022 Jan 18;10(2):44. doi: 10.3390/toxics10020044. Toxics. 2022. PMID: 35202231 Free PMC article. Review.
-
Maternal PFOS exposure affects offspring development in Nrf2-dependent and independent ways in zebrafish (Danio rerio).Aquat Toxicol. 2024 Jun;271:106923. doi: 10.1016/j.aquatox.2024.106923. Epub 2024 Apr 12. Aquat Toxicol. 2024. PMID: 38669778 Free PMC article.
References
MeSH terms
Substances
LinkOut - more resources
Full Text Sources
Other Literature Sources
Research Materials
