. 2021 Apr 5:2021:8873956.
doi: 10.1155/2021/8873956. eCollection 2021.

Liraglutide Regulates the Kidney and Liver in Diabetic Nephropathy Rats through the miR-34a/SIRT1 Pathway

Affiliations

Liraglutide Regulates the Kidney and Liver in Diabetic Nephropathy Rats through the miR-34a/SIRT1 Pathway

Shan Xiao et al. J Diabetes Res. .

Abstract

Purpose: To explore the regulatory effects of liraglutide on the kidney and liver through the miR-34a/SIRT1 pathway with related factors in diabetic nephropathy (DN) rats.

Methods: DN rats were randomly divided into two groups (n = 10) and were injected with liraglutide or normal saline twice a day. The 24-hour urine microalbumin content and biochemical index levels were measured. qRT-PCR was performed to detect the expression of miR-34a in the kidney and liver tissues. The levels of SIRT1, HIF-1a, Egr-1, and TGF-β1 in kidney and liver tissues were determined using qRT-PCR, western blot, and immunohistochemistry. Electron microscopy and HE staining were used to observe the ultrastructure and pathological changes.

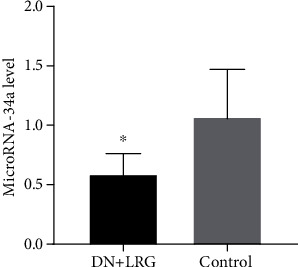
Results: Liraglutide treatment in DN rats decreased blood glucose, 24-hour urine microalbumin, TC, TG, LDL-C, UA, Cr, UREA, ALT, and AST levels and increased the level of HDL-C (P < 0.05). Compared with the control group, the miR-34a levels were significantly decreased in kidney and liver tissues followed by liraglutide treatment (P < 0.05). The levels of SIRT1 in the liraglutide group are significantly higher than those in the control group with the kidney and liver tissues (P < 0.05). Conversely, the contents of HIF-1a, Egr-1, and TGF-β1 were significantly lower in the liraglutide group than in the control group (P < 0.05). Electron microscopy showed that the kidney of the liraglutide-treated group exhibited minor broadening of the mesangial areas, fewer deposits, and a well-organized foot process. HE staining revealed that the kidney of the liraglutide-treated rats had a more regular morphology of the glomerulus and Bowman sac cavity and lighter tubular edema. Additionally, the liraglutide-treated DN rats had a clear hepatic structure, a lower degree of steatosis, and mild inflammatory cell infiltration.

Conclusion: Liraglutide, through its effect on the miR-34a/SIRT1 pathway, may have a protective role in the kidney and liver of DN rats.


Conflict of interest statement

The authors declare no conflicts of interest.

Figures

Figure 1
Figure 1
Fasting blood glucose and 24-hour microalbumin content. Control: diabetic nephropathy group; DN+LRG: diabetic nephropathy+liraglutide group; FBG: fasting blood glucose. P < 0.05 vs. the control.
Figure 2
Figure 2
TC, TG, LDL-C, and HDL-C levels. Control: diabetic nephropathy group; DN+LRG: diabetic nephropathy+liraglutide group; TC: total cholesterol; TG: triglyceride; LDL-C: low-density lipoprotein; HDL-C: high-density lipoprotein. P < 0.05 vs. the control.
Figure 3
Figure 3
UA, Cr, and UREA levels. Control: diabetic nephropathy group; DN+LRG: diabetic nephropathy+liraglutide group; Cr: creatinine; UA: uric acid. P < 0.05 vs. the control.
Figure 4
Figure 4
Levels of transferases in the blood. Control: diabetic nephropathy group; DN+LRG: diabetic nephropathy+liraglutide group; ALT: alanine aminotransferase; AST: aspartate aminotransferase. P < 0.05 vs. the control.
Figure 5
Figure 5
Expression of microRNA-34a in the kidneys. Control: diabetic nephropathy group; DN+LRG: diabetic nephropathy+liraglutide group. P < 0.05 vs. the control.
Figure 6
Figure 6
Expression levels of SIRT1, HIF-1a, Egr-1, and TGF-β1 mRNAs in the kidney. Control: diabetic nephropathy group; DN+LRG: diabetic nephropathy+liraglutide group; Egr-1: early growth response-1; HIF-1a: hypoxia-inducible factor-1 alpha; TGF-β1: transforming growth factor-β1. P < 0.05 vs. the control.
Figure 7
Figure 7
Expression of SIRT1, HIF-1a, Egr-1, and TGF-β1 proteins in the kidney. Control: diabetic nephropathy group; DN+LRG: diabetic nephropathy+liraglutide group; Egr-1: early growth response-1; HIF-1a: hypoxia-inducible factor-1 alpha; TGF-β1: transforming growth factor-β1. P < 0.05 vs. the control.
Figure 8
Figure 8
Western blot of SIRT1, HIF-1a, Egr-1, and TGF-β1 protein expression in the kidney. Control: diabetic nephropathy group; DN+LRG: diabetic nephropathy+liraglutide group; Egr-1: early growth response-1; HIF-1a: hypoxia-inducible factor-1 alpha; TGF-β1: transforming growth factor-β1.
Figure 9
Figure 9
Immunohistochemical detection of SIRT, HIF-1a, Egr-1, and TGF-β1 in the kidney (×400). (a–d) SIRT1, hypoxia-inducible factor-1 α (HIF-1a), early growth response-1 (Egr-1), and transforming growth factor-β1 (TGF-β1), respectively; 1 and 2 represent the DN+LRG and control groups, respectively. Control: diabetic nephropathy group; DN+LRG: diabetic nephropathy+liraglutide group. P < 0.05 vs. the control.
Figure 10
Figure 10
Changes of the renal structure detected by electron microscopy. Control: diabetic nephropathy group; DN+LRG: diabetic nephropathy+liraglutide group.
Figure 11
Figure 11
Hematoxylin eosin staining of the kidney (×400). Control: diabetic nephropathy group; DN+LRG: diabetic nephropathy+liraglutide group.
Figure 12
Figure 12
MicroRNA-34a expression in the livers. Control: diabetic nephropathy group; DN+LRG: diabetic nephropathy+liraglutide group. P < 0.05 vs. the control.
Figure 13
Figure 13
Expression of SIRT1, HIF-1a, Egr-1, and TGF-β1 mRNAs in the liver. Control: diabetic nephropathy group; DN+LRG: diabetic nephropathy+liraglutide group; Egr-1: early growth response-1; HIF-1a: hypoxia-inducible factor-1 alpha; TGF-β1: transforming growth factor-β1. P < 0.05 vs. the control.
Figure 14
Figure 14
Expression of SIRT1, HIF-1a, Egr-1, and TGF-β1 proteins in the liver. Control: diabetic nephropathy group; DN+LRG: diabetic nephropathy+liraglutide group; Egr-1: early growth response-1; HIF-1a: hypoxia-inducible factor-1 alpha; TGF-β1: transforming growth factor-β1. P < 0.05 vs. the control.
Figure 15
Figure 15
Western blot of SIRT1, HIF-1a, Egr-1, and TGF-β1 protein expression in the liver. Control: diabetic nephropathy group; DN+LRG: diabetic nephropathy+liraglutide group; Egr-1: early growth response-1; HIF-1a: hypoxia-inducible factor-1 alpha; TGF-β1: transforming growth factor-β1.
Figure 16
Figure 16
Immunohistochemical detection of SIRT1, HIF-1a, Egr-1, and TGF-β1 in the liver (×100). (a–d) SIRT1, HIF-1a, Egr-1, and TGF-β1, respectively. 1 and 2 indicate the DN+LRG and control groups, respectively. Control: diabetic nephropathy group; DN+LRG: diabetic nephropathy+liraglutide group.
Figure 17
Figure 17
Hematoxylin eosin staining of the liver (×400). Control: diabetic nephropathy group; DN+LRG: diabetic nephropathy+liraglutide group.

References

    1. Callcott E. T., Santhakumar A. B., Luo J., Blanchard C. L. Therapeutic potential of rice-derived polyphenols on obesity-related oxidative stress and inflammation. Journal of Applied Biomedicine. 2018;16(4):255–262. doi: 10.1016/j.jab.2018.03.001. - DOI
    1. Yahya M. J., Ismail P. B., Nordin N. B., et al. CNDP1, NOS3, and MnSOD Polymorphisms as Risk Factors for Diabetic Nephropathy among Type 2 Diabetic Patients in Malaysia. Journal of Nutrition and Metabolism. 2019;2019:13. doi: 10.1155/2019/8736215.8736215 - DOI - PMC - PubMed
    1. Bassi R., Vergani A., D’Addio F., et al. Positive effects of a novel non-peptidyl low molecular weight radical scavenger in renal ischemia/reperfusion: a preliminary report. Springerplus. 2014;3(1):p. 158. doi: 10.1186/2193-1801-3-158. - DOI - PMC - PubMed
    1. Maffi P., Bertuzzi F., de Taddeo F., et al. Kidney function after islet transplant alone in type 1 diabetes: impact of immunosuppressive therapy on progression of diabetic nephropathy. Diabetes Care. 2007;30(5):1150–1155. doi: 10.2337/dc06-1794. - DOI - PubMed
    1. Doria A., Niewczas M. A., Fiorina P. Can existing drugs approved for other indications retard renal function decline in patients with type 1 diabetes and nephropathy? Seminars in Nephrology. 2012;32(5):437–444. doi: 10.1016/j.semnephrol.2012.07.006. - DOI - PMC - PubMed

MeSH terms

LinkOut - more resources