. 2021 Dec 8;224(12 Suppl 2):S670-S682.
doi: 10.1093/infdis/jiab192.

T-Cell Homeostatic Imbalance in Placentas From Women With Human Immunodeficiency Virus in the Absence of Vertical Transmission

Affiliations

T-Cell Homeostatic Imbalance in Placentas From Women With Human Immunodeficiency Virus in the Absence of Vertical Transmission

Nadia M Ikumi et al. J Infect Dis. .

Abstract

Background: Implementation of universal antiretroviral therapy (ART) has significantly lowered vertical transmission rates but has also increased numbers of human immunodeficiency virus (HIV)-exposed uninfected children, who remain vulnerable to morbid effects. In the current study, we investigated whether T-cell alterations in the placenta contribute to altered immune status in HIV-exposed uninfected.

Methods: We analyzed T cells from term placenta decidua and villous tissue and paired cord blood from pregnant women living with HIV (PWH) who initiated ART late in pregnancy (n = 21) with pregnant women not living with HIV (PWNH) (n = 9).

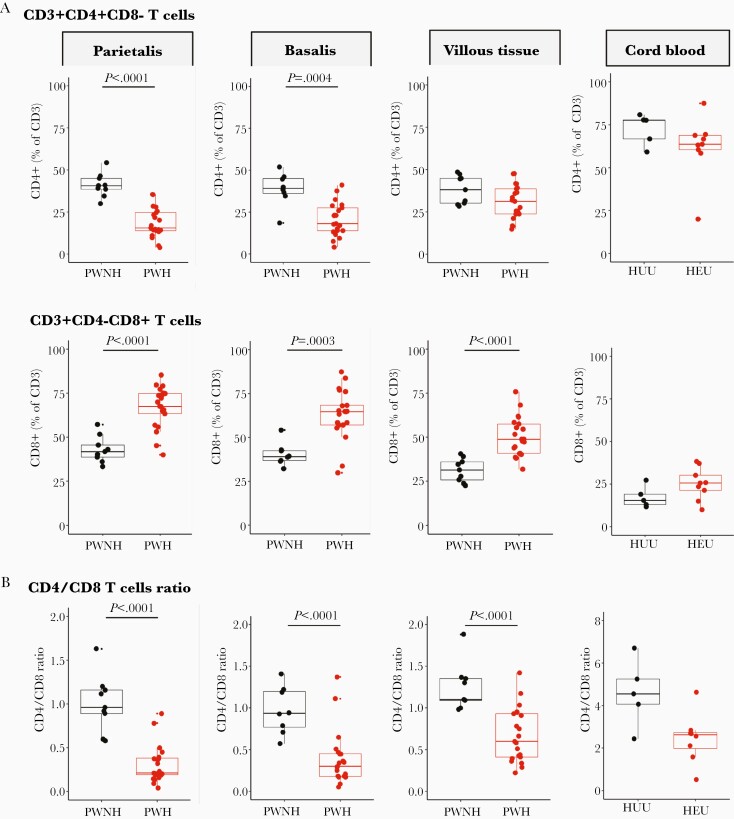
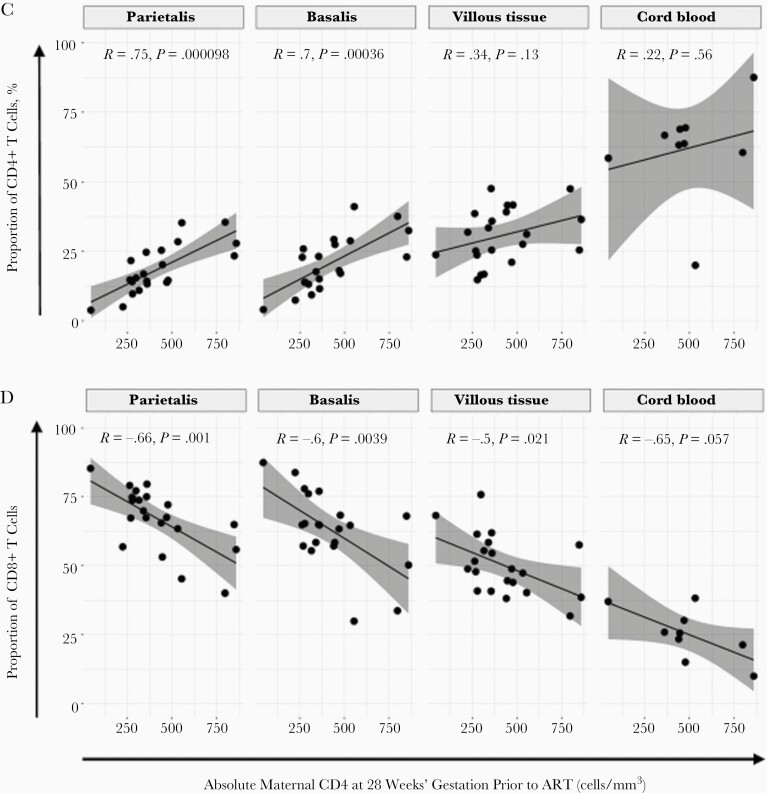
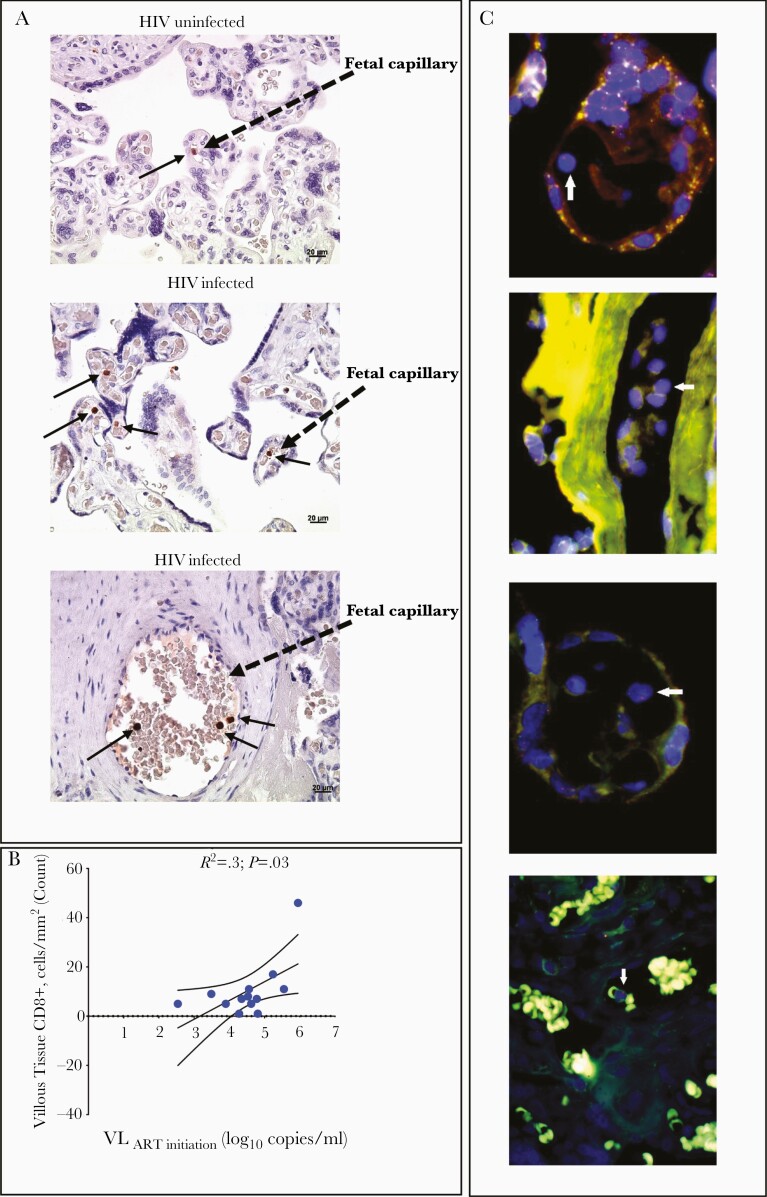
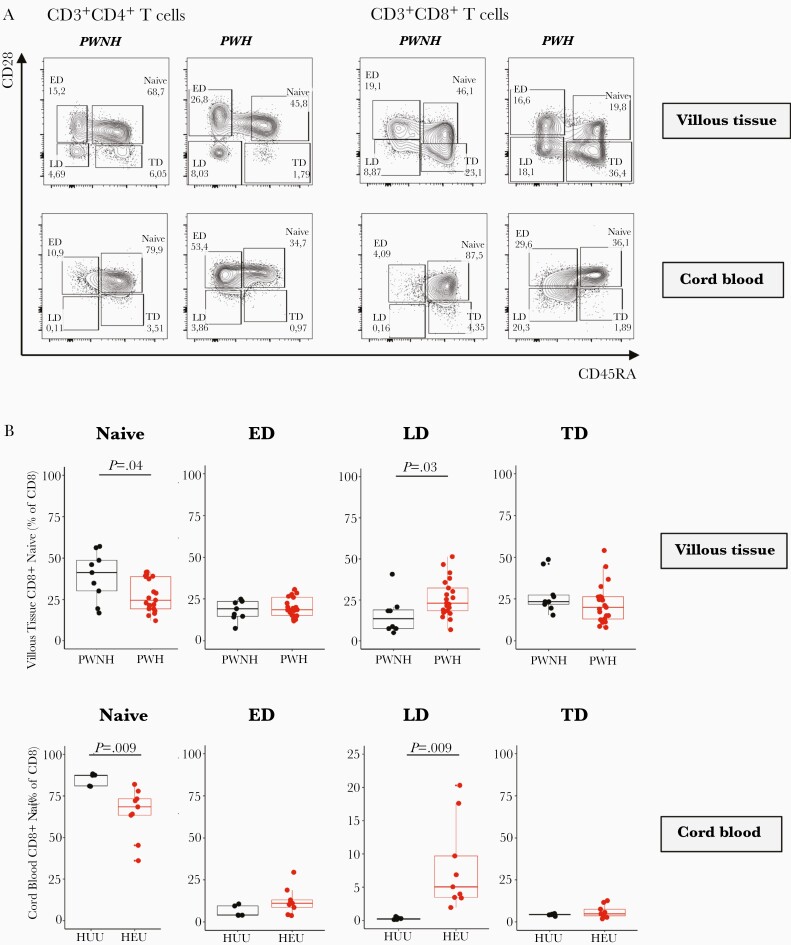
Results: Placentas from PWH showed inverted CD4/CD8 ratios and higher proportions of tissue resident CD8+ T cells in villous tissue relative to control placentas. CD8+ T cells in the fetal capillaries, which were of fetal origin, were positively correlated with maternal plasma viremia before ART initiation, implying that imbalanced T cells persisted throughout pregnancy. In addition, the expanded memory differentiation of CD8+ T cells was confined to the fetal placental compartment and cord blood but was not observed in the maternal decidua.

Conclusions: T-cell homeostatic imbalance in the blood circulation of PWH is reflected in the placenta. The placenta may be a causal link between HIV-induced maternal immune changes during gestation and altered immunity in newborn infants in the absence of vertical transmission.

Keywords: CD4; CD8; HEU; HIV; HIV-exposed; T cells; placenta; placenta pathology; villous tissue.


Figures

Figure 1.
Figure 1.
Proportions of T cells in the placenta and cord blood. A, Box plots (showing medians and interquartile ranges) of CD3+CD4+CD8 and CD3+CD4CD8+ T-cell proportions isolated from the decidua parietalis, decidua basalis, villous tissue, and cord blood from pregnant women not living with human immunodeficiency virus (HIV) (PWNH) and pregnant women living with HIV (PWH) and cord blood from HIV-unexposed uninfected (HUU) and HIV exposed uninfected (HEU) infants. B, Box plots (showing medians and interquartile ranges) of CD4/CD8 T-cell ratios in the decidua parietalis, decidua basalis, villous tissue, and cord blood from PWNH and PWH and cord blood from HUU and HEU infants. Tests of significance were performed using the Mann-Whitney U test. C, Correlation plots between the absolute maternal CD4+ T-cell count at 28 weeks’ gestation before antiretroviral therapy (ART) initiation and the proportions of CD4+ T cells isolated from the decidua parietalis, basalis, villous tissue, and cord blood. Statistical analysis was performed using the Spearman rank test; gray-shaded areas represent 95% confidence intervals. D, Correlation plots between the absolute maternal CD4+ T-cell count at 28 weeks’ gestation (before ART initiation) and the proportion of CD8+ T cells isolated from the decidua parietalis, basalis, villous tissue. and cord blood. Statistical analysis was performed using the Spearman rank test, and gray-shaded areas represent 95% confidence intervals.
Figure 1.
Figure 1.
Proportions of T cells in the placenta and cord blood. A, Box plots (showing medians and interquartile ranges) of CD3+CD4+CD8 and CD3+CD4CD8+ T-cell proportions isolated from the decidua parietalis, decidua basalis, villous tissue, and cord blood from pregnant women not living with human immunodeficiency virus (HIV) (PWNH) and pregnant women living with HIV (PWH) and cord blood from HIV-unexposed uninfected (HUU) and HIV exposed uninfected (HEU) infants. B, Box plots (showing medians and interquartile ranges) of CD4/CD8 T-cell ratios in the decidua parietalis, decidua basalis, villous tissue, and cord blood from PWNH and PWH and cord blood from HUU and HEU infants. Tests of significance were performed using the Mann-Whitney U test. C, Correlation plots between the absolute maternal CD4+ T-cell count at 28 weeks’ gestation before antiretroviral therapy (ART) initiation and the proportions of CD4+ T cells isolated from the decidua parietalis, basalis, villous tissue, and cord blood. Statistical analysis was performed using the Spearman rank test; gray-shaded areas represent 95% confidence intervals. D, Correlation plots between the absolute maternal CD4+ T-cell count at 28 weeks’ gestation (before ART initiation) and the proportion of CD8+ T cells isolated from the decidua parietalis, basalis, villous tissue. and cord blood. Statistical analysis was performed using the Spearman rank test, and gray-shaded areas represent 95% confidence intervals.
Figure 2.
Figure 2.
Proportions of CD4+ and CD8+ T cells in the placenta and maternal viral load. A, Line plot depicting participant viral load trajectories over time at antiretroviral therapy (ART) initiation, was at 28 weeks’ gestation (VLV1; 12 weeks before delivery); at 29, 33, and 36 weeks’ gestation (VLV2, VLV3, and VLV4, respectively; 8, 4, and 2 weeks before delivery); and at day 14 after delivery (VLV5; approximately 2 weeks after delivery). The women received efavirenz (EFV; with tenofovir disoproxil fumarate [TDF] and lamivudine [3TC]) (black lines) or dolutegravir (with TDF+3TC) (blue lines). B, Correlation plot between maternal systemic absolute CD4+ T-cell counts at enrollment, before ART initiation, with maternal viral load at enrollment and ART initiation (at 28 weeks’ gestation). Statistical analysis was performed using the Spearman rank test. C, Correlation plots between CD4+ T-cell proportions in the placenta and maternal viral load at enrollment and ART initiation (28 weeks’ gestation) in the decidua parietalis, basalis, villous tissue and cord blood. Statistical analysis was performed using the Spearman rank test, and gray-shaded areas represent 95% confidence intervals. D, Correlation plots between CD8+ T-cell proportions in the placenta and maternal viral load at enrollment and ART initiation (28 weeks’ gestation) in the decidua parietalis, basalis, villous tissue and cord blood. Statistical analysis was performed using the Spearman rank test, and gray-shaded area represents 95% confidence intervals.
Figure 2.
Figure 2.
Proportions of CD4+ and CD8+ T cells in the placenta and maternal viral load. A, Line plot depicting participant viral load trajectories over time at antiretroviral therapy (ART) initiation, was at 28 weeks’ gestation (VLV1; 12 weeks before delivery); at 29, 33, and 36 weeks’ gestation (VLV2, VLV3, and VLV4, respectively; 8, 4, and 2 weeks before delivery); and at day 14 after delivery (VLV5; approximately 2 weeks after delivery). The women received efavirenz (EFV; with tenofovir disoproxil fumarate [TDF] and lamivudine [3TC]) (black lines) or dolutegravir (with TDF+3TC) (blue lines). B, Correlation plot between maternal systemic absolute CD4+ T-cell counts at enrollment, before ART initiation, with maternal viral load at enrollment and ART initiation (at 28 weeks’ gestation). Statistical analysis was performed using the Spearman rank test. C, Correlation plots between CD4+ T-cell proportions in the placenta and maternal viral load at enrollment and ART initiation (28 weeks’ gestation) in the decidua parietalis, basalis, villous tissue and cord blood. Statistical analysis was performed using the Spearman rank test, and gray-shaded areas represent 95% confidence intervals. D, Correlation plots between CD8+ T-cell proportions in the placenta and maternal viral load at enrollment and ART initiation (28 weeks’ gestation) in the decidua parietalis, basalis, villous tissue and cord blood. Statistical analysis was performed using the Spearman rank test, and gray-shaded area represents 95% confidence intervals.
Figure 3.
Figure 3.
Anatomic location of CD8+ T cells in the villous tissue. A, Representative immunohistochemical stained images of CD8+ T cells in villous tissue sections denoted by brown dots and black arrows in the villi of placentas from human immunodeficiency virus (HIV)–infected and HIV-uninfected mothers (×40 magnification). B, Correlation plot between the density of tissue-bound CD8+ T cells in the villi and maternal viral load (VL) at antiretroviral therapy (ART) initiation. Statistical analysis was performed using the Spearman rank test; curved lines represent the 95% confidence intervals. C, Representative fluorescence in situ hybridization images of lymphocytes (arrows) in the villous tissue from placentas from male infants. The X chromosome is denoted in green, and the Y chromosome in red (digitally scanned slides).
Figure 4.
Figure 4.
Memory phenotype of CD4+ and CD8+ T cells in the villous tissue. A, Representative flow cytometric contour plots of naive, early-differentiated (ED), late-differentiated (LD), and terminally differentiated (TD) CD4+ and CD8+ T cells in the villous tissue (of placentas from pregnant women not living with human immunodeficiency virus (HIV) (PWNH) and pregnant women living with HIV (PWH) and cord blood from HIV-unexposed uninfected (HUU) and HIV-exposed uninfected (HEU) infants. B, Box plots (showing medians and interquartile ranges) of CD8+-naive, ED, LD, and TD T cells in the villous tissue and cord blood from HUU and HEU infants. Tests of significance were performed using the Mann-Whitney U test.

References

    1. Okoye AA, Picker LJ. CD4+ T-cell depletion in HIV infection: mechanisms of immunological failure. Immunol Rev 2013; 254:54–64. - PMC - PubMed
    1. Demers KR, Makedonas G, Buggert M, et al. . Temporal dynamics of CD8+ T cell effector responses during primary HIV infection. PLoS Pathog 2016; 12:e1005805. - PMC - PubMed
    1. Hileman CO, Funderburg NT. Inflammation, immune activation, and antiretroviral therapy in HIV. Curr HIV/AIDS Rep 2017; 14:93–100. - PMC - PubMed
    1. Okhai H, Vivancos-Gallego MJ, Hill T, Sabin CA. CD4+:CD8+ T cell ratio normalization and the development of AIDS events in people with HIV starting antiretroviral therapy. AIDS Res Hum Retroviruses 2020; 36:808–16. - PMC - PubMed
    1. Uthman OA, Nachega JB, Anderson J, et al. . Timing of initiation of antiretroviral therapy and adverse pregnancy outcomes: a systematic review and meta-analysis. Lancet HIV 2017; 4:e21–30. - PubMed

Publication types