. 2021 Oct;73(10):1791-1799.
doi: 10.1002/art.41763. Epub 2021 Sep 3.

Discrimination of COVID-19 From Inflammation-Induced Cytokine Storm Syndromes Using Disease-Related Blood Biomarkers

Affiliations

Discrimination of COVID-19 From Inflammation-Induced Cytokine Storm Syndromes Using Disease-Related Blood Biomarkers

Christoph Kessel et al. Arthritis Rheumatol. 2021 Oct.

Abstract

Objective: Infection with the novel coronavirus SARS-CoV-2 triggers severe illness with high mortality in a subgroup of patients. Such a critical course of COVID-19 is thought to be associated with the development of cytokine storm, a condition seen in macrophage activation syndrome (MAS) and secondary hemophagocytic lymphohistiocytosis (HLH). However, specific data demonstrating a clear association of cytokine storm with severe COVID-19 are still lacking. The aim of this study was to directly address whether immune activation in COVID-19 does indeed mimic the conditions found in these classic cytokine storm syndromes.

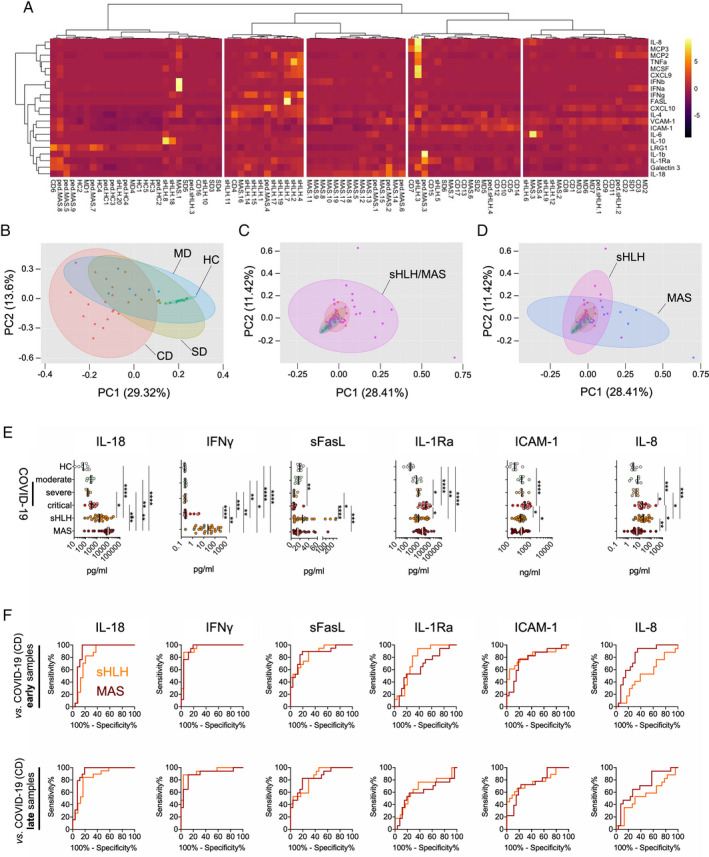
Methods: Levels of 22 biomarkers were quantified in serum samples from patients with COVID-19 (n = 30 patients, n = 83 longitudinal samples in total), patients with secondary HLH/MAS (n = 50), and healthy controls (n = 9). Measurements were performed using bead array assays and single-marker enzyme-linked immunosorbent assay. Serum biomarker levels were assessed for correlations with disease outcome.

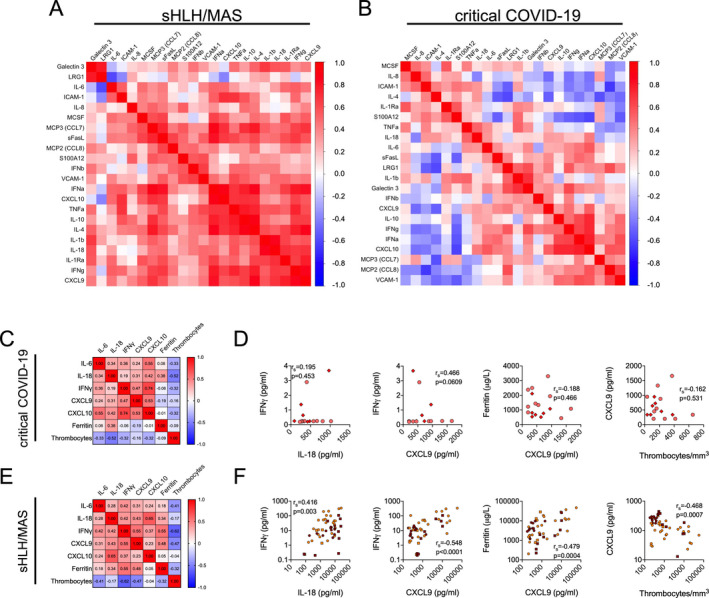
Results: In patients with secondary HLH/MAS, we observed pronounced activation of the interleukin-18 (IL-18)-interferon-γ axis, increased serum levels of IL-1 receptor antagonist, intercellular adhesion molecule 1, and IL-8, and strongly reduced levels of soluble Fas ligand in the course of SARS-CoV-2 infection. These observations appeared to discriminate immune dysregulation in critical COVID-19 from the well-recognized characteristics of other cytokine storm syndromes.

Conclusion: Serum biomarker profiles clearly separate COVID-19 from MAS or secondary HLH in terms of distinguishing the severe systemic hyperinflammation that occurs following SARS-CoV-2 infection. These findings could be useful in determining the efficacy of drugs targeting key molecules and pathways specifically associated with systemic cytokine storm conditions in the treatment of COVID-19.


Figures

Figure 1
Figure 1
Serum biomarker profiles in patients with COVID‐19 compared to patients with secondary hemophagocytic lymphohistiocytosis (sHLH)/macrophage activation syndrome (MAS). A, Heatmap from unsupervised clustering analysis using correlation distance and ward.D linkage showing biomarker levels in the first serum sample obtained following hospitalization from patients with critical COVID‐19 (CD) (presence of acute respiratory distress syndrome [ARDS] and/or deceased; n = 17), those with severe disease (SD) (requiring oxygen supplementation; n = 6), or those with moderate disease (MD) (ARDS not present and oxygen supplementation not required; n = 7) in relation to measurements of serum biomarker levels in patients with active secondary HLH (adult, n = 18; pediatric, n = 4) and patients with MAS (adult‐onset Still’s disease, n = 17; systemic lupus erythematosus [SLE], n = 2; systemic juvenile idiopathic arthritis, n = 8; juvenile SLE, n = 1) as well as healthy controls (HC) (n = 9). Color coding indicates the row Z score for expression levels in each sample. BD, Principal components (PC) analyses of the serum samples described in A, analyzing biomarker profiles in serum from patients with COVID‐19 according to disease severity compared to healthy controls (B) and patients with secondary HLH/MAS (C) and from patients with secondary HLH compared to patients with MAS (D). E, Individual biomarkers showing differential expression in patients with COVID‐19 according to disease severity compared to patients with secondary HLH, patients with MAS, and healthy controls. Results are shown as scatterplots, in which symbols represent individual samples, and vertical lines show the median. * = P < 0.05; ** = P < 0.01; *** = P < 0.001; **** = P < 0.0001, by Kruskal‐Wallis test followed by Dunn’s test for multiple comparisons. F, Receiver operating characteristic curve analyses of individual serum biomarkers (corresponding to those in E) for the differentiation of patients with critical COVID‐19 from patients with secondary HLH or MAS. Results are shown according to the time of sample collection from patients with COVID‐19: early = first serum sample obtained following hospitalization; late = later in disease progression. IL‐8 = interleukin‐8; MCP‐3 = monocyte chemoattractant protein 3; TNFA = tumor necrosis factor; MCSF = macrophage colony‐stimulating factor; IFNb = interferon‐β; VCAM‐1 = vascular cell adhesion molecule 1; ICAM‐1 = intercellular adhesion molecule 1; LRG‐1 = leucine‐rich α2‐glycoprotein 1; sFasL = soluble FasL; IL‐1Ra = IL‐1 receptor antagonist.
Figure 2
Figure 2
Dysregulation of the IL‐18–IFNγ axis in patients with classic cytokine storm syndromes as compared to patients with COVID‐19. A and B, Hierarchical clustering analyses showing multiple correlations by Spearman’s rank correlation test of serum biomarker levels in patients with active secondary HLH/MAS (n = 50) (A) and patients with critical COVID‐19 (n = 17) (B). Positive associations are depicted in red; negative associations are depicted in blue. C and E, Hierarchical clustering analyses of Spearman’s rank correlations between serum levels of IL‐6, IL‐18, IFNγ, and IFNγ signaling surrogates CXCL9 and CXCL10, as well as serum ferritin and thrombocyte cell counts, in patients with critical COVID‐19 (n = 17) (C) and patients with secondary HLH/MAS (n = 50) (E). D and F, Correlations of expression levels between the same serum biomarkers as indicated in C and E. In D, circles represent patients with critical COVID‐19, and diamonds represent patients who are deceased (n = 7). In F, orange circles represent patients with secondary HLH (n = 22), dark red circles represent patients with MAS (n = 28), and squares represent pediatric/adolescent patients with secondary HLH (n = 4) or MAS (n = 9). See Figure 1 for definitions.

References

    1. Mehta P, McAuley DF, Brown M, Sanchez E, Tattersall RS, Manson JJ, et al. COVID‐19: consider cytokine storm syndromes and immunosuppression [letter]. Lancet 2020;395:1033–4. - PMC - PubMed
    1. Crayne CB, Albeituni S, Nichols KE, Cron RQ. The immunology of macrophage activation syndrome [review]. Front Immunol 2019;10:119. - PMC - PubMed
    1. Henderson LA, Canna SW, Schulert GS, Volpi S, Lee PY, Kernan KF, et al. On the alert for cytokine storm: immunopathology in COVID‐19. Arthritis Rheumatol 2020;72:1059–63. - PMC - PubMed
    1. Sinha P, Matthay MA, Calfee CS. Is a “cytokine storm” relevant to COVID‐19? [editorial]. JAMA Intern Med 2020;180:1152–4. - PubMed
    1. Force AD, Ranieri VM, Rubenfeld GD, Thompson BT, Ferguson ND, Caldwell E, et al. Acute respiratory distress syndrome: the Berlin Definition. JAMA 2012;307:2526–33. - PubMed

Publication types

MeSH terms