

Electrocardiographic Imaging of Repolarization Abnormalities
- PMID: 33880931
- PMCID: PMC8200734
- DOI: 10.1161/JAHA.120.020153
Electrocardiographic Imaging of Repolarization Abnormalities
Abstract
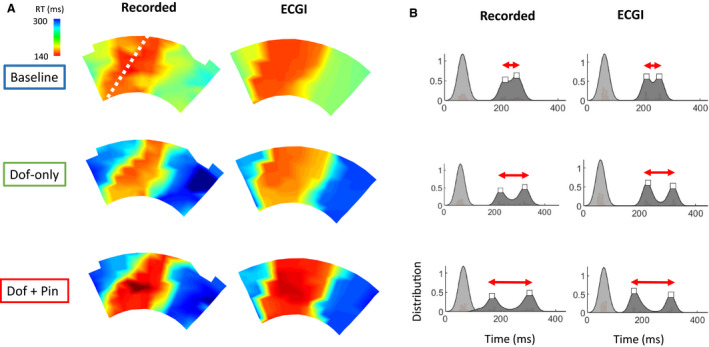
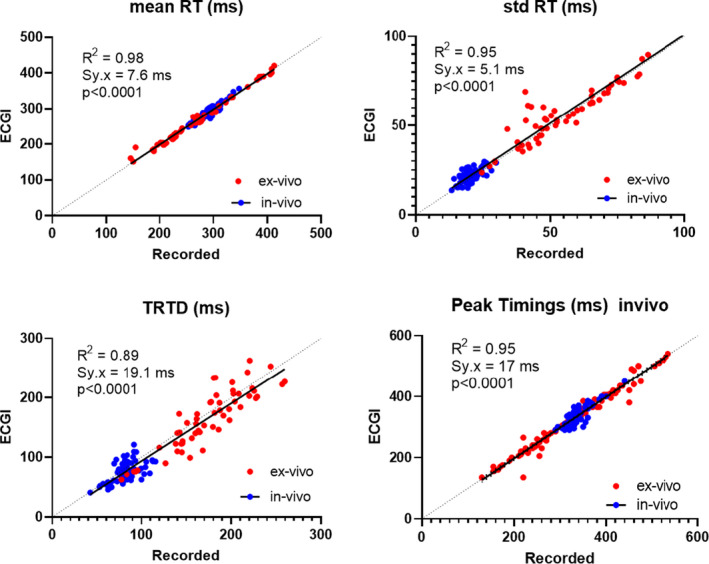
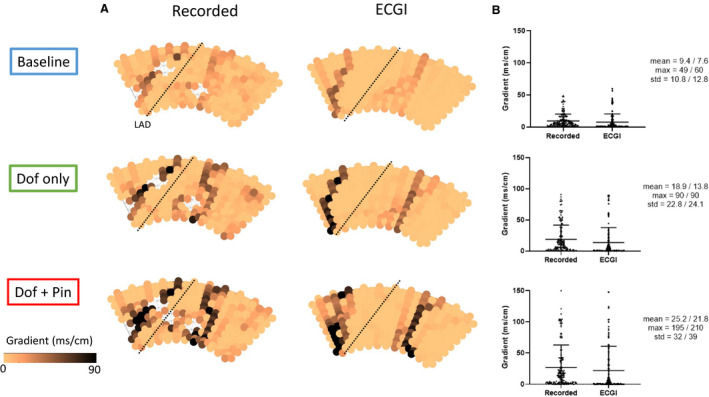
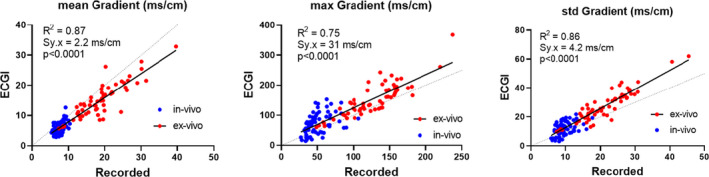
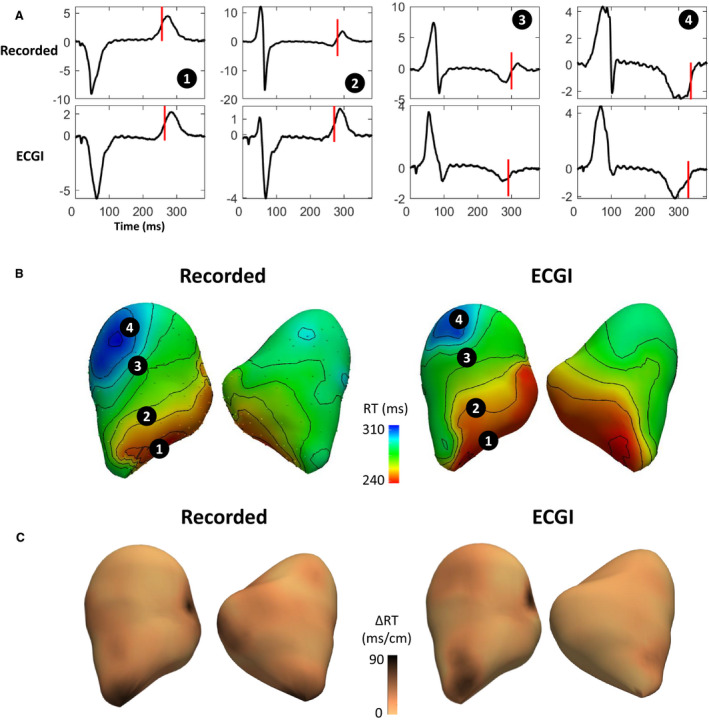
Background Dispersion and gradients in repolarization have been associated with life-threatening arrhythmias, but are difficult to quantify precisely from surface electrocardiography. The objective of this study was to evaluate electrocardiographic imaging (ECGI) to noninvasively detect repolarization-based abnormalities. Methods and Results Ex vivo data were obtained from Langendorff-perfused pig hearts (n=8) and a human donor heart. Unipolar electrograms were recorded simultaneously during sinus rhythm from an epicardial sock and the torso-shaped tank within which the heart was suspended. Regional repolarization heterogeneities were introduced through perfusion of dofetilide and pinacidil into separate perfusion beds. In vivo data included torso and epicardial potentials recorded simultaneously in anesthetized, closed-chest pigs (n=5), during sinus rhythm, and ventricular pacing. For both data sets, ECGI accurately reconstructed T-wave electrogram morphologies when compared with those recorded by the sock (ex vivo: correlation coefficient, 0.85 [0.52-0.96], in vivo: correlation coefficient, 0.86 [0.52-0.96]) and repolarization time maps (ex-vivo: correlation coefficient, 0.73 [0.63-0.83], in vivo: correlation coefficient, 0.76 [0.67-0.82]). ECGI-reconstructed repolarization time distributions were strongly correlated to those measured by the sock (both data sets, R2 ≥0.92). Although the position of the gradient was slightly shifted by 8.3 (0-13.9) mm, the mean, max, and SD between ECGI and recorded gradient values were highly correlated (R2=0.87, 0.75, and 0.86 respectively). There was no significant difference in ECGI accuracy between ex vivo and in vivo data. Conclusions ECGI reliably and accurately maps potentially critical repolarization abnormalities. This noninvasive approach allows imaging and quantifying individual parameters of abnormal repolarization-based substrates in patients with arrhythmogenesis, to improve diagnosis and risk stratification.
Keywords: ECG; electrocardiographic imaging; electrocardiography; electrophysiology mapping; repolarization.
Conflict of interest statement
Dr Cluitmans is employed part‐time by Philips Research. The remaining authors have no disclosures to report.
Figures


Comment in
-
Noninvasive Mapping of Repolarization With Electrocardiographic Imaging.J Am Heart Assoc. 2021 May 4;10(9):e021396. doi: 10.1161/JAHA.121.021396. Epub 2021 Apr 21. J Am Heart Assoc. 2021. PMID: 33880937 Free PMC article. No abstract available.
References
-
- Cluitmans M, Brooks D, MacLeod RS, Doessel O, Guillem M, Van Dam P, Svehlikova J, He B, Sapp J, Wang L, et al. Validation and opportunities of electrocardiographic imaging: from technical achievements to clinical applications. Front Physiol. 2018;1305. DOI: 10.3389/fphys.2018.01305. - DOI - PMC - PubMed
-
- Zhang J, Sacher F, Hoffmayer K, O’Hara T, Strom M, Cuculich P, Silva J, Cooper D, Faddis M, Hocini M, et al. Cardiac electrophysiological substrate underlying the ECG phenotype and electrogram abnormalities in brugada syndrome patients. Circulation. 2015;1950–1959. DOI: 10.1161/CIRCULATIONAHA.114.013698. - DOI - PMC - PubMed
-
- Vijayakumar R, Silva JNA, Desouza KA, Abraham RL, Strom M, Sacher F, Van Hare GF, Haissaguerre M, Roden DM, Rudy Y. Electrophysiologic substrate in congenital long QT syndrome: noninvasive mapping with electrocardiographic imaging (ECGI). Circulation. 2014;1936–1943. DOI: 10.1161/CIRCULATIONAHA.114.011359. - DOI - PMC - PubMed
Publication types
MeSH terms
LinkOut - more resources
Full Text Sources
Medical
