. 2021 Jun;599(12):3037-3061.
doi: 10.1113/JP281365. Epub 2021 May 19.

Neuromuscular junction instability and altered intracellular calcium handling as early determinants of force loss during unloading in humans

Affiliations

Neuromuscular junction instability and altered intracellular calcium handling as early determinants of force loss during unloading in humans

Elena Monti et al. J Physiol. 2021 Jun.

Abstract

Key points: Few days of unloading are sufficient to induce a decline of skeletal muscle mass and function; notably, contractile force is lost at a faster rate than muscle mass. The reasons behind this disproportionate loss of muscle force are still poorly understood. We provide strong evidence of two mechanisms only hypothesized until now for the rapid muscle force loss in only 10 days of bed rest. Our results show that an initial neuromuscular junction instability, accompanied by alterations in the innervation status and impairment of single fibre sarcoplasmic reticulum function contribute to the loss of contractile force in front of a preserved myofibrillar function and central activation capacity. Early onset of neuromuscular junction instability and impairment in calcium dynamics involved in excitation-contraction coupling are proposed as eligible determinants to the greater decline in muscle force than in muscle size during unloading.

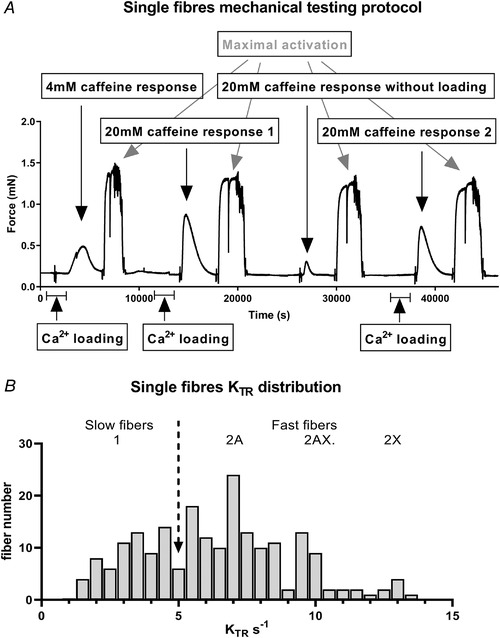
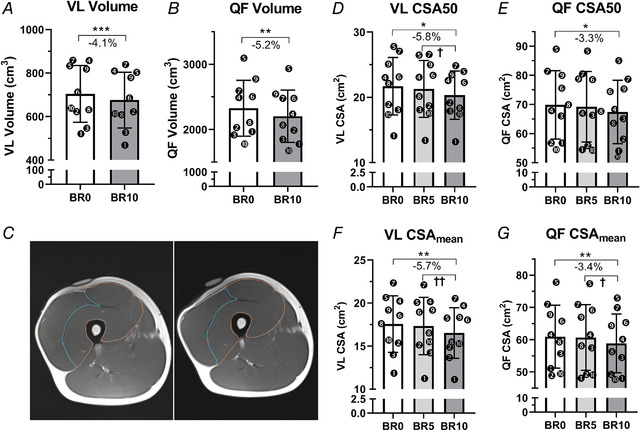
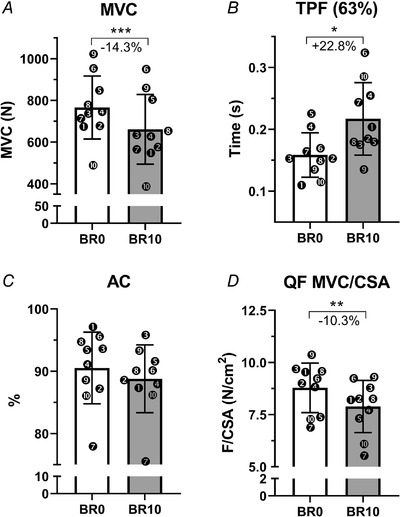
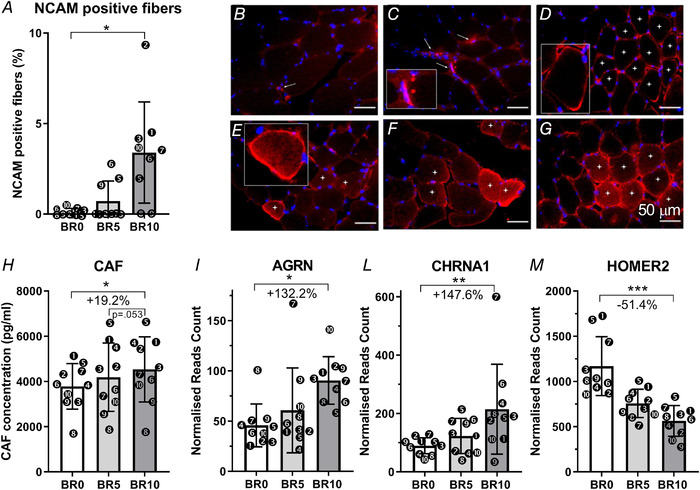
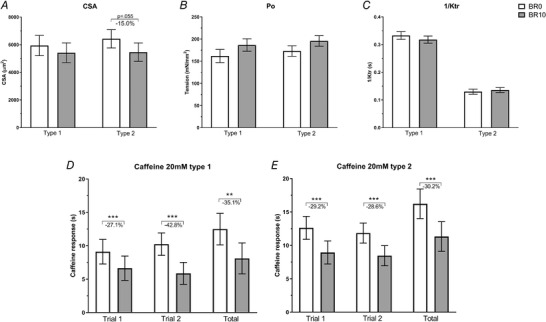
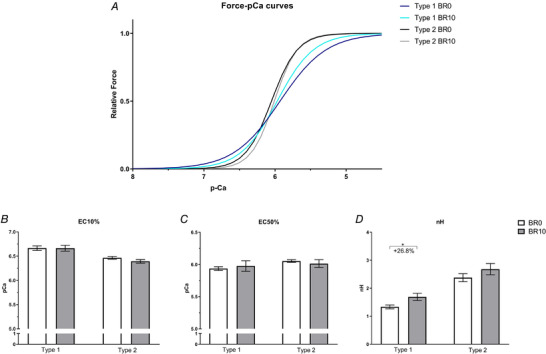
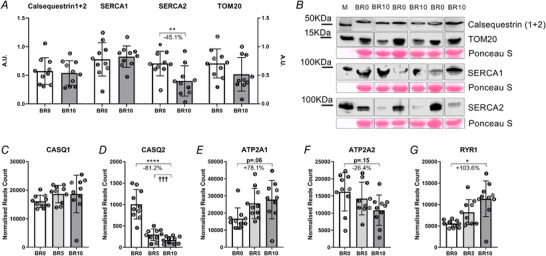
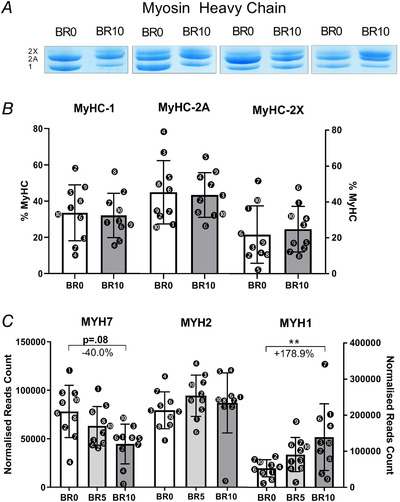
Abstract: Unloading induces rapid skeletal muscle atrophy and functional decline. Importantly, force is lost at a much higher rate than muscle mass. We aimed to investigate the early determinants of the disproportionate loss of force compared to that of muscle mass in response to unloading. Ten young participants underwent 10 days of bed rest (BR). At baseline (BR0) and at 10 days (BR10), quadriceps femoris (QF) volume (VOL) and isometric maximum voluntary contraction (MVC) were assessed. At BR0 and BR10 blood samples and biopsies of vastus lateralis (VL) muscle were collected. Neuromuscular junction (NMJ) stability and myofibre innervation status were assessed, together with single fibre mechanical properties and sarcoplasmic reticulum (SR) calcium handling. From BR0 to BR10, QFVOL and MVC decreased by 5.2% (P = 0.003) and 14.3% (P < 0.001), respectively. Initial and partial denervation was detected from increased neural cell adhesion molecule (NCAM)-positive myofibres at BR10 compared with BR0 (+3.4%, P = 0.016). NMJ instability was further inferred from increased C-terminal agrin fragment concentration in serum (+19.2% at BR10, P = 0.031). Fast fibre cross-sectional area (CSA) showed a trend to decrease by 15% (P = 0.055) at BR10, while single fibre maximal tension (force/CSA) was unchanged. However, at BR10 SR Ca2+ release in response to caffeine decreased by 35.1% (P < 0.002) and 30.2% (P < 0.001) in fast and slow fibres, respectively, pointing to an impaired excitation-contraction coupling. These findings support the view that the early onset of NMJ instability and impairment in SR function are eligible mechanisms contributing to the greater decline in muscle force than in muscle size during unloading.

Keywords: Ca2+ dynamics; NCAM; muscle atrophy; neuromuscular junction instability; sarcoplasmic reticulum; single fibre atrophy; single fibre contractile impairment; unloading.


Figures

Figure 1
Figure 1. Exemplificative protocol for single fibre mechanical testing
A, typical recording of force responses during sarcoplasmic reticulum Ca2+ loading, calcium release induced with caffeine at 4 mM or 20 mM concentration as indicated and maximal activation. During each maximal activation a Brenner's manoeuvre (fast shortening and relengthening) was carried out and is detectable as a vertical segment. The duration of the calcium loading phases (5 min, indicated with a horizontal segment) has been compressed to emphasize the active responses to caffeine and the maximal calcium activations. B, distribution histogram of KTR in type 1, 2A, 2AX and 2X fibres. The arrow indicates the separation value between slow fibres (KTR < 5) and fast fibres (KTR > 5), as determined with Brenner's manoeuvre.
Figure 2
Figure 2. Knee‐extensor volume and cross‐sectional area adaptations to 10‐day bed‐rest
Vastus lateralis (VL) and quadriceps femoris (QF) volume at baseline (BR0) and after 10 days of bed rest (BR10) measured by magnetic resonance imaging (MRI) (A and B, respectively). Representative MRI scans of QF and VL cross‐sectional area (CSA) at BR0 (left) and BR10 (right) acquired at 50% of the femur length (C). A cod‐liver oil tablet was taped upon the thigh in order to better identify the region of interest corresponding to 50% of the femur length. VL and QF CSA measured at 50% of the femur length (DE) and CSAmean averaged from the CSAs taken at the 30%, 50% and 70% of the femur length (FG) at BR0, after 5 days of bed rest (BR5) and at BR10 measured by ultrasound. Results shown as means ± SD, individual data represented as scatter plots. * P < 0.05 BR10 vs BR0, ** P < 0.01 BR10 vs BR0, *** P < 0.001 BR10 vs BR0, P < 0.05 BR10 vs BR5, †† P < 0.01 BR10 vs BR5.
Figure 3
Figure 3. Knee‐extensor contractile function adaptations to 10‐day bed rest
Knee‐extensor isometric maximum voluntary contraction (MVC) (A), time to reach 63% of the MVC (TPF) (63%) (B), activation capacity (%) (AC) (C) at BR0 and BR10. Knee‐extensor maximum voluntary force normalized for quadriceps cross‐sectional area (QF MVC/CSA) (D) at BR0 and BR10. Results shown as means ± SD, individual data represented as scatter plots. * P < 0.05 BR10 vs BR0, ** P < 0.01 BR10 vs BR0, *** P < 0.001 BR10 vs BR0.
Figure 4
Figure 4. Biomarkers of neuromuscular junctions remodelling in response to 10‐day bed rest
Neural cell adhesion molecule (NCAM)‐positive fibres expressed as a percentage of the total numbers of fibres (A). NCAM‐positive staining at baseline (BR0) (B), 5 days of bed rest (BR5) (C, D) and 10 days of bed rest (BR10) (EG). Serum C‐terminal agrin fragment (CAF) levels measured at BR0, BR5 and BR10 (H). AGRN gene expression (encoding for agrin) (I); CHRNA1 gene expression (encoding for acetylcholine receptor α1 subunit) (L) and HOMER2 gene expression (encoding for homer2 protein) (M). All RNA transcripts are reported as normalized read count at BR0, BR5 and BR10. Results shown as means ± SD, individual data represented as scatter plots. * P < 0.05 BR10 vs BR0.
Figure 5
Figure 5. Vastus lateralis single muscle fibre size and contractile performance changes in response to 10‐day bed rest
Single fibre cross‐sectional area (CSA) (A), tension (Po) (B) and kinetics of tension redevelopment during maximal activation (1/KTR) (C). Results shown as means ± SEM at baseline (BR0) (n = 105) and after 10 days of bed rest (BR10) (n = 107). Single fibre response to 20 mM caffeine exposure (D, E) in two different repeated cycles (trial 1 and trial 2) and total tension developed (total) calculated as the average of trial 1 and trial 2 with the addition of the response developed after the no‐loading cycle (see Methods). Results shown as means ± SEM at BR0 (n = 100) versus BR10 (n = 103) for type 1 (D) and type 2 (E) fibres. ** P < 0.01 BR10 vs BR0, *** P < 0.001 BR10 vs BR0.
Figure 6
Figure 6. Vastus lateralis single muscle fibre force‐pCa curves changes in response to 10‐day bed rest
Force‐pCa curves of type 1 (blue–light blue) and type 2 (black–grey) fibres at BR0 and BR10 (A), obtained according to equation 2 with the parameters showed in panels B, C and D. Calcium concentration (pCa) required to elicit the10% (EC10%) (B) and the 50% (EC50%) (C) of the maximum tension in type 1 and type 2 fibres at BR0 (n = 15) and BR10 (n = 13). Hill coefficient (nH) of type 1 and type 2 fibres at BR0 (n = 15) and BR10 (n = 13) (D). Results shown as means ± SEM. * P < 0.05 BR10 vs BR0.
Figure 7
Figure 7. Variations of gene and protein expression involved in Ca2+ handling in response to 10‐day bed rest
Calsequestrin1‐2, SERCA1, SERCA2 and TOM20 amount in muscle homogenates as obtained by western blot at baseline (BR0) and after 10 days of bed rest (BR10) (A). Representative western blot of CASQ1‐2, SERCA1, SERCA2 and TOM20 (B). CASQ1 and CASQ2 gene expression (encoding for Calsequestrin1 and Calsequestrin2, respectively) (C, D), ATP2A1 and ATP2A2 gene expression (encoding for SERCA1 and SERCA2, respectively) (E, F); RYR1 gene expression (encoding for Ryanodine Receptor 1) (G). All RNA transcripts are reported as normalized read count at BR0, after 5 days of bed rest (BR5) and at BR10. Results shown as means ± SD, individual data represented as scatter plots. * P < 0.05 BR10 vs BR0, ** P < 0.01 BR10 vs BR0, **** P < 0.0001 BR10 vs BR0.
Figure 8
Figure 8. Variations in gene and protein expression of myosin heavy chain isoforms in response to 10‐day bed rest
MyHC‐1, MyHC‐2A and MyHC‐2X percentages measured by SDS‐page gel electrophoresis at BR0 and BR10 and representative electrophoresis gels for the dosage of MyHCs percentages (A, B); MYH7, MYH2 and MYH1 gene expression (encoding for MyHC‐1, MyHC‐2A and MyHC‐2X, respectively) (C). RNA transcripts are reported as normalized read count at BR0, after 5 days of bed rest (BR5) and at BR10. Results shown as means ± SD, individual data represented as scatter plots. ** P < 0.01 BR10 vs BR0.

Comment in

References

    1. Aagaard P, Suetta C, Caserotti P, Magnusson SP & Kjær M (2010). Role of the nervous system in sarcopenia and muscle atrophy with aging: Strength training as a countermeasure. Scand J Med Sci Sport 20, 49–64. - PubMed
    1. Allen GM, Gandevia SC & McKenzie DK (1995). Reliability of measurements of muscle strength and voluntary activation using twitch interpolation. Muscle Nerve 18, 593–600. - PubMed
    1. Arentson‐Lantz EJ, English KL, Paddon‐Jones D & Fry CS (2016). Fourteen days of bed rest induces a decline in satellite cell content and robust atrophy of skeletal muscle fibers in middle‐aged adults. J Appl Physiol 120, 965–975. - PMC - PubMed
    1. Barone V, Del Re V, Gamberucci A, Polverino V, Galli L, Rossi D, Costanzi E, Toniolo L, Berti G, Malandrini A, Ricci G, Siciliano G, Vattemi G, Tomelleri G, Pierantozzi E, Spinozzi S, Volpi N, Fulceri R, Battistutta R, Reggiani C & Sorrentino V (2017). Identification and characterization of three novel mutations in the CASQ1 gene in four patients with tubular aggregate myopathy. Hum Mutat 38, 1761–1773. - PubMed
    1. Berg HE, Larsson L & Tesch PA (1997). Lower limb skeletal muscle function after 6 wk of bed rest. J Appl Physiol 82, 182–188. - PubMed

Publication types