Comment
. 2021 Jun 17;137(24):3454-3459.
doi: 10.1182/blood.2020009148.

Primary resistance to CD19-directed chimeric antigen receptor T-cell therapy in T-cell/histiocyte-rich large B-cell lymphoma

Affiliations
Comment

Primary resistance to CD19-directed chimeric antigen receptor T-cell therapy in T-cell/histiocyte-rich large B-cell lymphoma

Jonathan A Trujillo et al. Blood. .
No abstract available


Conflict of interest statement

Conflict-of-interest disclosure: S.M.S. has served as a consultant for Morphosys/Incyte, Janssen, Bristol Myers Squibb (BMS), Karyopharm, TG Therapeutics (TGTX), and Celgene, and has received research funding from FortySeven, TGTX, Pharmacyclics, Acerta, Karyopharm, Portola, Celgene, Novartis, Genentech/Roche, and Epizyme. M.J.F. has served on advisory boards or provided consulting to Novartis, Celgene/BMS, Kite/Gilead, and Arcellx. Z.D. receives research support from Incyte and Regimmune, and has received consulting fees from Syndax Pharmaceuticals. M.R.B. receives research support from Kite/Gilead, Novartis, Arcellx, and CRISPR Therapeutics; has served on advisory boards for Kite/Gilead, Novartis, Arcellx, CRISPR Therapeutics, Autolus, Juno, and Celgene; and has served on speakers’ bureaus for BMS, Incyte, Sanfi, and Kite/Gilead. P.A.R. receives research support from Kite/Gilead, Novartis, Celgene/BMS, MorphoSys, and Calibr; has served on advisory boards for or provided consulting to Bayer, Novartis, Kite/Gilead, Karyopharm, Verastem, and Celgene/BMS; and has served on speakers’ bureaus for Bayer and Kite/Gilead. J.K. receives research support from Merck, Verastem, and iTeos; has served on a speaker’s bureau for Kite/Gilead; and has served on advisory boards for Verastem, Seattle Genetics, MorphoSys, and Karyopharm. The remaining authors declare no competing financial interests.
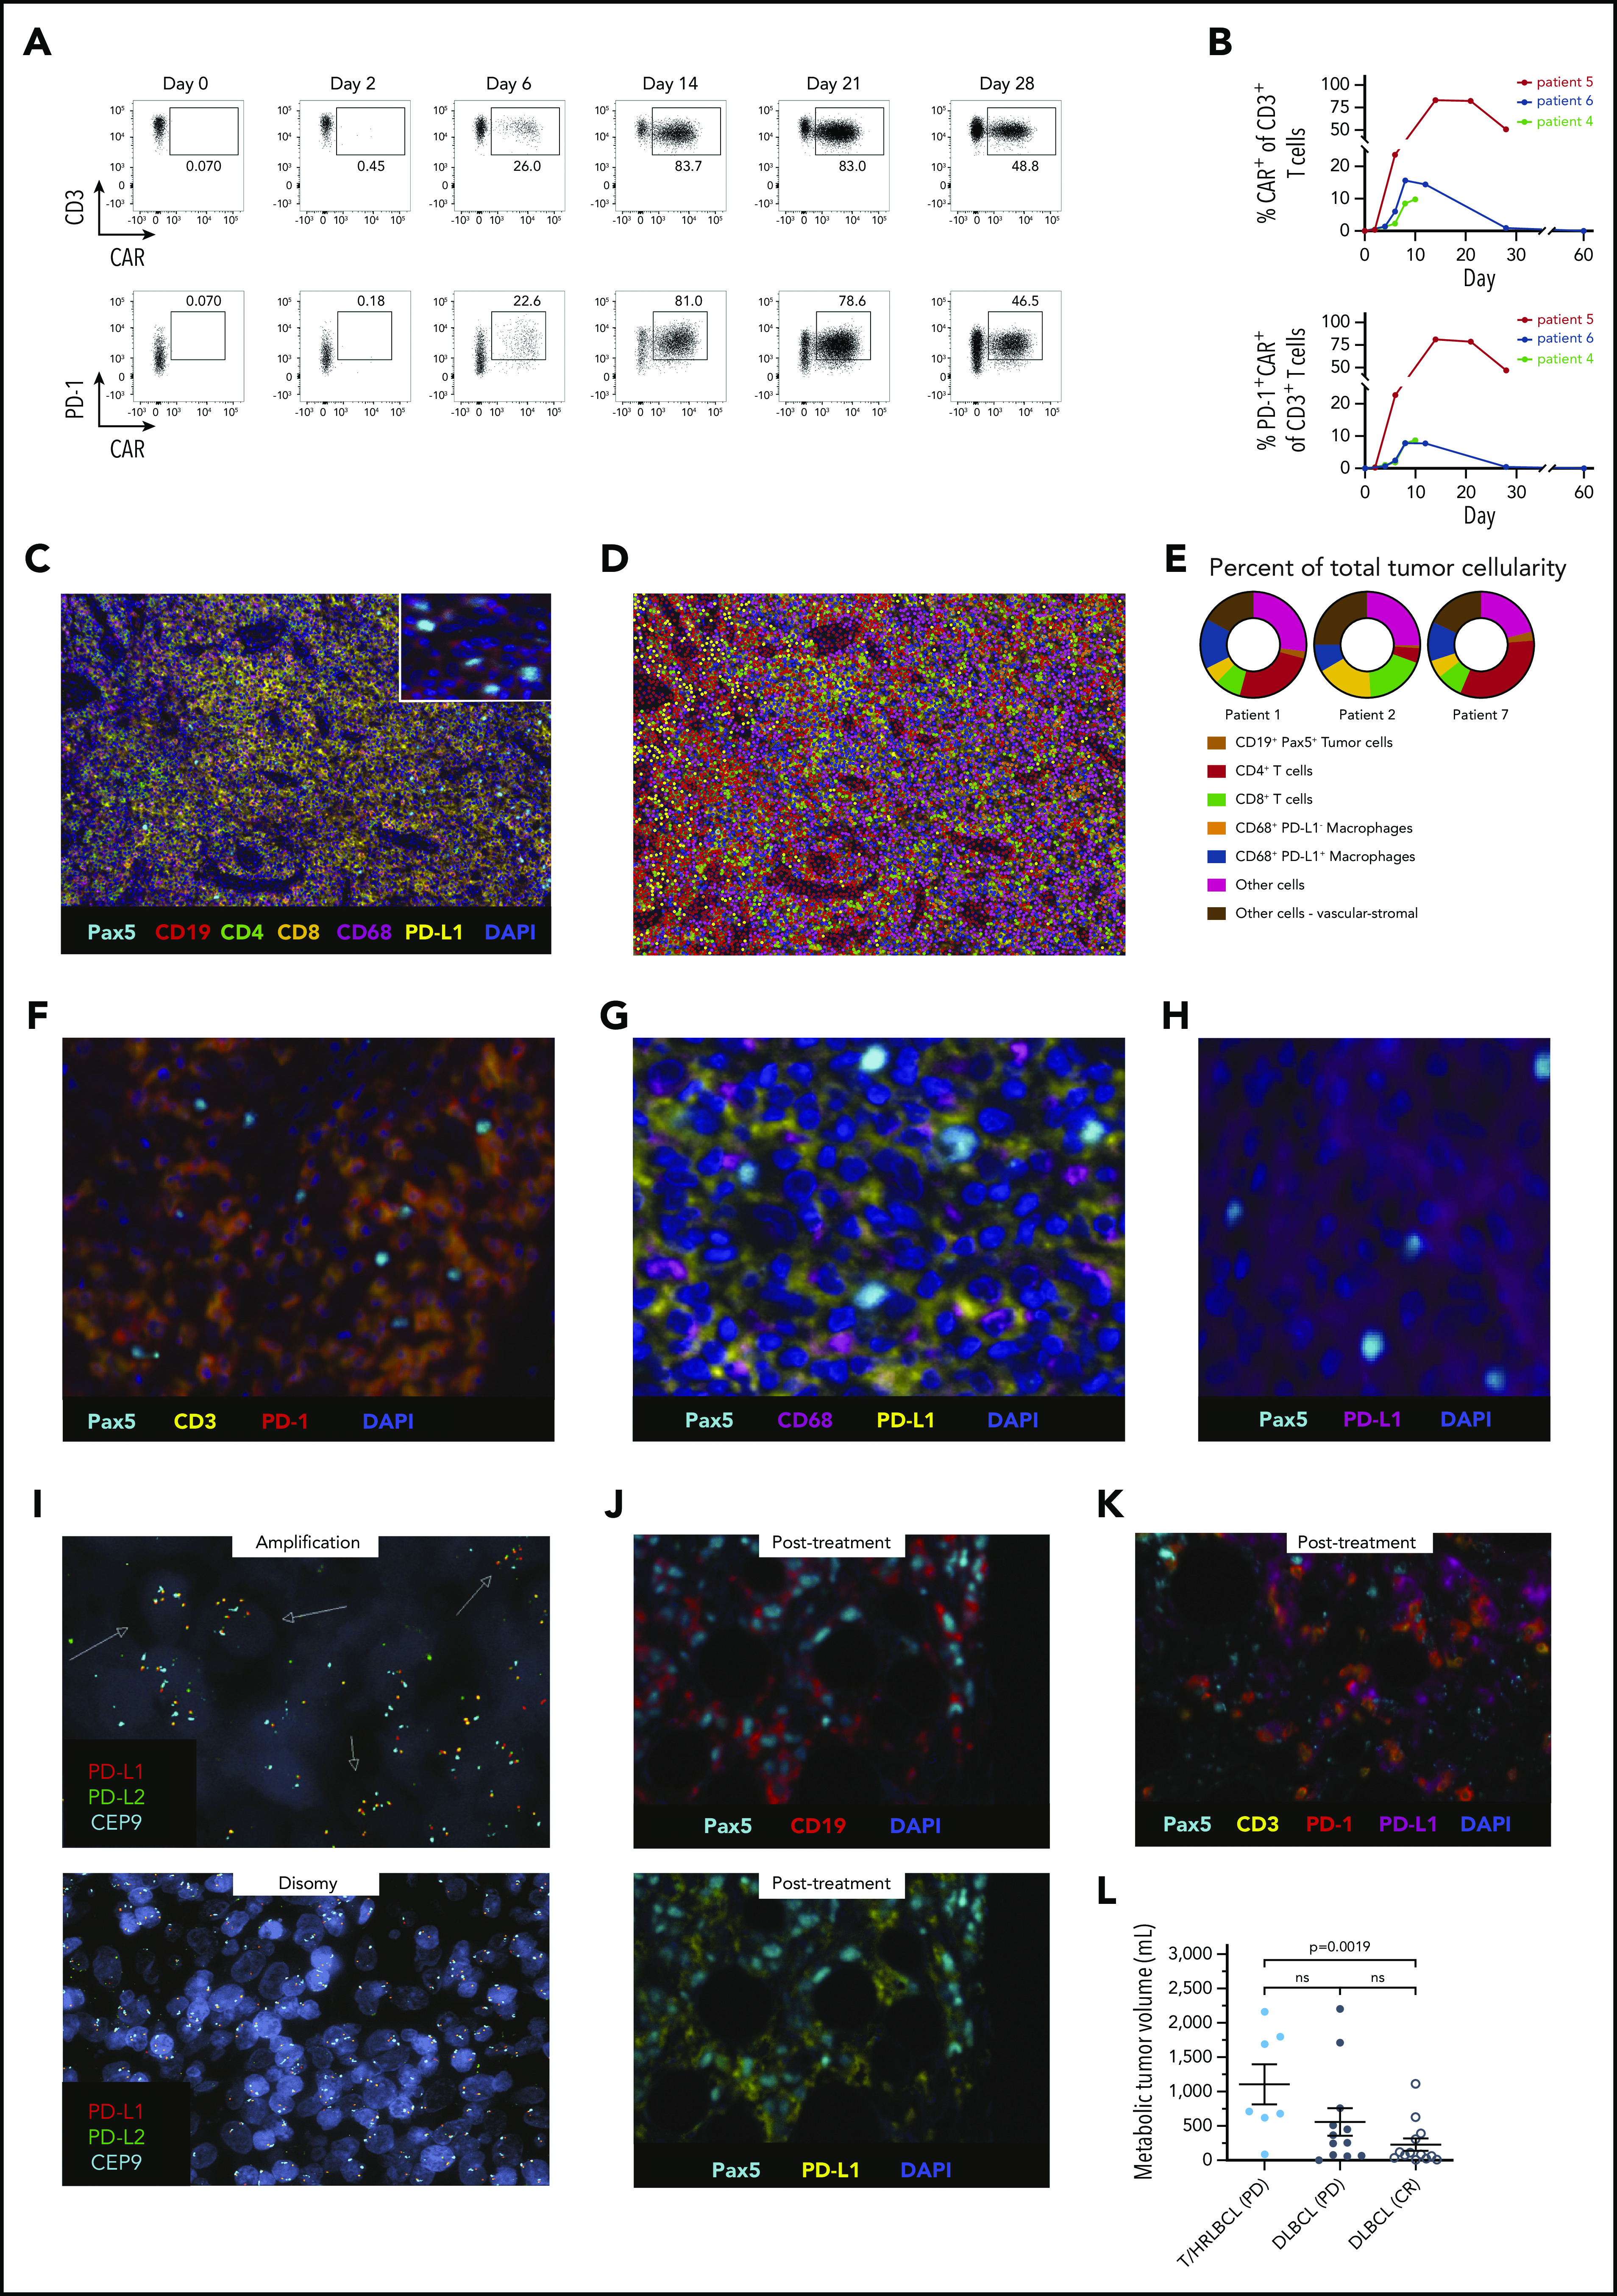
Figures

Figure 1.
Figure 1.
In vivo CAR T-cell expansion kinetics in T/HRLBCL patients and multispectral immune profiling of the T/HRLBCL microenvironment. (A) Representative flow cytometry plots showing frequencies of peripheral blood CAR+CD3+ cells (top panels) and of PD-1+CAR+CD3+ cells (bottom panels; gated on CD3+ cells) prior to and at the indicated time points following CAR T-cell infusion. PBMCs were stained with anti-CD3 antibody, anti-PD-1 antibody, and anti-CAR antibody (clone Y45). (B) Quantitative data depicting CAR+CD3+ T-cell frequencies in peripheral blood of 3 T/HRLBCL patients prior to and at the indicated time points following CAR T-cell therapy (top panel), and frequencies of PD-1+CAR+CD3+ T cells in peripheral blood prior to and at the indicated time points following CAR T-cell therapy (bottom panel). (C) Representative mIF image of a pretreatment T/HRLBCL specimen demonstrating scattered malignant B cells surrounded by numerous PD-L1+ macrophages and T cells. Representative merged mIF staining for Pax5 (light blue), CD19 (red), CD4 (light green), CD8 (orange), CD68 (magenta), PD-L1 (yellow), and nuclear 4′,6-diamidino-2-phenylindole (DAPI) counterstain (blue). Overlaying high-power image of Pax5 (light blue) and CD19 (red) staining showing CD19 expression by Pax5+ lymphoma cells. Images were captured using the Vectra Polaris imaging platform and Phenochart software (PerkinElmer). Image analysis and the generation of cell phenotype maps were performed using a supervised machine learning algorithm within the Inform 2.3 software (PerkinElmer), which assigned trained phenotypes and Cartesian coordinates to cells. mIF staining performed using primary antibodies (anti-Pax5 [BC/24, BioCare Medical], anti-CD19 [CD19, BioCare Medical], anti-CD4 [4B12, BioCare Medical], anti-CD8 [C8/144B, R&D], anti-CD68 [KP1, BioCare Medical], anti-PD-L1 [E1L3N, Cell Signaling] detected with horseradish-peroxidase (HRP)-conjugated secondary antibodies and Opal fluorophores; original magnification ×20. (D) Cell phenotype maps corresponding to the mIF image in panel C were used to determine immune cell composition and location. Each cell type is represented by a color-coded dot as indicated in the key in panel E. Original magnification × 20. (E) Wheel chart showing the percentage of each cell subset per total number of nucleated cells in each T/HRLBCL tumor specimen pre-CAR T-cell therapy. Colors for each cell type coincide with colored dots in the phenotype map. (F) High-power view of mIF staining for Pax5 (light blue), CD3 (yellow), and PD-1 (red) demonstrating PD-1 expression on the surface of CD3+ T cells in the T/HRLBCL microenvironment prior to CAR T-cell therapy. mIF staining performed using primary antibodies (anti-Pax5, anti-CD3 [EP41, BioCare Medical], anti-PD-1 [EPR4877, Abcam]) detected with HRP-conjugated secondary antibodies and Opal fluorophores; original magnification ×85. (G) Representative staining for Pax5 (light blue), CD68 (magenta), and PD-L1 (yellow) demonstrating Pax5+ lymphoma cells surrounded by numerous PD-L1–expressing CD68+ macrophages prior to CAR T-cell therapy. mIF staining performed using primary antibodies (anti-Pax5, anti-CD68, anti-PD-L1) detected with HRP-conjugated secondary antibodies and Opal fluorophores; original magnification ×100. (H) High-power view of Pax5 (light blue) and PD-L1 (magenta) staining demonstrating PD-L1 expression by Pax5+ lymphoma cells. mIF staining performed using primary antibodies (anti-Pax5, anti-PD-L1) detected with HRP-conjugated secondary antibodies and Opal fluorophores; original magnification ×100. (I) PD-L1 FISH images from a T/HRLBCL case with PD-L1/PD-L2 gene amplification (top panel) and a separate PD-L1/PD-L2 disomic T/HRLBCL case (bottom panel). Arrows indicate representative lymphoma cells harboring increased copy numbers (>2) of PD-L1 (orange signal) and PD-L2 (light green signal) compared with the centromere 9 control (light blue signal) FISH probes. FISH probes targeted PD-L1 (red signal) [CD274, Empire Genomics], region centromeric to PD-L1 (light green signal) [RP11-610G2, Empire Genomics] and centromere 9 (light blue signal) [CEP9, Abbott]; nuclei stained with DAPI; original magnification ×100. (J) Representative mIF image of bone marrow tissue exhibiting lymphoma involvement at the time of disease progression after CAR T-cell therapy demonstrating CD19 (red; top panel) and PD-L1 (yellow; bottom panel) expression by Pax5+ lymphoma cells (light blue). mIF staining performed using primary antibodies (anti-Pax5, anti-CD19, anti-PD-L1) detected with HRP-conjugated secondary antibodies and Opal fluorophores; original magnification ×40. (K) High-power view of mIF staining for Pax5 (light blue), CD3 (yellow), PD-1 (red), and PD-L1 (magenta) revealing PD-1+ T cells in close proximity to Pax5+ lymphoma cells and PD-L1+ cells in the bone marrow of a patient with disease progression after CAR T-cell therapy. mIF staining performed using primary antibodies (anti-Pax5, anti-CD3, anti-PD-1, anti-PD-L1) detected with HRP-conjugated secondary antibodies and Opal fluorophores; original magnification ×40. (L) Baseline MTV, derived from PET/CT imaging, in T/HRLBCL and DLBCL patients treated with CAR T-cell therapy at The University of Chicago. MTV data are reported as mean plus or minus standard error of the mean (SEM); 2-tailed, unpaired Student t test. CR, DLBCL patients achieving durable complete remission following CAR T-cell therapy; ns, not significant; PD, patients with progressive disease following CAR T-cell therapy.

Comment on

References

    1. Griffin GK, Weirather JL, Roemer M, et al. . Spatial signatures identify immune escape via PD-1 as a defining feature of T-cell/histiocyte-rich large B-cell lymphoma [published online ahead of print 1 September 2020]. Blood. doi:10.1182/blood.2020006464. - PMC - PubMed
    1. Ollila TA, Reagan JL, Olszewski AJ. Clinical features and survival of patients with T-cell/histiocyte-rich large B-cell lymphoma: analysis of the National Cancer Data Base. Leuk Lymphoma. 2019;60(14):3426-3433. - PMC - PubMed
    1. Schuhmacher B, Bein J, Rausch T, et al. . JUNB, DUSP2, SGK1, SOCS1 and CREBBP are frequently mutated in T-cell/histiocyte-rich large B-cell lymphoma. Haematologica. 2019;104(2):330-337. - PMC - PubMed
    1. Pittaluga S, Jaffe ES. T-cell/histiocyte-rich large B-cell lymphoma. Haematologica. 2010;95(3):352-356. - PMC - PubMed
    1. Godfrey J, Tumuluru S, Bao R, et al. . PD-L1 gene alterations identify a subset of diffuse large B-cell lymphoma harboring a T-cell-inflamed phenotype. Blood. 2019;133(21):2279-2290. - PMC - PubMed

Publication types

LinkOut - more resources