. 2021 Aug 13;33(7):2131-2148.
doi: 10.1093/plcell/koab115.

Spatial and temporal localization of SPIRRIG and WAVE/SCAR reveal roles for these proteins in actin-mediated root hair development

Affiliations

Spatial and temporal localization of SPIRRIG and WAVE/SCAR reveal roles for these proteins in actin-mediated root hair development

Sabrina Chin et al. Plant Cell. .

Abstract

Root hairs are single-cell protrusions that enable roots to optimize nutrient and water acquisition. These structures attain their tubular shapes by confining growth to the cell apex, a process called tip growth. The actin cytoskeleton and endomembrane systems are essential for tip growth; however, little is known about how these cellular components coordinate their activities during this process. Here, we show that SPIRRIG (SPI), a beige and Chediak Higashi domain-containing protein involved in membrane trafficking, and BRK1 and SCAR2, subunits of the WAVE/SCAR (W/SC) actin nucleating promoting complex, display polarized localizations in Arabidopsis thaliana root hairs during distinct developmental stages. SPI accumulates at the root hair apex via post-Golgi compartments and positively regulates tip growth by maintaining tip-focused vesicle secretion and filamentous-actin integrity. BRK1 and SCAR2 on the other hand, mark the root hair initiation domain to specify the position of root hair emergence. Consistent with the localization data, tip growth was reduced in spi and the position of root hair emergence was disrupted in brk1 and scar1234. BRK1 depletion coincided with SPI accumulation as root hairs transitioned from initiation to tip growth. Taken together, our work uncovers a role for SPI in facilitating actin-dependent root hair development in Arabidopsis through pathways that might intersect with W/SC.


Figures

Figure 1
Figure 1
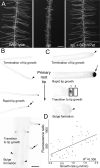
A functional SPI-YPet fusion localizes to the tips of growing root hairs. A, SPI-YPet rescues the short root hair phenotype of spi. Bar = 100 µm. B, Low-magnification image shows that SPI-YPet signal is most prominent at the tips of rapidly expanding root hairs (arrows). A black and white look up table (LUT) image is provided to increase the clarity of SPI-YPet localization. SPI-YPet signal (black color) is weak during initiation/early bulge formation and mature root hairs that have terminated tip growth (arrowheads). Bar = 50 µm. C, High-magnification images of single root hairs during bulge formation until tip growth termination. A black and white look up table (LUT) image is provided to increase the clarity of SPI-YPet localization. SPI-YPet (black color) is enriched at the tip of root hairs that are rapidly growing or transitioning to tip growth (arrow). Faint SPI-YPet signal is found in bulging root hairs or those that have stopped elongating (arrowheads). Images are representative of approximately 150 root hairs from at least 25 seedlings. Bar = 10 µm. D, Scatter plot showing correlation analysis of root hair tip SPI-YPet fluorescence and root hair tip growth. The mean fluorescence in the oval in region 1 divided by the oval in region 2 as shown in (C) represents the fluorescence ratio in the Y-axis. Line shows linear regression fit with R2 value = 0.308 and P = 1.72 × 10⁻⁵ (n=5–7 root hairs per time point)
Figure 2
Figure 2
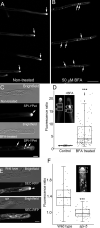
SPI-YPet is localized to BFA-sensitive post-Golgi compartments. A, B, Low-magnification images showing several root hairs expressing SPI-YPet. Note that untreated root hairs (A) maintain tip-focused SPI-YPet, while those treated with BFA (B) show an abundance of fluorescence agglomerates (arrows). Bar = 50 µm. C, Bright field and corresponding fluorescence image of representative untreated and BFA-treated elongating root hair showing the accumulation of SPI-YPet at the apical dome in solvent control-treated seedlings (arrow). Within 10 min after treatment with 50-µM BFA, SPI-YPet at the root hair tip dissipated and formed fluorescent agglomerates along the subapical regions (arrows). Bar = 10 µm. D, Box plot of BFA-induced agglomerates of SPI-YPet in untreated control root hairs and after treatment with 50-µM BFA. Ratio values were obtained by dividing mean fluorescence in rectangular region in 1 over region 2 (inset). Box limits indicate 25th and 75th percentiles, horizontal line is the median, and whiskers display minimum and maximum values. Each dot represents individual measurements from 8 to 14 root hairs per group from 8 to 24 plants. ***P <0.001 indicates statistical significance as determined by Student’s t test. BFA-treated plants had an average of 3.7 BFA-induced agglomerates per root hair, with standard deviation of 4.05, whereas control root hairs showed no BFA-induced agglomerates per root hair. E, The bulk secretory marker SEC-RFP accumulates at the tips of growing wild-type root hairs (arrowhead), but is absent in spi root hairs. Bar = 10 µm. F, Box plot of SEC-RFP root hair tip accumulation expressed as fluorescence ratio. Ratio values were obtained by dividing mean fluorescence in oval region in 1 over region 2 (inset). Box limits indicate 25th and 75th percentiles, horizontal line is the median and whiskers display minimum and maximum values. ***P <0.001 indicates statistical significance as determined by Student’s t test. Each dot represents individual measurement from 8 to 10 root hairs per group from 9 to 12 plants
Figure 3
Figure 3
The tip-focused F-actin meshwork is disrupted in root hairs of spi. A–D, Time course of F-actin organization in a wild-type root hair from bulge formation to rapid tip growth. Weakly fluorescing F-actin networks (double asterisks) in the root hair bulge (A) reorganize into prominent tip-focused meshworks as the root hair transitions to rapid tip growth (arrows in B–D). E, Tip-focused F-actin meshworks (arrow) remain prominent in a long, rapidly elongating wild-type root hair. F, Tip-focused F-actin meshworks in wild-type root hairs are replaced with F-actin bundles (arrowheads) that protrude to the tip when growth stops. G–J, Time course of F-actin organization in a spi root hair bulge that is unable to transition to tip growth. Distinct F-actin meshworks are unable to form in root hair bulges that terminate tip growth (double asterisks, I). Thick F-actin bundles eventually form in these short, nongrowing root hair bulges (arrowhead, J). K–N, F-actin organization in slow-growing spi root hairs. Some spi root hairs show the tip-focused F-actin meshworks typically observed in the wild-type (arrow, K, L). However, tip-focused F-actin meshworks in slow-growing spi root hairs either dissipate (double asterisks, M) or prematurely form thick F-actin bundles that protrude to the tip (arrow, N). Images from (A) to (N) are based on maximum projection images of 20–25 optical sections taken at 0.5-µm intervals. O, Representative maximum projection images and corresponding computer-generated cross-sections of wild-type and spi root hair tips. Only growing root hairs with a clear cytoplasmic cap were selected for analysis. The fluorescence ratio of the root hair tip (oval in 1) to background (oval in 2) was used to quantify tip-focused F-actin meshworks. P, Box plot showing tip-focused F-actin fluorescence ratio. Box limits indicate 25th and 75th percentiles, horizontal line is the median and whiskers display minimum and maximum values. ***P <0.001 indicates statistical significance as determined by Student’s t test. Each dot represents individual measurement from 18 to 21 root hairs per group from at least five independent seedlings. Q, Comparison of root hair growth rates between wild-type and spi lines with their corresponding live F-actin reporter lines UBQ10: mGFP-Lifeact. Box limits indicate 25th and 75th percentiles, horizontal line is the median and whiskers display minimum and maximum values. *** P <0.001 indicates statistical significance as determined by one-way ANOVA. Each dot represents individual measurement from four to five root hairs per group from one to two plants. All scale bars = 10 µm
Figure 4
Figure 4
SPI-YPet and mRuby-Lifeact co-localizes at the root tip in elongating root hairs. A, Time course of a root hair simultaneously expressing SPI-YPet and mRuby-Lifeact. Note that SPI-positive post-Golgi compartments and F-actin meshworks colocalized at the root hair apex (arrows) and dissipated at around the same time (arrowheads) at 80 min. Images are single median optical sections. Bars = 10 µm. B, Method for obtaining SPI-YPet and mRuby-Lifeact ratios at the root hair tip for data shown in (C). A rectangular ROI at the tip and sub apex was used to measure fluorescence. C, Scatter plot showing correlation analysis of root hair tip mRuby-Lifeact fluorescence and SPI-YPet fluorescence within the same root hair. The mean fluorescence in the rectangle in region 1 divided by the rectangle in region 2 as shown in (C) represents the fluorescence ratio for each reporter. For each ratio value, root hair growth rate was obtained by measuring the displacement of the root hair tip after a 10 min interval. Line shows linear regression fit with R2 value = 0.725 and P = 2.127 × 10⁻⁸ (n = 26 time points from three root hair sequences)
Figure 5
Figure 5
BRK1 and SCAR2 mark the root hair initiation domain and contribute to planar polarity. A, Maximum projection confocal micrograph of the elongation and maturation zone of an Arabidopsis primary root expressing a functional BRK1-YFP fusion. The image was generated by merging 50 Z sections taken at 0.5-µm intervals. BRK1-YFP accumulates in the basal end walls and root hair initiation domains (arrows). Bar = 50 µm. B, Time course of BRK1-YFP depletion in a developing root hair. BRK1-YFP signal (arrows) is strongest prior to the formation of a root hair bulge (0 min) and gradually dissipates (arrowheads) as the root hair undergoes rapid tip growth (35–50 min). Bar = 20 µm. C, A scatter plot showing an inverse relationship between BRK1-YFP signal and root hair growth rate. Ratio of fluorescence of BRK1-YFP (a) to background (b) (inset) was plotted against root hair growth rate. Line shows linear regression fit with R2 value = 0.2667 and P = 1.131 × 10⁻⁷ (n= 5–7 root hairs per time point). D, Time course of SCAR2-mCherry in a developing root hair. Like BRK1-YFP, SCAR2-mCherry signal is strongest at the RHID and early stages of root hair bulge formation (0 min, arrow). SCAR2-mCherry signal dissipates when the root hair undergoes rapid tip growth (40 min, arrowhead). Bar = 20 µm. E, Brightfield microscopy images of representative trichoblasts from 6-d-old seedlings showing apical shift in root hair position of brk1 compared to the wild-type, and complementation of brk1 planar polarity phenotypes by BRK1-YFP. Arrowheads mark the end walls of the trichoblast and asterisks mark the basal wall of the emerged root hair. F, Violin plots of root hair planar polarity in wild-type, brk1, scar1234, BRK1-YFP in brk1, SCAR2-mCherry in scar1234, arp2, arp3, and arpc5 genotypes. Relative root hair position was obtained by taking the ratio of the distance from the basal trichoblast wall (bottom arrowheads in E) to the basal root hair wall asterisks over the total length of the trichoblasts (i.e. length between the two arrowsheads). The plot illustrates kernel probability density in which the width represents distribution of data points. The black dot is the median and whiskers display minimum and maximum values. Statistical significance was determined using nonparametric, two sample Kolmogorov–Smirnov pairwise test. Wild-type versus brk1 (***P < 2.2 × 10⁻¹⁶); brk1 versus BRK1-YFP in brk1 (***P < 2.2 × 10⁻¹⁶); wild-type versus BRK1-YFP (P = 0.0808 not significant, NS); wild-type versus scar1234 (***P < 2.2 × 10⁻¹⁶); brk1 versus scar1234 (P = 0.699, ns); scar1234 versus SCAR2-mCherry in scar1234 (***P < 2.2 × 10⁻¹⁶); wild-type versus SCAR2-mCherry in scar1234 (*P = 0.012); wild-type versus arp2 (***P = 2.739 × 10⁻⁵); wild-type versus arp3 (***P = 8.882 × 10⁻¹⁶); wild-type versus arpc5 (***P = 9.18 × 10⁻¹²); brk1 versus arp2 (***P < 2.2 × 10⁻¹⁶); brk1 versus arp3 (***P = 3.41 × 10⁻⁸); brk1 versus arpc5 (***P = 1.304 × 10⁻¹¹); arp2 versus arp3 (***P = 0.00036); arp2 versus arpc5 (*P = 0.001624); arp3 versus arpc5 (*P = 0.0465); brk1 versus arp2 (***P < 2.2 × 10⁻¹⁶); brk1 versus arp3 (***P = 3.41 × 10⁻⁸); brk1 versus arpc5 (***P = 1.304 × 10⁻¹¹). n = 90–117 root hairs
Figure 6
Figure 6
Depletion of BRK1 as root hairs transition to tip growth is delayed in spi. A, Dual imaging of BRK1-mRuby3 (arrowheads) and SPI-YPet shows that dissipation of BRK1 coincides with accumulation of SPI (arrow) as root hairs transition to rapid tip growth. Bar = 20 µm. B and C, BRK1-YFP signal persists in spi root hair bulges (arrows in B) that fail to transition to tip growth and in slow-growing spi root hairs (arrows in C). Bars = 20 µm. D, Method for quantification of BRK1-YFP signal persistence in the root tip of spi. Root hairs of brk1 and spi expressing BRK1-YFP that were approximately 40 µm in length were selected. Rectangular ROIs (1 and 2) were drawn to obtain fluorescence values. Ratio values were obtained by dividing mean fluorescence in rectangle region 1 over region 2 used to plot data in (E). E, Box plot of BRK1-YFP root hair tip gradient expressed as fluorescence ratio. Box limits indicate 25th and 75th percentiles, horizontal line is the median and whiskers display minimum and maximum values. **P <0.01 indicates statistical significance as determined by Student’s t test. Each dot represents measurement from three to six root hairs per group from eight plants. Only root hairs of similar length were compared. The average root hair length for brk1 was 37.28 µm (standard deviation 18.05 µm) and for spi5 was 38.74 µm (standard deviation 18.34 µm). F, Accumulation of SPI-YPet at the root hair tip is not altered in brk1. Bar = 20 µm
None

Comment in

References

    1. Alonso JM, Stepanova AN, Leisse TJ, Kim CJ, Chen H, Shinn P, Stevenson DK, Zimmerman J, Barajas P, Cheuk R, et al. (2003) Genome-wide insertional mutagenesis of Arabidopsis thaliana. Science 301: 653. - PubMed
    1. Badet T, Leger O, Barascud M, Voisin D, Sadon P, Vincent R, Le Ru A., Balague C., Roby D, Raffaele S (2019) Expression polymorphism at the ARPC4 locus links the actin cytoskeleton with quantitative disease resistance to Sclerotinia sclerotiorum in Arabidopsis thaliana. New Phytol 222: 480–496 - PubMed
    1. Baluška F (2002) F-actin-dependent endocytosis of cell wall pectins in meristematic root cells. Insights from Brefeldin A-induced compartments. Plant Physiol 130: 422–431 - PMC - PubMed
    1. Baluška F (2010) Recent surprising similarities between plant cells and neurons. Plant Signal Behav 5: 87–89 - PMC - PubMed
    1. Bascom CS, Hepler PK, Bezanilla M (2018a) Interplay between ions, the cytoskeleton, and cell wall properties during tip growth. Plant Physiol 176: 28–40 - PMC - PubMed

Publication types

MeSH terms

Substances

LinkOut - more resources