. 2021 Apr 21;16(4):e0249772.
doi: 10.1371/journal.pone.0249772. eCollection 2021.

Effect of different thresholds for CT perfusion volumetric analysis on estimated ischemic core and penumbral volumes

Affiliations

Effect of different thresholds for CT perfusion volumetric analysis on estimated ischemic core and penumbral volumes

Simo Karhi et al. PLoS One. .

Abstract

Purpose: This single-center study compared three threshold settings for automated analysis of the ischemic core (IC) and penumbral volumes using computed tomographic perfusion, and their accuracy for predicting final infarct volume (FIV) in patients with anterior circulation acute ischemic stroke (AIS).

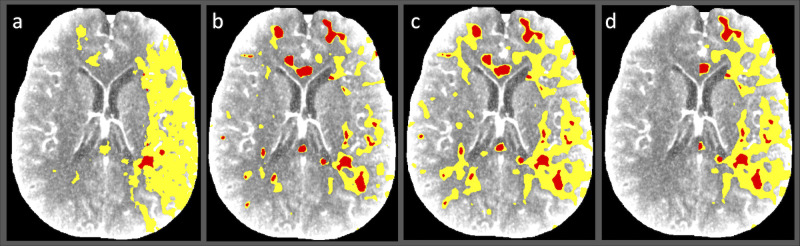
Methods: Fifty-two consecutive AIS patients undergoing mechanical thrombectomy (November 2015-March 2018) were included. Perfusion images were retrospectively analyzed using a single CT Neuro perfusion application (syngo.via 4.1, Siemens Healthcare GmbH). Three threshold values (S1-S3) were derived from another commercial package (RAPID; iSchema View) (S1), up-to-date syngo.via default values (S2), and adapted values for syngo.via from a reference study (S3). The results were compared with FIV determined by non-contrast CT.

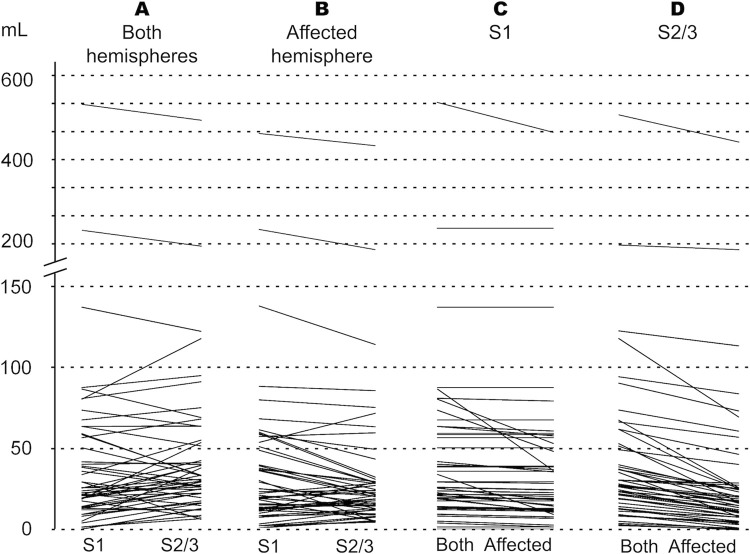
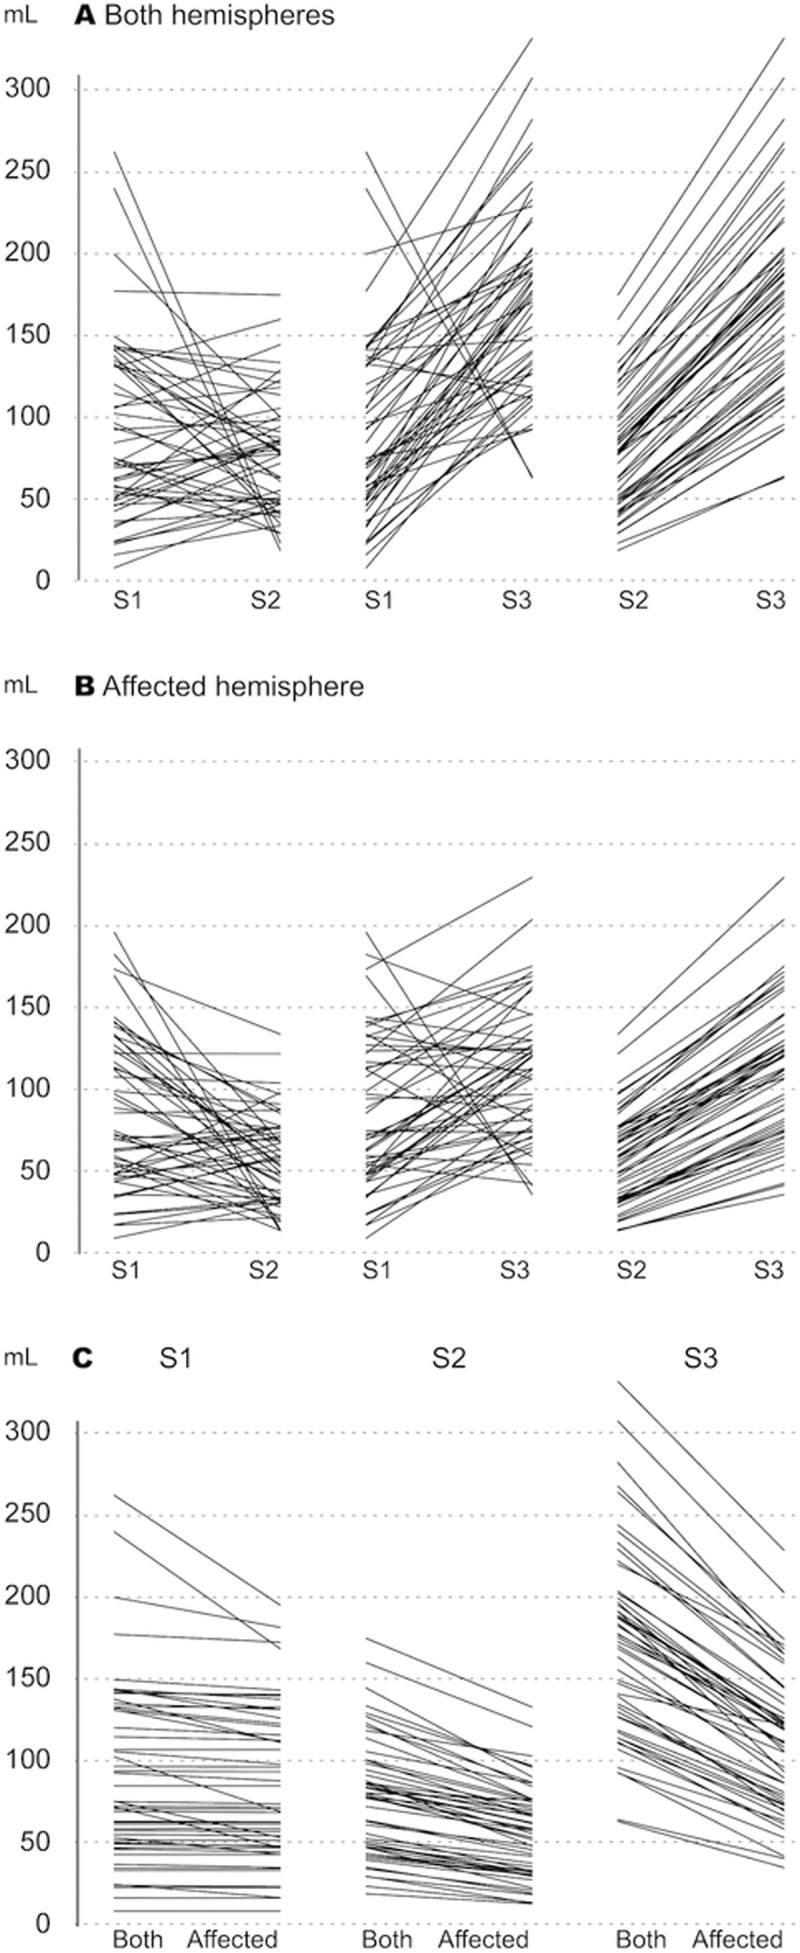
Results: The median IC volume (mL) was 24.6 (interquartile range: 13.7-58.1) with S1 and 30.1 (20.1-53.1) with S2/S3. After removing the contralateral hemisphere from the analysis, the median IC volume decreased by 1.33(0-3.14) with S1 versus 9.13 (6.24-14.82) with S2/S3. The median penumbral volume (mL) was 74.52 (49.64-131.91), 77.86 (46.56-99.23), and 173.23 (125.86-200.64) for S1, S2, and S3, respectively. Limiting analysis to the affected hemisphere, the penumbral volume decreased by 1.6 (0.13-9.02), 19.29 (12.59-26.52), and 58.33 mL (45.53-74.84) for S1, S2, and S3, respectively. The correlation between IC and FIV was highest in patients with successful recanalization (n = 34, r = 0.784 for S1; r = 0.797 for S2/S3).

Conclusion: Optimizing thresholds significantly improves the accuracy of estimated IC and penumbral volumes. Current recommended values produce diversified results. International guidelines based on larger multicenter studies should be established to support the standardization of volumetric analysis in clinical decision-making.


Conflict of interest statement

The authors have declared that no competing interests exist.

Figures

Fig 1
Fig 1
Paired comparisons of the automatically calculated ischemic core volumes (mL) for each patient measured using setting 1 (S1) versus settings 2 or 3 (S2/S3) using data from both hemispheres (A), for S1 versus S2/S3 using data from the affected hemisphere only (B); for S1 using data from the bilateral versus ipsilateral hemispheres (C), and for S2/S3 using data from the bilateral versus ipsilateral hemispheres (D).
Fig 2
Fig 2. Bland Altman plot visualizing the relationship of the differences of measured volumes between those setting pairs with no significant differences detected using One Sample T tests.
A: Measured ischemic core differences between setting 1 (S1) versus setting 2 (S2) using data from both hemispheres. B: Measured penumbral differences using S1 versus S2 with data from both hemispheres. Upper and lower 95% confidence limits for the mean difference in volumes are visualized using thinnest dotted lines.
Fig 3
Fig 3
Paired comparisons of the automatically calculated penumbral volumes (mL) for each patient for setting 1 (S1) versus setting 2 (S2), S1 versus setting 3 (S3), and S2 versus S3 using data from both hemispheres (A); S1 versus S2, S1 versus S3, and S2 versus S3 using data from the affected hemisphere only (B); and S1, S2, and S3 using data from the bilateral versus ipsilateral affected hemispheres (C).
Fig 4
Fig 4. Illustrative computed tomographic perfusion map images for a patient with ischemic stroke.
(A–C) Data were postprocessed using the threshold values adapted to Syngo.via from another commercial software package (setting 1) (A), up-to-date company-recommended threshold values for Syngo.via (setting 2) (B), and older Syngo.via default parameters used in a reference study (setting 3) (C). (D) Limiting the analysis to the affected hemisphere using setting 3 yields a sensible, but faulty estimate of the penumbra and ischemic core volumes, potentially resulting in inaccurate diagnosis.

References

    1. Vagal A, Meganathan K, Kleindorfer DO, et al.. Increasing use of computed tomographic perfusion and computed tomographic angiograms in acute ischemic stroke from 2006 to 2010. Stroke. 2014;45:1029–1034. 10.1161/STROKEAHA.113.004332 - DOI - PubMed
    1. Sanossian N, Fu KA, Liebeskind DS, Starkman S, et al.. Utilization of emergent neuroimaging for thrombolysis-eligible stroke patients. J Neuroimaging. 2017;27:59–64. 10.1111/jon.12369 - DOI - PMC - PubMed
    1. Goyal M, Menon BK, van Zwam WH, et al.. Endovascular thrombectomy after large-vessel ischaemic stroke: A meta-analysis of individual patient data from five randomised trials. Lancet. 2016;387:1723–1731. 10.1016/S0140-6736(16)00163-X - DOI - PubMed
    1. Berkhemer OA, Fransen PS, Beumer D, et al.. A randomized trial of intraarterial treatment for acute ischemic stroke. N Engl J Med. 2015;372:11–20. 10.1056/NEJMoa1411587 - DOI - PubMed
    1. Campbell BC, Mitchell PJ, Kleinig TJ, et al.. Endovascular therapy for ischemic stroke with perfusion-imaging selection. N Engl J Med. 2015;372:1009–1018. 10.1056/NEJMoa1414792 - DOI - PubMed

Publication types