. 2021 Jun 7;218(6):e20200303.
doi: 10.1084/jem.20200303.

IFITM3 incorporation sensitizes influenza A virus to antibody-mediated neutralization

Affiliations

IFITM3 incorporation sensitizes influenza A virus to antibody-mediated neutralization

Caroline Lanz et al. J Exp Med. .

Abstract

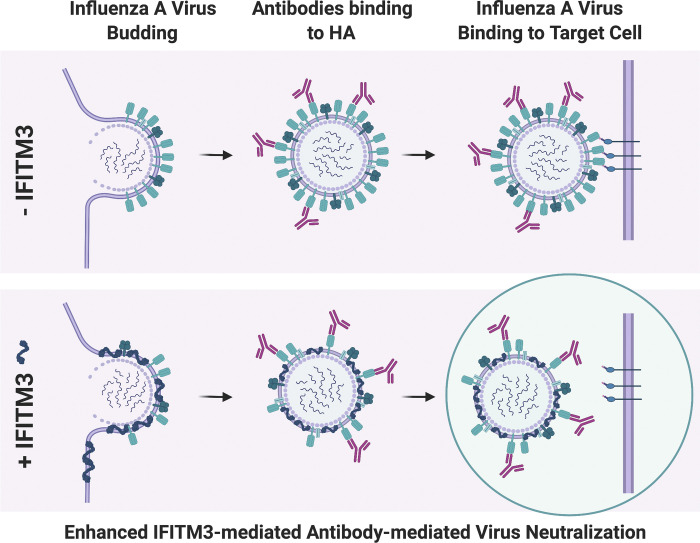
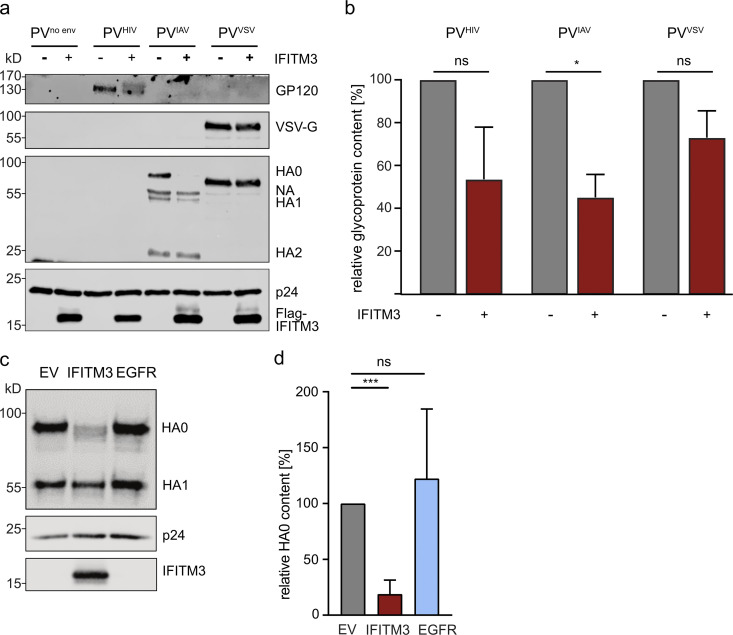
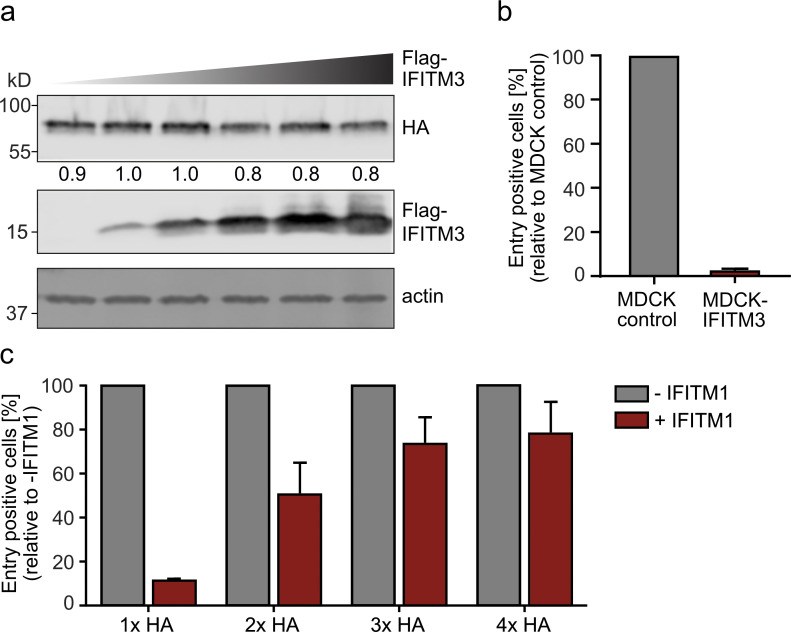
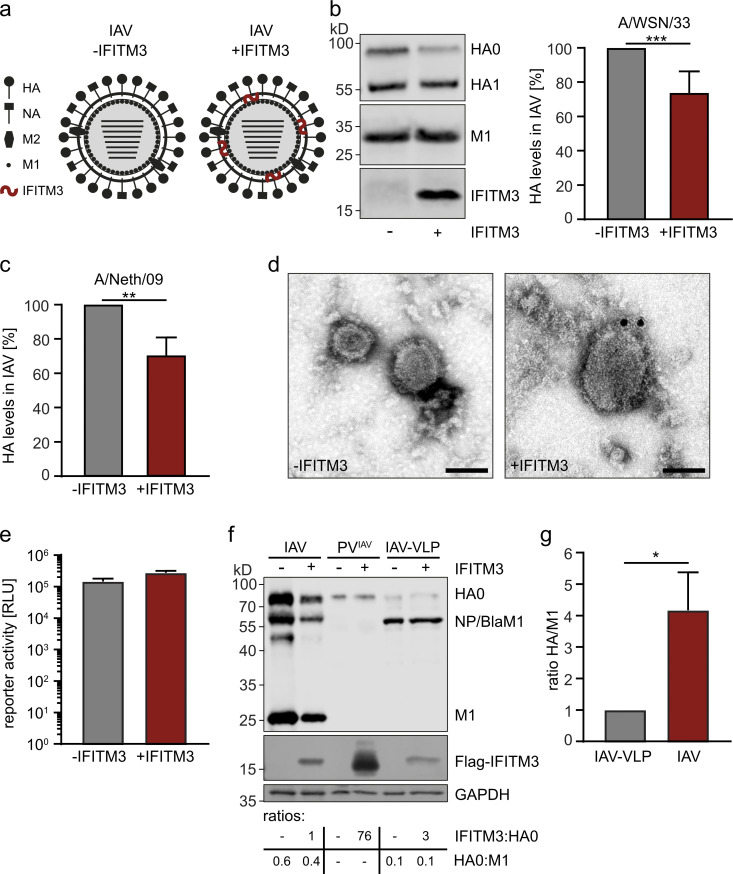
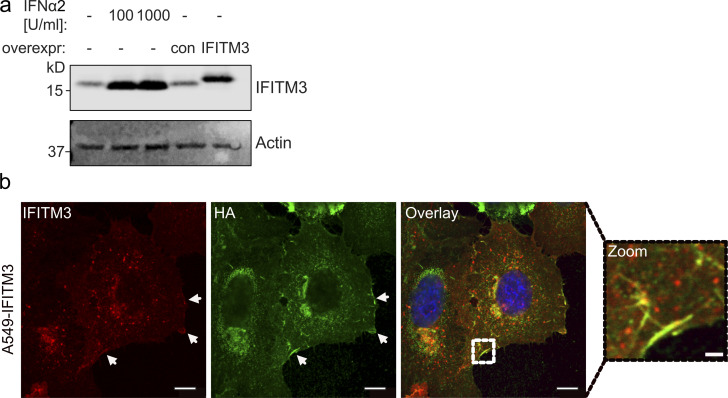
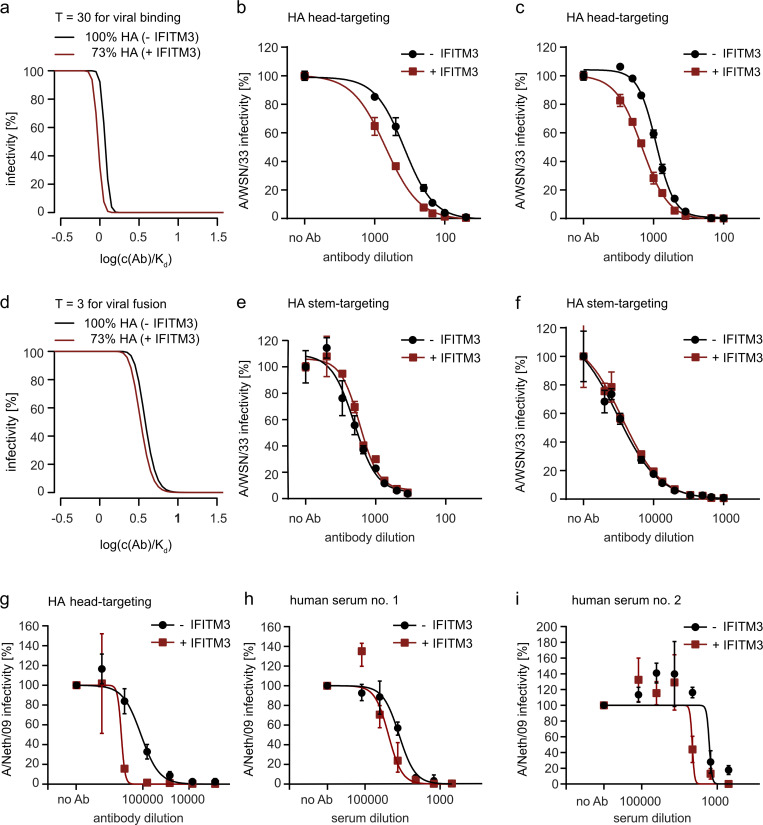
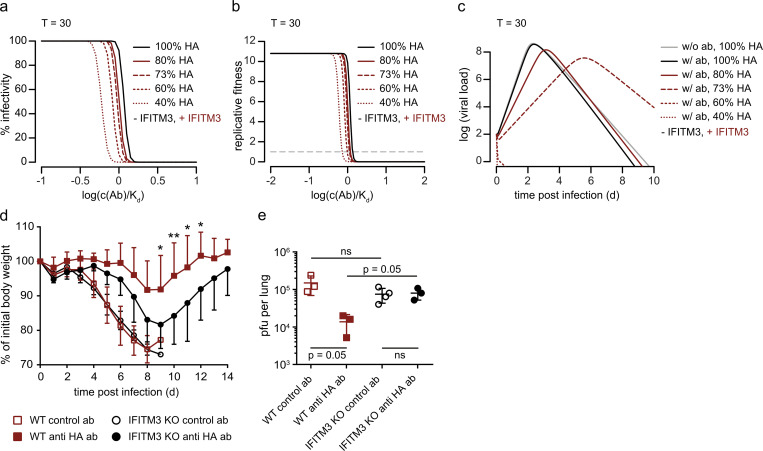
The disease severity of influenza is highly variable in humans, and one genetic determinant behind these differences is the IFITM3 gene. As an effector of the interferon response, IFITM3 potently blocks cytosolic entry of influenza A virus (IAV). Here, we reveal a novel level of inhibition by IFITM3 in vivo: We show that incorporation of IFITM3 into IAV particles competes with incorporation of viral hemagglutinin (HA). Decreased virion HA levels did not reduce infectivity, suggesting that high HA density on IAV virions may be an antagonistic strategy used by the virus to prevent direct inhibition. However, we found that IFITM3-mediated reduction in HA content sensitizes IAV to antibody-mediated neutralization. Mathematical modeling predicted that this effect decreases and delays peak IAV titers, and we show that, indeed, IFITM3-mediated sensitization of IAV to antibody-mediated neutralization impacts infection outcome in an in vivo mouse model. Overall, our data describe a previously unappreciated interplay between the innate effector IFITM3 and the adaptive immune response.


Conflict of interest statement

Disclosures: The authors declare no competing interests exist.

Figures

None
Graphical abstract
Figure 1.
Figure 1.
IFITM3 present in producer cells restricts the entry capacity of PVs carrying IAV and HIV-1 envelopes. (a) Schematic depiction of the HIV-1–based PVs carrying IAV envelopes (PVIAV) produced in the absence or presence of IFITM3. (b) PVs were purified and concentrated by ultracentrifugation through a 20% sucrose cushion, normalized via p24 ELISA, and analyzed by Western blot. Membrane was stained with anti-Flag and anti-p24 antibodies. (c and d) A549 cells (c) or TZM-bl cells (d) were infected for 48 h with the indicated PVs produced in the absence or presence of IFITM3. Luciferase was measured and infectivity was calculated by setting values obtained from PVs produced in the absence of IFITM3 to 100%. (e) A549 cells were infected for 48 h with the indicated PVs produced in the absence or presence of IFITM3 or EGFR. Luciferase was measured and infectivity was calculated by setting values obtained from PVs produced in the presence of the vector control (EV) to 100%. (c–e) Mean values from three biological replicates, each performed in triplicates, are shown. Error bars represent SD. Statistical significance was assessed by a paired two-tailed Student’s t test. **, P < 0.01; ****, P < 0.0001.
Figure S1.
Figure S1.
IFITM3 reduces PV infectivity at the level of producer and target cell for IAV and HIV-1 but not for VSV in an HIV-1–based PV system. (a and b) A549 cells (a) or TZM-bl cells (b) were infected for 48 h with the indicated PVs produced in the absence of IFITM3. Luciferase expression obtained after infection with PVno env was set to 1 and used to normalize luciferase values. Mean values from at least three independent replicates are shown with error bars representing SD. (c) Schematic depiction of PVIAV produced in the absence or presence of IFITM3 and the cell lines, which were control transduced or transduced to stably express IFITM3. (d) A549 control cells or A549-IFITM3 cells were infected for 48 h with PVIAV produced in the absence or presence IFITM3. Luciferase activity was measured and infectivity calculated by setting values obtained for A549 control cells infected with PVIAV produced in the absence of IFITM3 to 100%. (e) TZM-bl control cells or TZM-bl-IFITM3 cells were infected for 48 h with PVHIV produced in the absence or presence IFITM3. Luciferase activity was measured and infectivity calculated by setting values obtained for TZM-bl control cells infected with PVHIV produced in the absence of IFITM3 to 100%. (f) TZM-bl control cells or TZM-bl-IFITM3 cells were infected for 48 h with PVVSV produced in the absence or presence of IFITM3. Luciferase activity was measured and infectivity calculated by setting values obtained for TZM-bl control cells infected with PVVSV produced in the absence of IFITM3 to 100%. (d–f) Mean values from three biological replicates, each performed in triplicates, are shown with error bars representing SD. Statistical significance was assessed by a paired two-tailed Student’s t test (*, P < 0.05; **, P < 0.01), comparing infectivity in the different conditions with infectivity of PVs produced in the absence of IFITMs on IFITM3-negative cells.
Figure 2.
Figure 2.
IFITM3 in VLP-producing cells restricts the entry capacity of IAV-VLPs by outcompeting HA incorporation. (a) Schematic depiction of IAV-VLPs produced in the absence or presence of IFITM3. (b) VLPs were purified by ultracentrifugation and analyzed by Western blot using a polyclonal antibody against A/WSN/33 and an antibody against IFITM3. A representative blot is shown on the left, and the quantification of HA band intensities normalized to BlaM1 levels from three independent batches of VLPs is shown on the right. Statistical significance was assessed by an unpaired two-tailed Student’s t test. *, P < 0.05. (c) The NA content of VLPs was determined using the NA-Star Influenza Neuraminidase Inhibitor Resistance Detection Kit. Bars represent the mean of three biological replicates with the error bars representing SD. Statistical significance was assessed by an unpaired two-tailed Student’s t test. (d) IAV-VLPs produced in the presence or absence of IFITM3 were normalized via Western blot for equal M1 levels and used to infect MDCKII cells. VLP entry-positive cells were assessed by flow cytometry, and infectivity was normalized to the values obtained for VLPs produced in the absence of IFITM3. Bars represent the mean of three biological replicates, with the error bars representing SD. Statistical significance was assessed by a paired two-tailed Student’s t test. **, P < 0.01. (e) A549 (top) or 293T cells (bottom) were transfected with HA- and IFITM3-expressing constructs for 24 h, and then fixed and stained for HA (green) and IFITM3 (red). Samples were analyzed by confocal microscopy. Representative cells are shown with areas of colocalization highlighted at higher magnification. Scale bars correspond to 15 µm (A549), 5 µm (293T), or 1 µm (both zoom images). (f) IAV-VLPs with increasing amounts of HA were produced in the presence or absence of IFITM3 and analyzed by Western blot. Membrane was stained using a polyclonal antibody against A/WSN/33 proteins and a Flag antibody. HA and Flag-IFITM3 band intensities were determined and normalized to BlaM1. A quantification of the levels of HA and IFITM3 in relation to the strongest band are given below the respective Western blots. (g) IAV-VLPs containing increasing amounts of HA were produced in the absence or presence of IFITM3 and were used to infect MDCKII cells. For each condition, infectivity of VLPs produced in the absence of IFITM3 was set to 100%. Bars represent the mean of three biological replicates with the error bars representing SD. (h) IAV-VLPs containing increasing amounts of NA were produced in the absence or presence of IFITM3 and were used to infect MDCKII cells. For each condition, infectivity of VLPs produced in the absence of IFITM3 was set to 100%. Bars represent the mean of two biological replicates with the error bars representing SD.
Figure S2.
Figure S2.
PVHIV and PVIAV display decreased glycoprotein levels when produced in IFITM3-expressing cells but not in EGFR-expressing cells. (a and b) The PV samples described in Fig. 1 were analyzed by Western blot using antibodies against p24, Flag, HIV-1 Env, VSV-G, and A/WSN/33 proteins. A representative blot (a), as well as the quantification of normalized GP120, HA, or VSV-G signal intensities from Western blots performed using three independent PV batches (b), are shown. Statistical significance was assessed by a paired two-tailed Student’s t test. *, P < 0.05. The blots for p24 and Flag-IFITM3 are already shown in Fig. 1 b and are shown again here as input controls. (c and d) PVs PVIAV were produced in the presence of IFITM3 or EGFR or a vector control (EV), purified by ultracentrifugation through a 20% sucrose cushion, and analyzed by Western blot. Membrane was stained with anti-IFITM3, anti-p24, and anti-HA antibodies. A representative blot is shown in panel c, and a quantification of HA0 content from three independent batches of PVIAV is depicted in panel d. Error bars represent SD. Statistical significance was assessed by a paired two-tailed Student’s t test. ***, P < 0.001.
Figure S3.
Figure S3.
IFITM3 expression does not lead to reduced cellular HA levels, and IFITM3 shares the ability to reduce IAV-VLP infectivity with IFITM1. (a) HEK 293T cells were cotransfected with pCAGGS-HA and increasing amounts of pCAGGS-Flag-IFITM3. Whole-cell lysates were analyzed by Western blot and membrane was stained for HA, Flag, and actin. Expression levels of HA0 in relation to the strongest band are given below the blot. (b) MDCK control and MDCK-IFITM3 cells were infected with IAV-VLPs produced in the absence of IFITM3. Entry-positive cells relative to MDCK control cells are shown from three independent biological replicates with error bars representing SD. (c) IAV-VLPs containing increasing amounts of HA were produced in the absence or presence of IFITM1 and were used to infect MDCKII cells. For each condition, infectivity of IAV-VLPs produced in the absence of IFITM1 was set to 100%. Bars represent the mean of two biological replicates with the error bars representing SD.
Figure 3.
Figure 3.
IFITM3 incorporates into IAV particles, but its antiviral effect is antagonized by high HA density. (a) Schematic depiction of IAV produced in the absence or presence of IFITM3. (b) A549 control or A549-IFITM3 cells were infected with IAV strain A/WSN/33 at MOI 0.01 PFU/cell for 48 h in case of the control cells or 72 h in case of the IFITM3-expressing cells. Viruses in the supernatants were purified by ultracentrifugation and analyzed by Western blot for HA, M1, and IFITM3. A representative blot is shown on the left, and the quantification of HA band intensities normalized to M1 levels from six independent batches of viruses is shown on the right. Statistical significance was assessed by an unpaired two-tailed Student’s t test. ***, P < 0.0005. (c) IAV strain A/Netherlands/602/2009 (A/Neth/09) was grown on MDCK control or MDCK-IFITIM3 cells, purified by ultracentrifugation, and analyzed by Western blot for HA, M1, and IFITM3. HA band intensities from four independent sets of virus preparations were measured, normalized to M1 levels, and plotted relative to normalized HA levels for virus grown in the absence of IFITM3. Error bars represent SD, and statistical significance was assessed by an unpaired two-tailed Student’s t test. **, P < 0.005. (d) The purified viruses described in panel b were analyzed by immuno-electron microscopy using a polyclonal anti-IFITM3 antibody. Scale bars correspond to 100 nm. (e) HEK 293T cells were transfected with a reporter plasmid encoding firefly luciferase in complementary reverse orientation flanked by IAV noncoding regions, thus mimicking a viral genome segment. Cells were subsequently infected with the viruses described in panel b, which were input normalized by RT-qPCR. Luciferase signal was measured as relative light units (RLUs) 48 h after infection. Bars represent the mean of three biological replicates with the error bars representing SD. (f) A549 control or A549-IFITM3 cells infected with A/WSN/33 (from panel b), PVIAV-producing cells (from Fig. 1, b and c), and IAV-VLP producer cells (from Fig. 2, b–d) were lysed and analyzed by Western blot using a polyclonal antibody against A/WSN/33 proteins and antibodies against Flag and GAPDH. Relative Flag-IFITM3:HA0 and HA0:M1 ratios for each condition are given below the Western blot. (g) IAV-VLPs produced in the absence or presence of IFITM3 and viruses grown on A549 control or A549-IFITM3 cells were compared side by side in Western blots stained for HA and M1. The average ratios of HA levels normalized to M1 levels from three independent batches of VLPs or viruses are shown. Statistical significance was assessed by an unpaired two-tailed Student’s t test. *, P < 0.05.
Figure S4.
Figure S4.
IFITM3 is expressed to similar levels in A549-IFITM3 and IFN-treated A549 cells and colocalizes with HA during IAV infection. (a) A549 cells were treated with 0, 100, or 1,000 U/ml IFN-α2 for 16 h before cells were lysed. In parallel, lysates of A549 control cells or A549-IFITM3 cells were prepared, and all lysates were tested for IFITM3 expression by Western blot. Actin staining was included as loading control. (b) A549-IFITM3 cells were infected with A/WSN/1933 (MOI 1) for 16 h. Cells were fixed and stained for DAPI (blue), HA (green), and IFITM3 (red). Samples were analyzed by confocal microscopy and a representative cell is shown with the indicated zoom area. Areas of colocalization at the plasma membrane are highlighted by arrows. Scale bars correspond to 25 µm or 1.5 µm for the higher magnification.
Figure 4.
Figure 4.
Incorporation of IFITM3 into IAV increases sensitivity to antibody-mediated neutralization. (a) Predicted inhibition curves of antibodies interfering with IAV binding to host cells for IAV with regular trimer number (300 trimers/virion, black line) and a trimer number reduced by 27% as observed upon IFITM3 incorporation (219 trimers/virion, red line). (b and c) IAV A/WSN/33 produced in A549 control or A549-IFITM3 cells was input normalized by RT-qPCR and incubated with different dilutions of a monoclonal anti-A/WSN/33 HA antibody (b) or a polyclonal rabbit serum raised against IAV strain A/WSN/33 (c) before being used to infect MDCK cells. Cells were fixed 5.5 h after infection, and infectivity was assessed by microscopy-based quantification of NP-positive cells. Curves are derived from three independent experiments, and error bars represent SD. (d) Predicted inhibition curves of antibodies inhibiting viral fusion for IAV with regular trimer number (300 trimers/virion, black line) and reduced trimer number (219 trimers/virion, red line). (e and f) IAV A/WSN/33 produced in A549 control or A549-IFITM3 cells was input normalized by RT-qPCR and incubated with different dilutions of the broadly neutralizing stem-specific monoclonal antibody mAb 1.12 (e) or the broadly neutralizing stem-specific monoclonal antibody mAb 3.1 (f) before being used for infecting MDCKII cells. Cells were fixed 5.5 h after infection and infectivity was assessed by microscopy-based quantification of NP-positive cells. Curves are derived from three independent experiments, and error bars represent SD. (g–i) IAV strain A/Netherlands/602/2009 (A/Neth/09) produced in MDCK control or MDCK-IFITM3 cells was input normalized and incubated with different dilutions of a monoclonal anti-A/Neth/09 HA antibody (g) or two different polyclonal human sera from individuals vaccinated against pandemic 2009 IAV (h and i) before being used to infect MDCK cells. Cells were lysed 7 h after infection and infectivity was assessed by RT-qPCR for the M segment. Curves are derived from three independent experiments, and error bars represent SD.
Figure 5.
Figure 5.
IFITM3 sensitizes IAV to antibody-mediated neutralization in vivo. (a) Predicted inhibition curves of antibodies interfering with IAV binding to host cells for IAV with regular trimer number (300 trimers/virion, black line) and reduced trimer numbers (reduction to 80%, 73%, 60%, and 40% HA content, red lines). (b) Predicted replicative fitness of IAV with regular trimer number (300 trimers/virion, black line) and reduced trimer numbers (reduction to 80%, 73%, 60%, and 40% HA content, red lines) as a function of antibody concentrations. Modeling was performed for antibodies inhibiting virus binding to host cells. (c) Predicted virus dynamics in the presence of antibodies acting on the stage of binding for virus stocks with and without IFITM3 incorporation. The antibody concentration was chosen such that the fitness difference for virus stocks with and without IFITM3 incorporation is maximal. (d) Morbidity after lethal challenge with PR8 virus (80 PFU) in the presence of a low dose of a PR8 HA head-specific monoclonal antibody (0.375 mg/kg) or a control antibody. Error bars represent SD. Statistically significant differences due to the absence of IFITM3 in mice that received PR8 HA head-specific antibody treatment (n = 7–9 mice/group) were assessed by two-way ANOVA with repeated measures. *, P < 0.05; **, P < 0.01. (e) Lung virus titers at 6 d after infection with PR8 virus are reduced by a low dose of a PR8 HA head-specific monoclonal antibody in WT but not in IFITM3 knockout mice (n = 3–4 mice/group). Error bars represent SD. Statistical significance was assessed by a one-sided Wilcoxon rank sum test. Note that with sample sizes of three data points per group, the smallest P value possible in a Wilcoxon rank sum test is P = 0.05.
Figure S5.
Figure S5.
A high dose of an HA head-specific antibody can protect WT and IFITM3 knockout mice from disease. (a) Lungs from three IAV-infected WT and three IAV-infected IFITM3 knockout mice were harvested, homogenized, and analyzed by Western blot for IFITM3 and viral NP levels. (b) Morbidity upon lethal PR8 challenge (80 PFU) in IFITM3 knockout and WT mice 4 h after administration of a high dose of a PR8 HA head-specific antibody (2.5 mg/kg) or a control antibody. Error bars represent SD.

References

    1. Ahi, Y.S., Yimer D., Shi G., Majdoul S., Rahman K., Rein A., and Compton A.A.. 2020. IFITM3 Reduces Retroviral Envelope Abundance and Function and Is Counteracted by glycoGag. MBio. 11:e03088-19. 10.1128/mBio.03088-19 - DOI - PMC - PubMed
    1. Allen, E.K., Randolph A.G., Bhangale T., Dogra P., Ohlson M., Oshansky C.M., Zamora A.E., Shannon J.P., Finkelstein D., Dressen A., et al. . 2017. SNP-mediated disruption of CTCF binding at the IFITM3 promoter is associated with risk of severe influenza in humans. Nat. Med. 23:975–983. 10.1038/nm.4370 - DOI - PMC - PubMed
    1. Appourchaux, R., Delpeuch M., Zhong L., Burlaud-Gaillard J., Tartour K., Savidis G., Brass A., Etienne L., Roingeard P., and Cimarelli A.. 2019. Functional Mapping of Regions Involved in the Negative Imprinting of Virion Particle Infectivity and in Target Cell Protection by Interferon-Induced Transmembrane Protein 3 against HIV-1. J. Virol. 93:e01716-18. 10.1128/JVI.01716-18 - DOI - PMC - PubMed
    1. Baccam, P., Beauchemin C., Macken C.A., Hayden F.G., and Perelson A.S.. 2006. Kinetics of influenza A virus infection in humans. J. Virol. 80:7590–7599. 10.1128/JVI.01623-05 - DOI - PMC - PubMed
    1. Bailey, C.C., Huang I.C., Kam C., and Farzan M.. 2012. Ifitm3 limits the severity of acute influenza in mice. PLoS Pathog. 8:e1002909. 10.1371/journal.ppat.1002909 - DOI - PMC - PubMed

Publication types

MeSH terms

Substances