. 2021 Apr 20;35(3):109022.
doi: 10.1016/j.celrep.2021.109022.

Restoration of visual function in advanced disease after transplantation of purified human pluripotent stem cell-derived cone photoreceptors

Affiliations

Restoration of visual function in advanced disease after transplantation of purified human pluripotent stem cell-derived cone photoreceptors

Joana Ribeiro et al. Cell Rep. .

Abstract

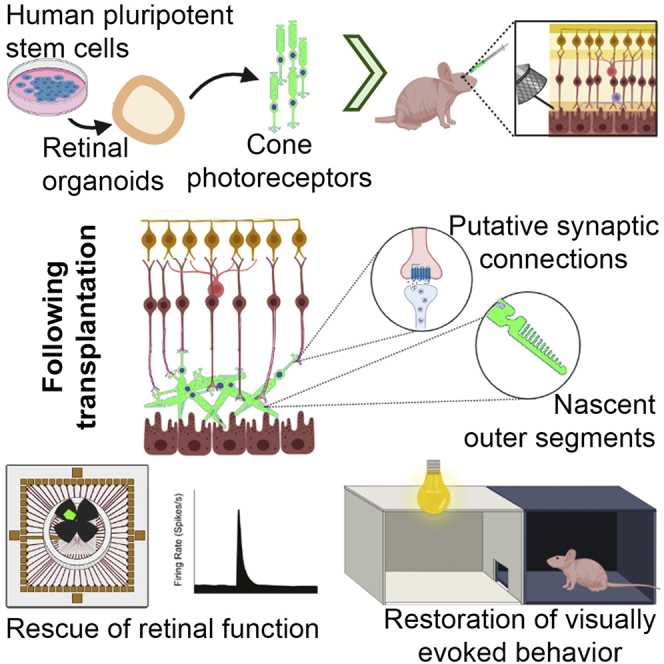
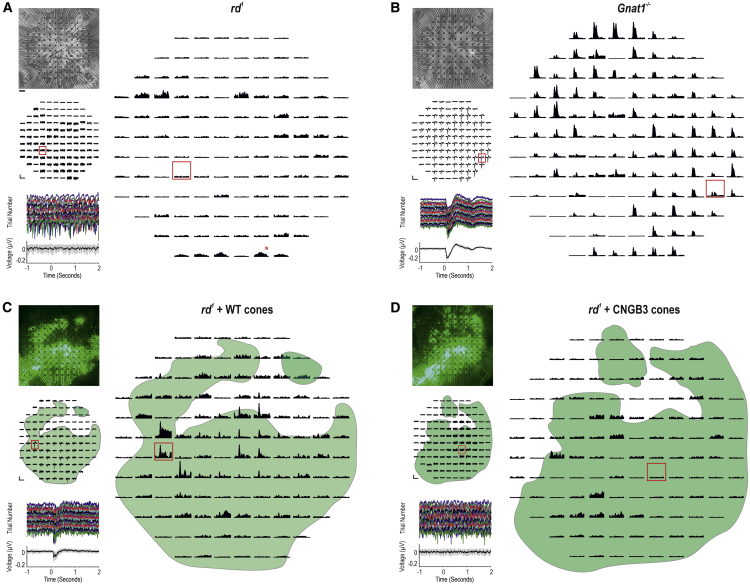
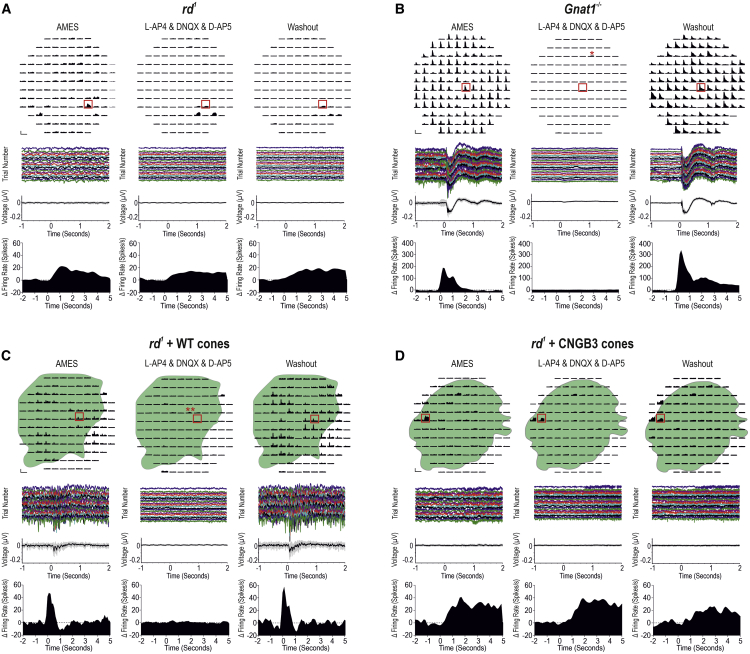
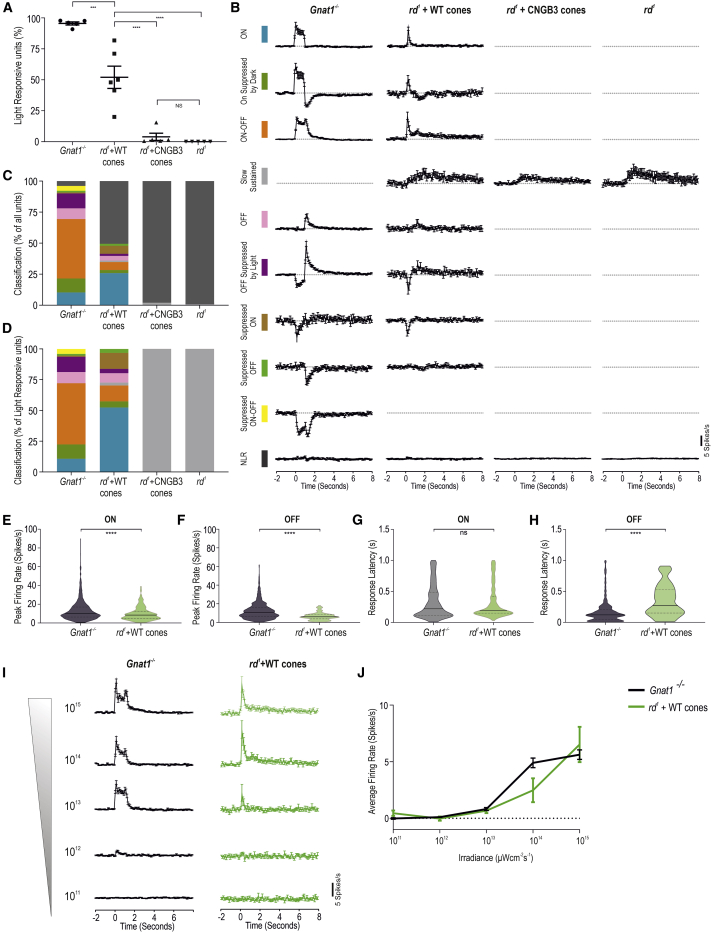
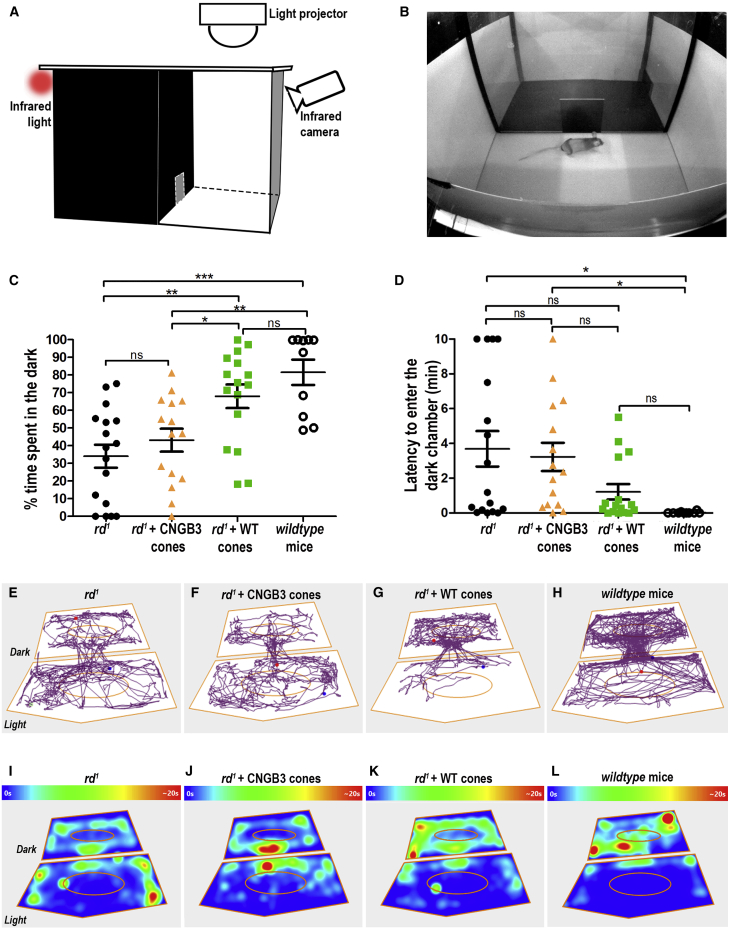
Age-related macular degeneration and other macular diseases result in the loss of light-sensing cone photoreceptors, causing irreversible sight impairment. Photoreceptor replacement may restore vision by transplanting healthy cells, which must form new synaptic connections with the recipient retina. Despite recent advances, convincing evidence of functional connectivity arising from transplanted human cone photoreceptors in advanced retinal degeneration is lacking. Here, we show restoration of visual function after transplantation of purified human pluripotent stem cell-derived cones into a mouse model of advanced degeneration. Transplanted human cones elaborate nascent outer segments and make putative synapses with recipient murine bipolar cells (BCs), which themselves undergo significant remodeling. Electrophysiological and behavioral assessments demonstrate restoration of surprisingly complex light-evoked retinal ganglion cell responses and improved light-evoked behaviors in treated animals. Stringent controls exclude alternative explanations, including material transfer and neuroprotection. These data provide crucial validation for photoreceptor replacement therapy and for the potential to rescue cone-mediated vision.

Keywords: cell therapy; cone photoreceptor; degeneration; electrophysiology; macular degeneration; outer segment; rescue; retinal organoid; transplantation; visual function.


Conflict of interest statement

Declaration of interests The authors declare no competing interests.

Figures

None
Graphical abstract
Figure 1
Figure 1
Isolation and transplantation of a pure population of human cones (A) Three-month rd1/FoxN1nu (rd1) central retina. Few, if any, mouse Cone Arrestin+ (mCarr; green) host cones were seen in the central retina. See Figure S1C for examples of cells in peripheral retina. n = 4 retinas. (B) Representative FACS plot for sorting of L/Mopsin.GFP+ hESC-derived WT cones. Live, single GFP+ cells were sorted for purity. n = 16 FACS experiments. (C) Viral infection with AAV.L/Mopsin.GFP targeting cone photoreceptors was equally efficient in both cell lines (mean ± SEM; n = 9 FACS experiments, WT line; n = 7 FACS experiments, CNGB3 line; unpaired t test). (D) Viability and purity following FACS was assessed by plating and staining sorted cells for a human cone-specific marker, hCARR (red). hCARR+/GFP+ (solid arrows, ROI1 and ROI2) and hCARR+/GFP−ve (arrowheads, ROI2 and ROI3) were observed. The few pyknotic cells were, without exception, hCARR−ve (open arrows, ROI3). (E) Quantification of cell viability of FAC-sorted cells, assessed by morphology of the nuclei (93% ± 2%, healthy nuclei; 7% ± 2%, pyknotic nuclei; n = 58 images, n = 2,047 cells) after plating. (F) Quantification and verification of purity of the transplanted donor cell population. 99% of healthy cells were hCARR+ (59% ± 3% hCARR+/GFP+ and 40% ± 3% hCARR+/GFP versus 1% ± 1% hCARR/GFP; n = 58 images, n = 1,975 cells), despite variable levels of GFP expression. (G) Montage image showing best spread of GFP+ cells, 12 weeks following transplantation of WT cones. (H and I) L/Mopsin.GFP+ hESC-derived WT cones in the subretinal space (SRS) of 6-month-old rd1 mice. GFP levels were very variable between cells (compare solid arow and open arrow). Almost all cells in the SRS expressed human nuclear antigen (HNA) (89% ± 7%), although a proportion of these had little detectable GFP (24% ± 5% HNA+/GFP−ve; mean ± SEM; n = 6 images, n = 6 animals; arrowheads). HNA+/GFP+ cells (76% ± 5%) extended processes toward the host retina (arrows). (J) Host mCARR+ cones (red; arrowhead) did not express HNA. (K) HNA−ve host and HNA+ve human donor cones exhibited a significant difference in nuclear size (6 ± 1 μm versus 9 ± 1 μm, respectively; p < 0.001, Mann-Whitney test; mean ± SD, n > 3 retinas, n = 20 nuclei). Scale bars, 25 μm (A, D, H, and J); 100 μm (G). GCL, ganglion cell layer; INL, inner nuclear layer; IPL, inner plexiform layer.
Figure 2
Figure 2
Maturation of human WT cones following transplantation as a purified cell suspension into the rd1/FoxN1nu model of advanced degeneration (A) Quantification of percentage of cells in SRS that were MOPSIN+ and formed segment-like structures as a proportion of HNA+ nuclei found within the cell mass (81% ± 6% MOPSIN+ cells versus 82% ± 2%, WT versus CNGB3, no significant [N.S.] differences between WT versus CNGB3, Mann-Whitney test; mean ± SEM). A proportion of these cells displayed MOPSIN localized to nascent segment-like structures (17% ± 3% versus 13% ± 1%, WT versus CNGB3; N.S., Mann-Whitney test). (B) GFP+ cells (green) expressing hCARR (white) and MOPSIN (red), which localized to nascent segment-like structures in some cells (ROI1, arrows). Rare host M-cones were identified, but no segment-like structures were associated with these cells (ROI2, arrowhead). (C) Numerous PRPH2+ (red) segment-like structures (arrows) can be seen within the cell mass. ROI1–3, single confocal sections through some segment-like structures. (D) Human (h) mitochondria-rich (white) structures were in close proximity to PRPH+ structures (ROI and dual channel). (E) Quantification of number of PRPH2+ segment-like structures as proportion of nuclei found within the cell mass (25% ± 3% versus 23% ± 4%, WT versus CNGB3; N.S., Mann-Whitney test; mean ± SEM, n > 5 images, n > 5 retinas per group). (F and G) Representative TEM images of structures consistent with mitochondria-rich ISs and stacked disks of OSs (ROI). Scale bars, 25 μm (A–D); 12.5 μm (ROIs in B and D); 0.5 μm (ROI in F and G). IS, inner segment; OS, outer segment.
Figure 3
Figure 3
Remodeling of host rd1 retina and formation of putative synaptic-like connections (A) Large numbers of GFP+ WT cones in close proximity to the host inner retina. Host rd1/FoxN1nu (rd1) PKC-α+ rod bipolar cells (BCs) extended processes into the cell mass (ROI1, ROI2, arrowheads). Post-synaptic protein, mGluR6, was seen within those processes (ROI1, ROI2, arrows). (B) BCs do not extend dendrites beyond the inner retina, and mGluR6 is not expressed in untreated eyes. (C) Vesicular glutamate transporter 1 (VGLUT1) was seen in the cell mass in close proximity to host rd1 BC dendrites (ROI1–3). (D) Pre-synaptic protein Synaptophysin was present in the host IPL and in transplanted GFP+ cones. (E and F) In areas of high donor cell density, numerous putative RIBEYE/mGluR6 complexes were seen in close proximity to one another (ROIs). Images are representative of n = 10 WT and n = 8 CNGB3-transplanted eyes. (G) TEM image showing presence of ribbon synapses (arrows), including multiple ribbons within a single terminal (left), within the area of injection. Scale bars, 25 μm (A–C and E); 12.5 μm (ROI2 in A and F); 3 μm (ROI1 in A, ROI3 in C and F); 500 nm (G).
Figure 4
Figure 4
Transplantation of human WT cones generates widespread mERGs and light-evoked spiking activity in the host rd1 retina (A, top left) Representative untreated rd1/FoxN1nu (rd1) retina on MEA. (Middle left) There were no discernible light-evoked mERGs from the same retina. (Bottom left) Magnified trace from a representative channel (red box) shows individual trials and mean (±SD) (bottom). (Right) PSTH (mean ± SEM) of multi-unit spiking. The majority of channels are non-light responsive. A few channels show slow, sustained, deafferented ipRGC responses following light onset (red asterisk). (B, top left) Representative Gnat1−/− retina. (Middle left) Most channels exhibit light-evoked mERGs. (Bottom left) Magnified trace (red box) shows reproducibility of mERG across individual trials and mean (±SD) (bottom). (Right) The same channels show transient, large-amplitude changes in firing rate at light onset and/or offset. (C, top left) Representative rd1 + WT cone-transplanted retina. (Middle left) mERGs are present on a large proportion of channels and correlate with position of GFP+ cell mass (green overlay). (Bottom left) Magnified trace (red box) shows reproducibility of the response. (Right) A large proportion of channels within cell mass show transient, large-amplitude increases in firing rate at light onset and/or offset. (D, top left) Representative rd1 + CNGB3 cone-transplanted retina. (Middle left) No discernible mERGs were seen. (Bottom left) Magnified trace (red box) demonstrates no light-evoked mERGs. (Right) Most channels are not light responsive; a few channels demonstrated deafferented ipRGC responses following light onset. Scale bars: 100 μV, 3 s (middle panels, A, C, and D); 250 μV, 3 s (middle panels, B); 100 spikes/s, 5 s (right panels, A, C, and D); and 200 spikes/s, 5 s (right panel, B). In (C) and (D), green represents GFP+ve WT cones and GFP+ve CNGB3 cones, respectively. See Table S1 for n values.
Figure 5
Figure 5
Transplanted human WT cones connect to the host rd1 retina through functional glutamatergic synapses in the outer retina Multi-unit spiking activity before, during, and after synaptic blockade. (A) Untreated rd1 retina. Most channels were not light responsive. No discernible mERGs were seen. A few channels demonstrated deafferented ipRGC responses following light onset (red box), which were not eradicated by synaptic blockers, as expected (Wong et al., 2007). (B) Gnat1−/− retina. Transient increases and decreases in firing rate were observed following light onset and/or offset. These were reversibly abolished by synaptic blockers (asterisk [] denotes deafferented ipRGC responses observed only with pharmacological intervention). mERG and multi-unit spiking activity (red box) shows fast cone-driven response, which is reversibly abolished by pharmacological intervention. (C) Rd1 + WT cone-transplanted retina. Transient increases in firing rate correlated with the position of overlying GFP+ve WT cones. Addition of synaptic blockers reversibly abolished these responses (double asterisks [∗∗] denote deafferented ipRGC response visible under synaptic blockade). Light-evoked mERG and multi-unit spiking activity (red box) illustrates WT cone-driven light responses that are both abolished by pharmacological intervention and return following washout. (D) Rd1 + CNGB3 cone-transplanted retina. Most channels were not light responsive. A few channels show a slow, sustained increase in firing rate following light onset (red box) that was unaffected by synaptic blockers, indicating that these responses originate from deafferented ipRGCs. Scale bars: 100 spikes/s, 5 s (A, C, and D); 200 spikes/s, 5 s (B). See Table S1 for n values.
Figure 6
Figure 6
Transplanted human WT cones drive an array of fast, large-amplitude visual responses at physiological light levels (A) Percentage of light-responsive units in rd1 + WT cone-transplanted retina (n = 6) was lower than Gnat1−/− (n = 5) but significantly higher than those in untreated rd1 retinas (p < 0.0001; one-way ANOVA) and rd1 + CNGB3 cone-transplanted retina (p < 0.0001, one-way ANOVA). N.S. difference between untreated rd1 and rd1 + CNGB3 cone (p = 0.96, one-way ANOVA). (B) Average PSTH of single units categorized into 10 quantitatively defined types based on their response to a 1-s light step in Gnat1−/− (n = 1,031 units), rd1 + WT cone (n = 687 units), rd1 + CNGB3 cone (n = 945 units), and untreated rd1 (n = 641 units). Time bin = 0.1 s; lights on at time = 0. (C) Quantification of the distribution of light-response types as a percentage of all single units. (D) Quantification of light-response types as percentage of all light-responsive units. Response types are color coded, as shown in (B). (E and F) Violin plots of response amplitude in rd1 + WT retinas (E) for ON-type responses (9.96 ± 0.47 spikes/s; n = 233) and (F) OFF-type responses (6.50 ± 0.44 spikes/s; n = 80) were significantly smaller than in Gnat1−/− retinas (13.37 ± 0.41 spikes/s, n = 715 and 12.51 ± 0.34 spikes/s, n = 706; p < 0.0001 for both; unpaired t test). (G and H) Violin plots showing latency to peak response for ON and OFF components of light responses. Latency for ON-type responses in rd1 + WT cone-transplanted retinas (322.6 ± 17.13 ms) was not significantly different compared with Gnat1−/− retinas (328.5 ± 10.1 ms; p = 0.77, unpaired t test) but was significantly slower for OFF-type responses (350.1 ± 28.69 ms versus 172.8 ± 7.1 ms; p < 0.0001, unpaired t test). (I) Peristimulus time histogram of light-responsive units in Gnat1−/− (black traces; n = 224 units) and rd1 + WT cone-transplanted retinas (green traces; n = 22 units) in response to a 1-s light step from darkness at six increasing light intensities (time bin = 0.1 s; lights on at time = 0). (J) Change (Δ) in firing rate over the first 400 ms of the light step plotted as a function of light intensity showed an increase in response amplitude with increasing light intensity, which was not significantly different between the two populations at any intensity investigated (p > 0.99, two-way ANOVA). Mean ± SEM.
Figure 7
Figure 7
Transplantation of purified human WT cones leads to improved visually evoked behavior in rd1 mice (A) Schematic of experimental setup showing equally sized light (300 lux) and dark (0 lux at darkest corner) compartments. (B) Camera view of setup and starting placement of mouse in the arena. (C) Plot of mean (±SEM) time spent in dark for untreated rd1/Foxn1nu mice (rd1) (n = 17 mice), rd1 + CNGB3 cones (n = 15), rd1 + WT cones (n = 17), and wild-type mice (n = 10). ∗∗∗p < 0.001, ∗∗p < 0.01, p < 0.05, one-way ANOVA. (D) Latency to cross from light to dark for the first time. p < 0.05, one-way ANOVA. (E–H) Representative tracking plots from individual animals in each group. Blue and red dots denote mouse’s position at start and end of the recording. (I–L) Heatmap shows mean time spent in any given point across all animals within each experimental group. N.B. points > 20 s (max) are marked as red. Ellipsoids define the central area of each compartment.

References

    1. Aghaizu N.D., Kruczek K., Gonzalez-Cordero A., Ali R.R., Pearson R.A. Pluripotent stem cells and their utility in treating photoreceptor degenerations. Prog. Brain Res. 2017;231:191–223. - PubMed
    1. Akiba R., Matsuyama T., Tu H.Y., Hashiguchi T., Sho J., Yamamoto S., Takahashi M., Mandai M. Quantitative and Qualitative Evaluation of Photoreceptor Synapses in Developing, Degenerating and Regenerating Retinas. Front. Cell. Neurosci. 2019;13:16. - PMC - PubMed
    1. Assawachananont J., Mandai M., Okamoto S., Yamada C., Eiraku M., Yonemura S., Sasai Y., Takahashi M. Transplantation of embryonic and induced pluripotent stem cell-derived 3D retinal sheets into retinal degenerative mice. Stem Cell Reports. 2014;2:662–674. - PMC - PubMed
    1. Barber A.C., Hippert C., Duran Y., West E.L., Bainbridge J.W., Warre-Cornish K., Luhmann U.F., Lakowski J., Sowden J.C., Ali R.R., Pearson R.A. Repair of the degenerate retina by photoreceptor transplantation. Proc. Natl. Acad. Sci. USA. 2013;110:354–359. - PMC - PubMed
    1. Barnea-Cramer A.O., Wang W., Lu S.J., Singh M.S., Luo C., Huo H., McClements M.E., Barnard A.R., MacLaren R.E., Lanza R. Function of human pluripotent stem cell-derived photoreceptor progenitors in blind mice. Sci. Rep. 2016;6:29784. - PMC - PubMed

Publication types

MeSH terms