. 2021 Apr 20;35(3):109001.
doi: 10.1016/j.celrep.2021.109001.

Chronic loss of inhibition in piriform cortex following brief, daily optogenetic stimulation

Affiliations

Chronic loss of inhibition in piriform cortex following brief, daily optogenetic stimulation

Brendan Ryu et al. Cell Rep. .

Abstract

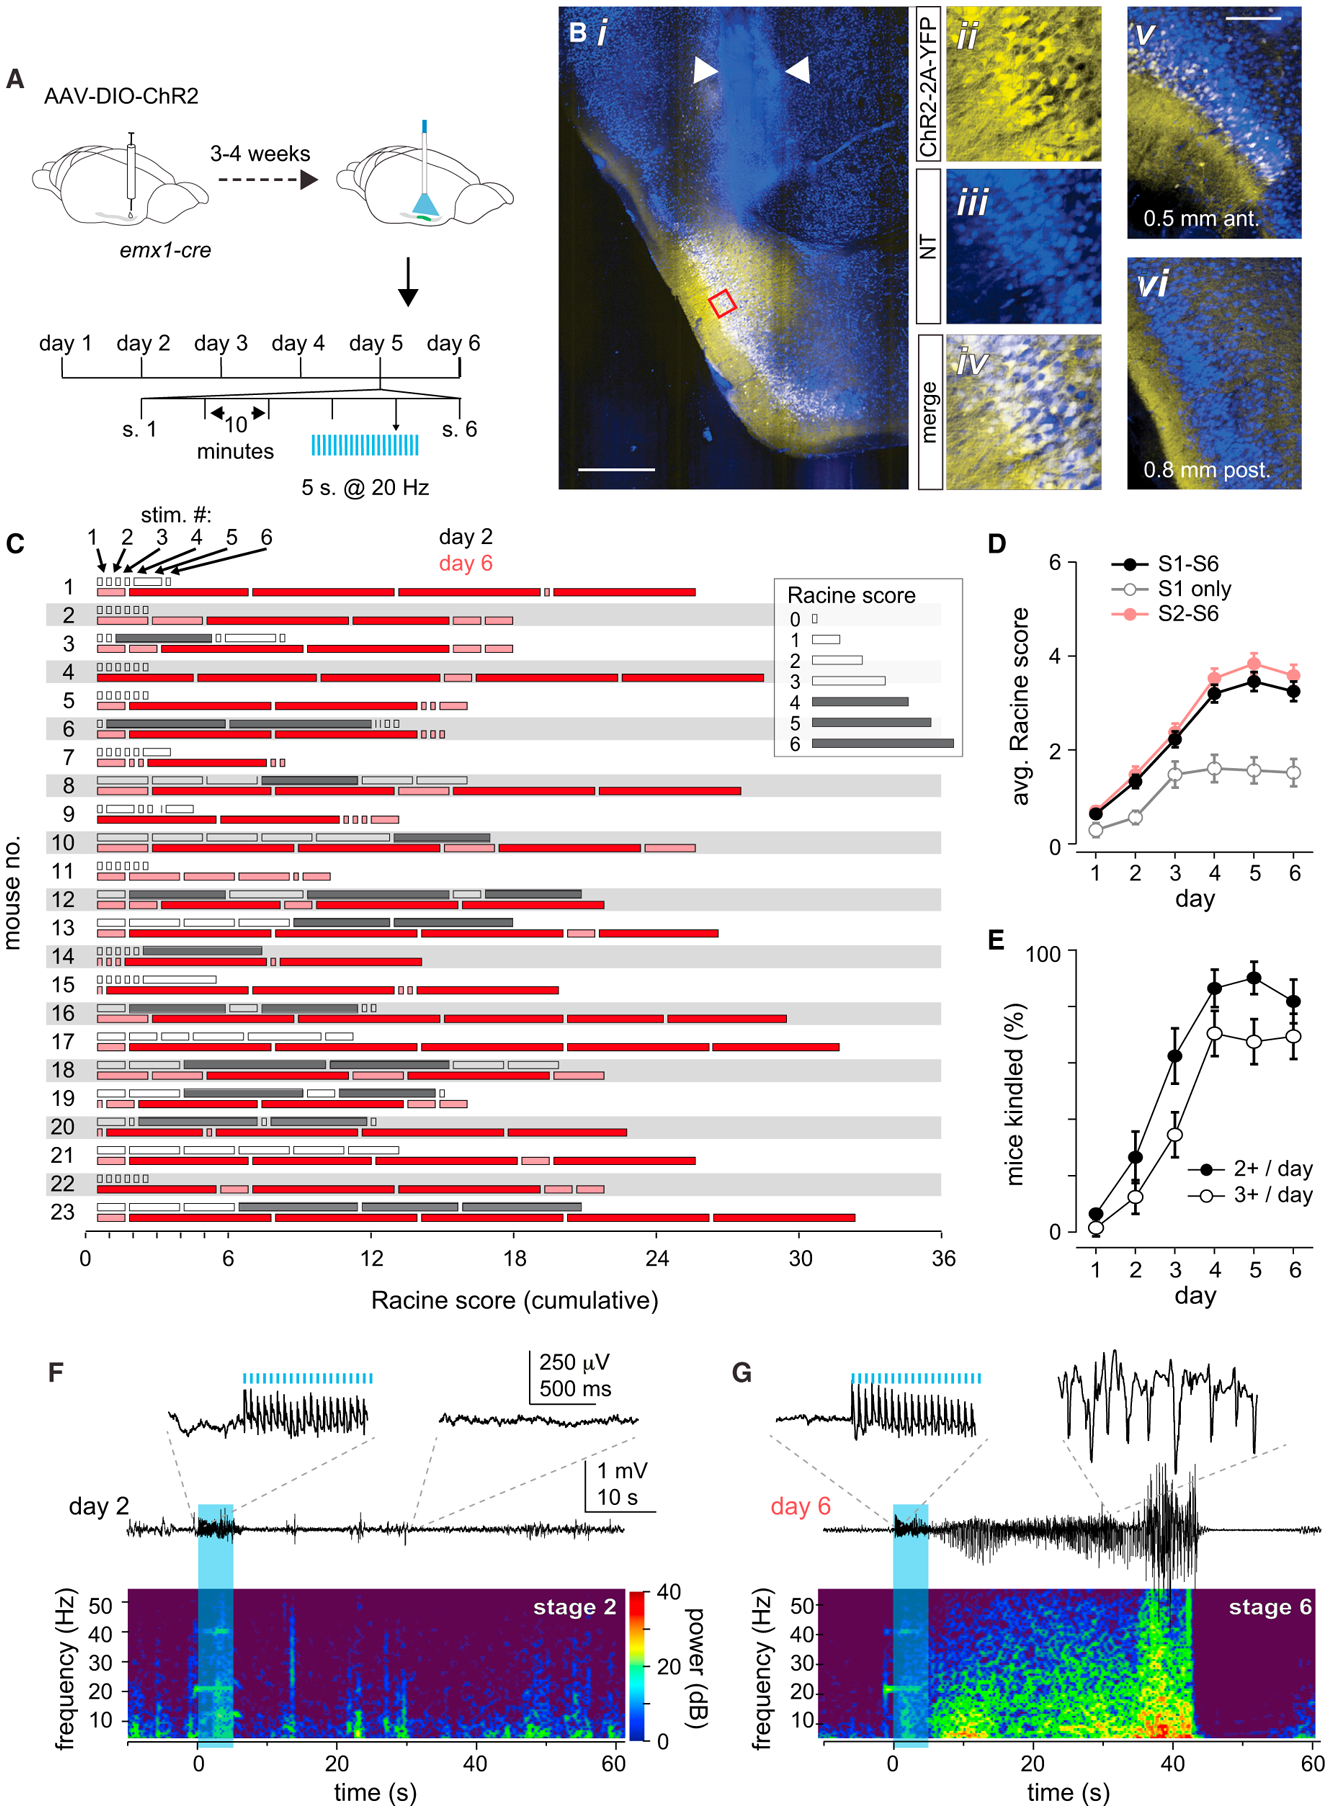
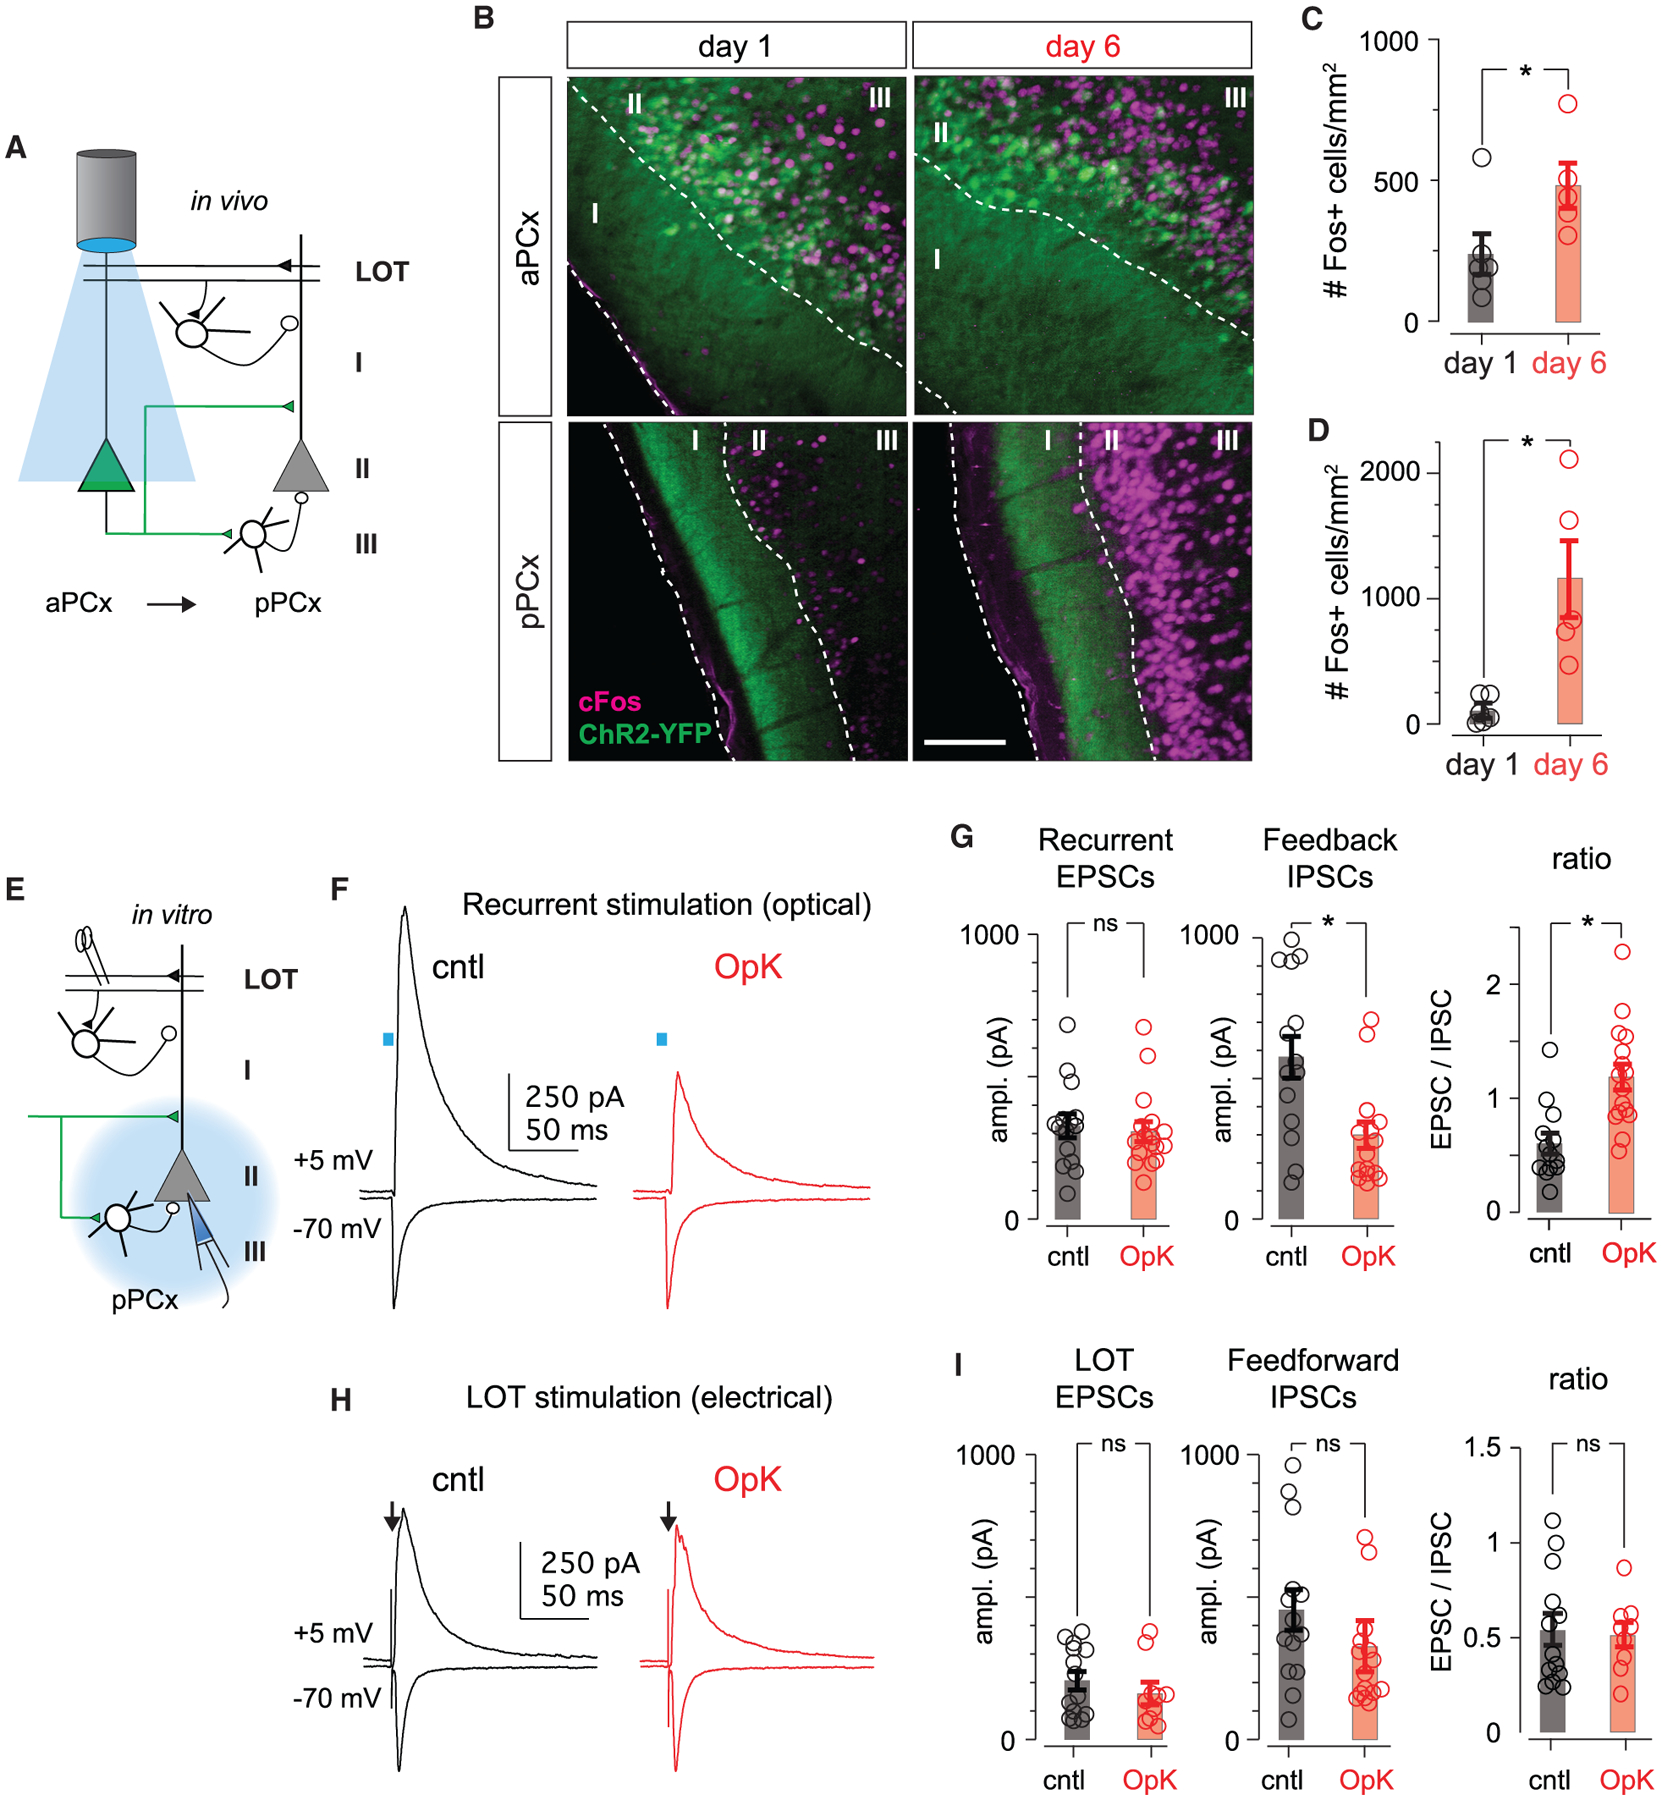
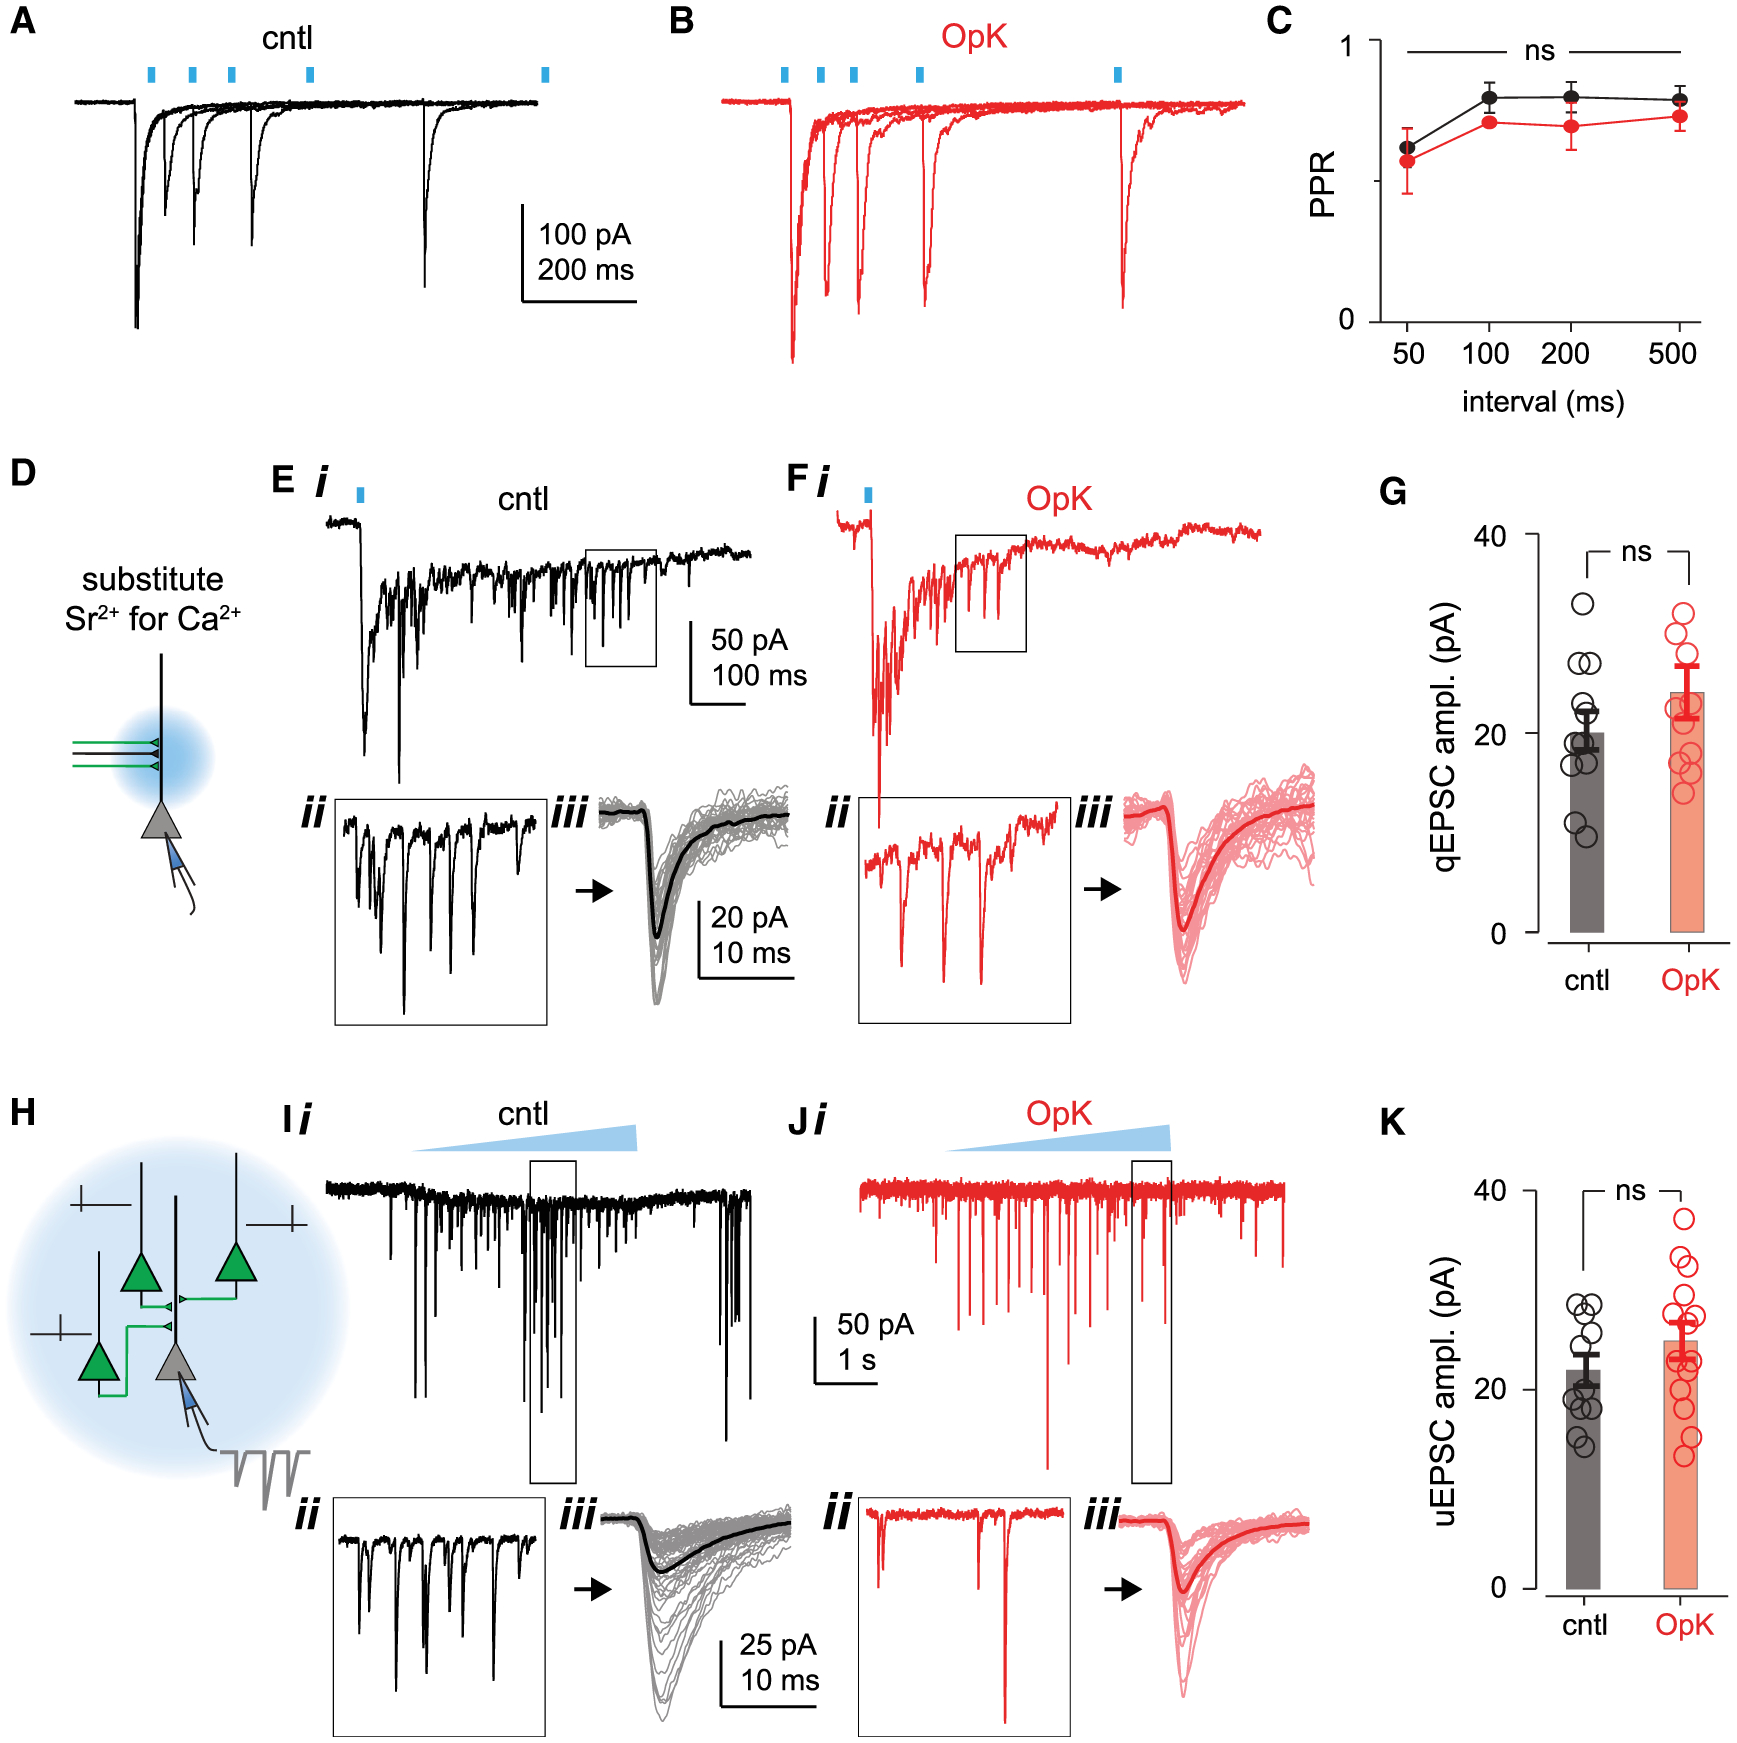
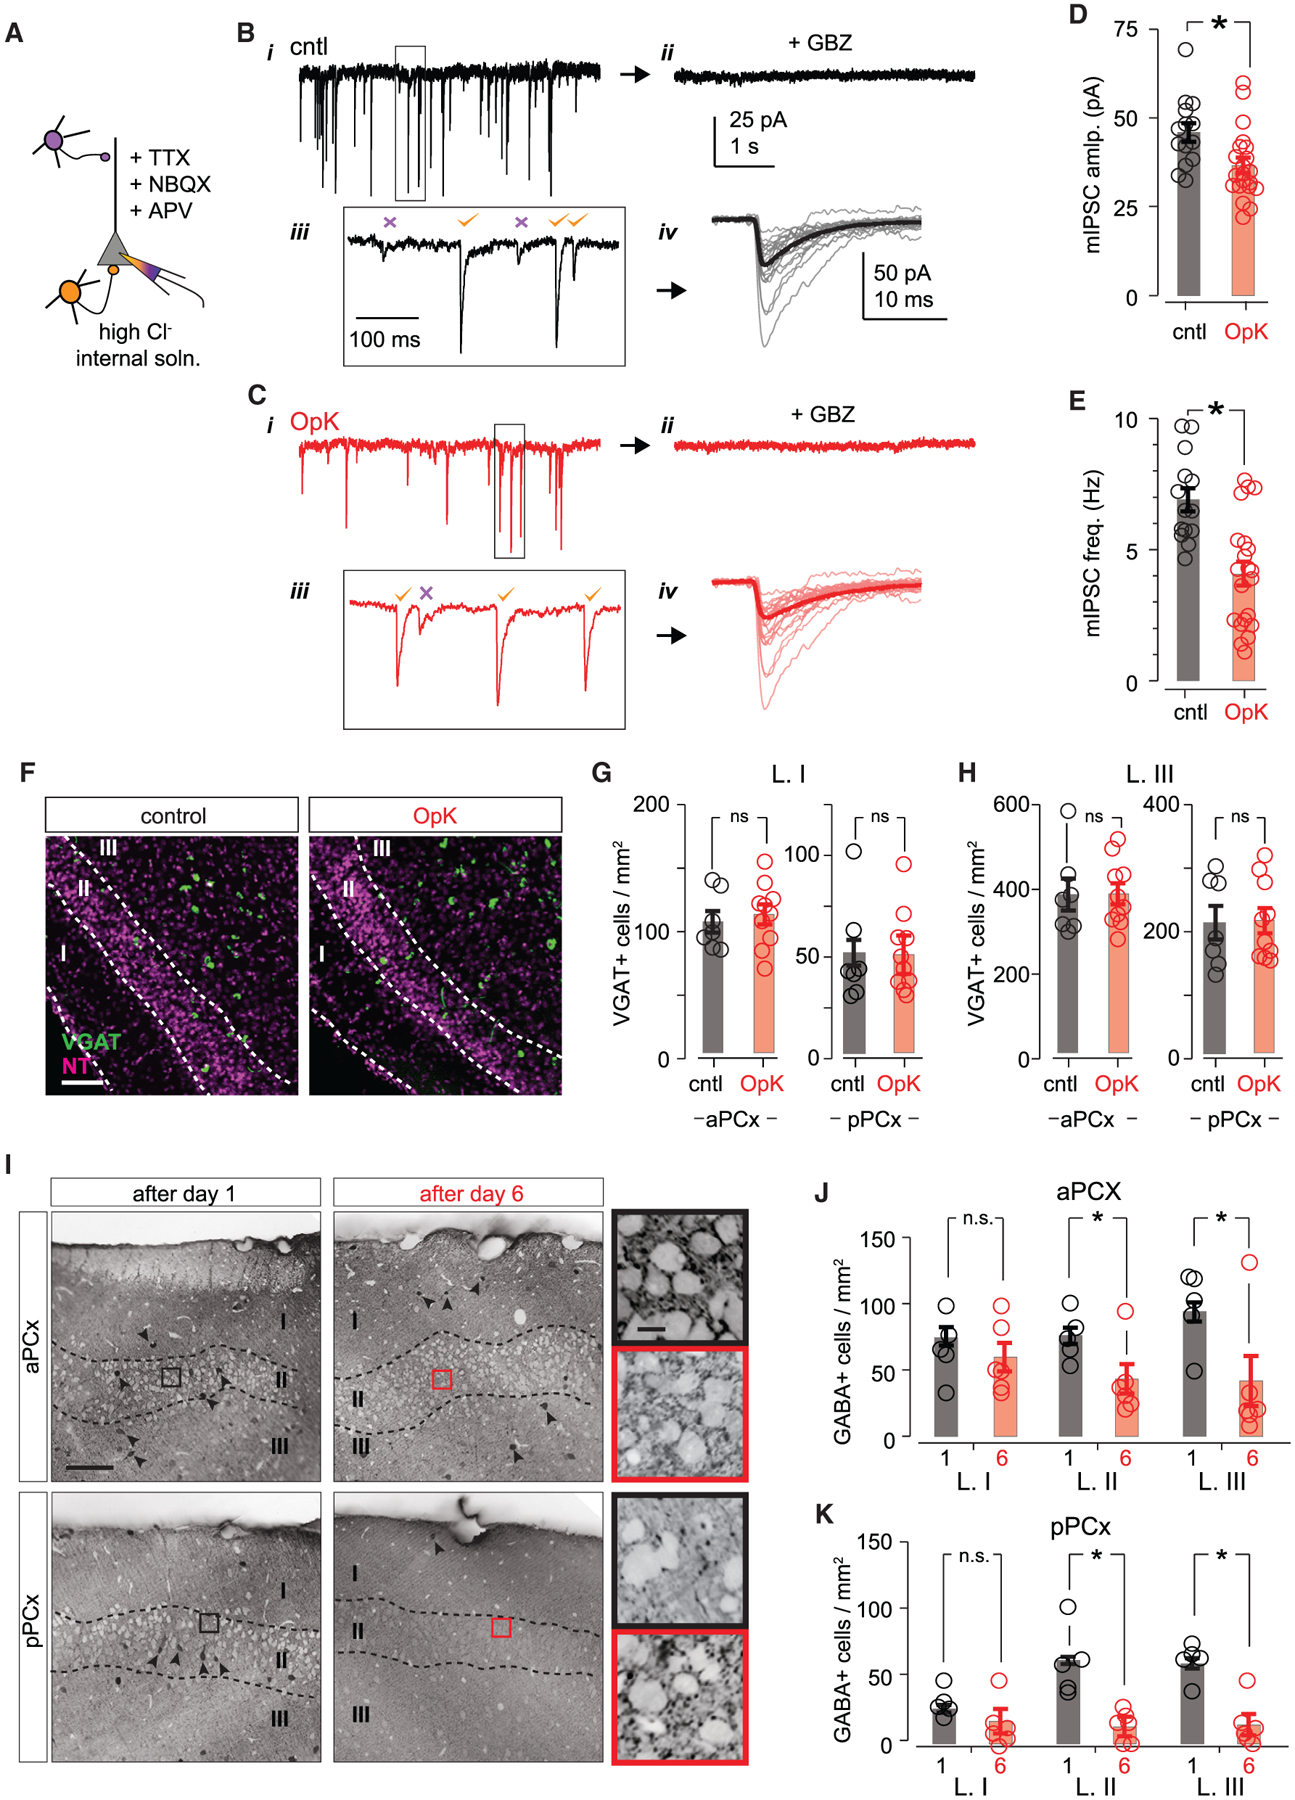
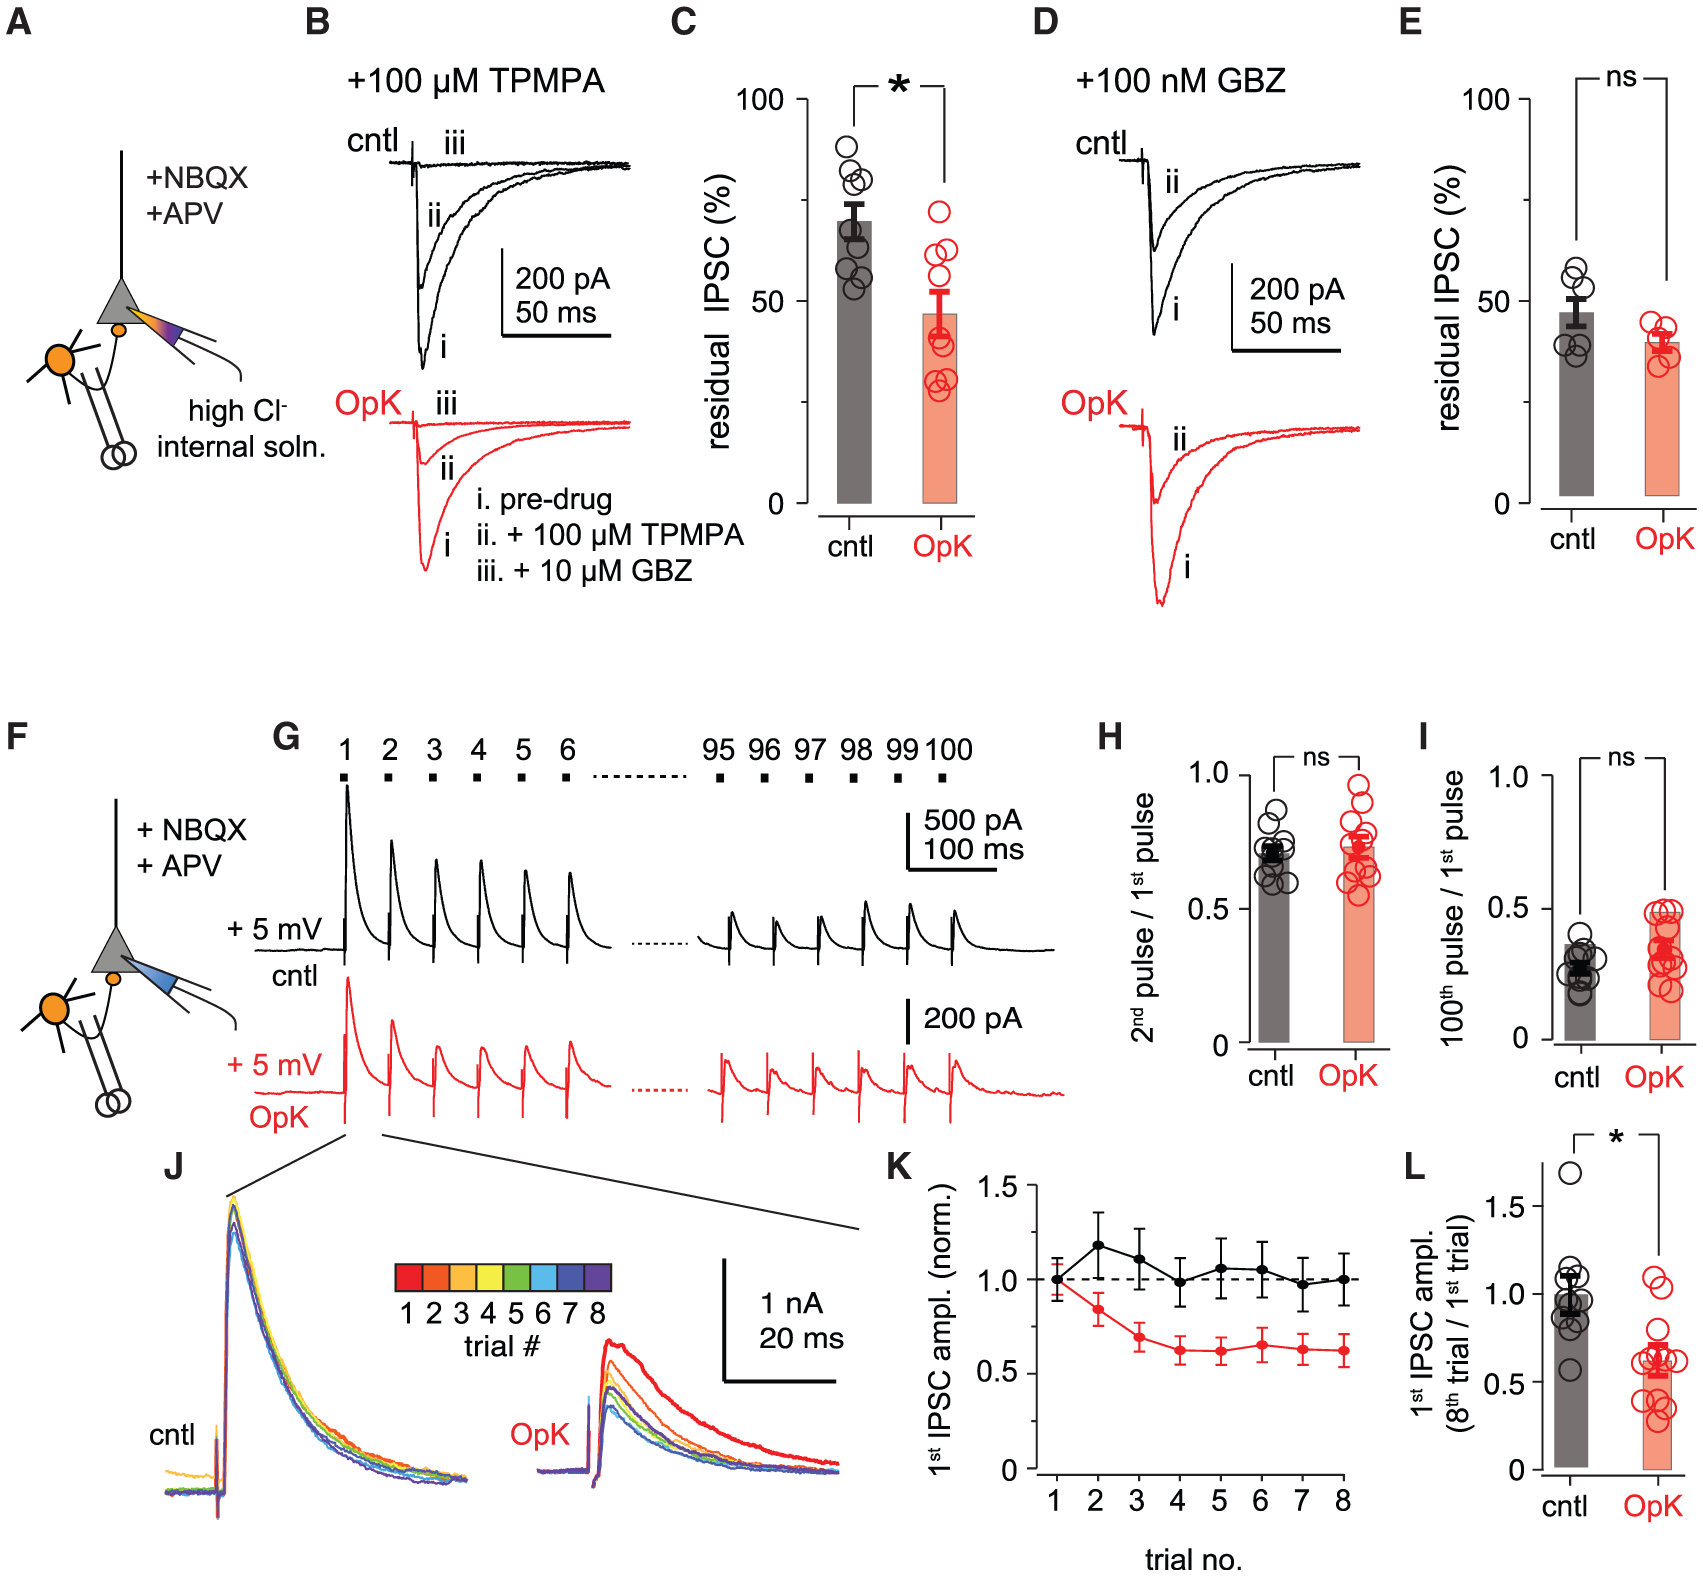
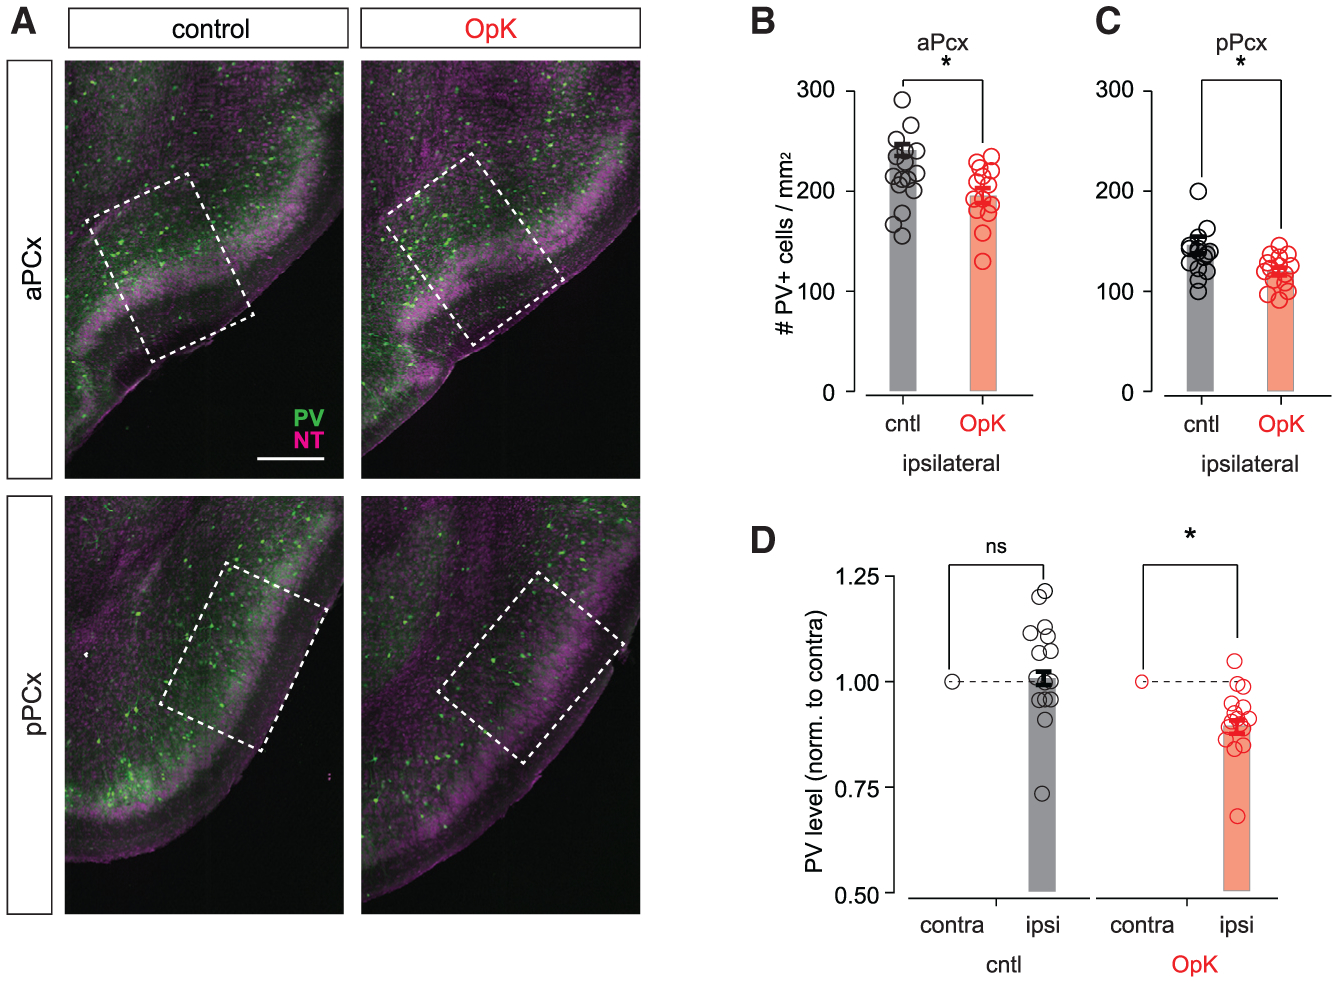
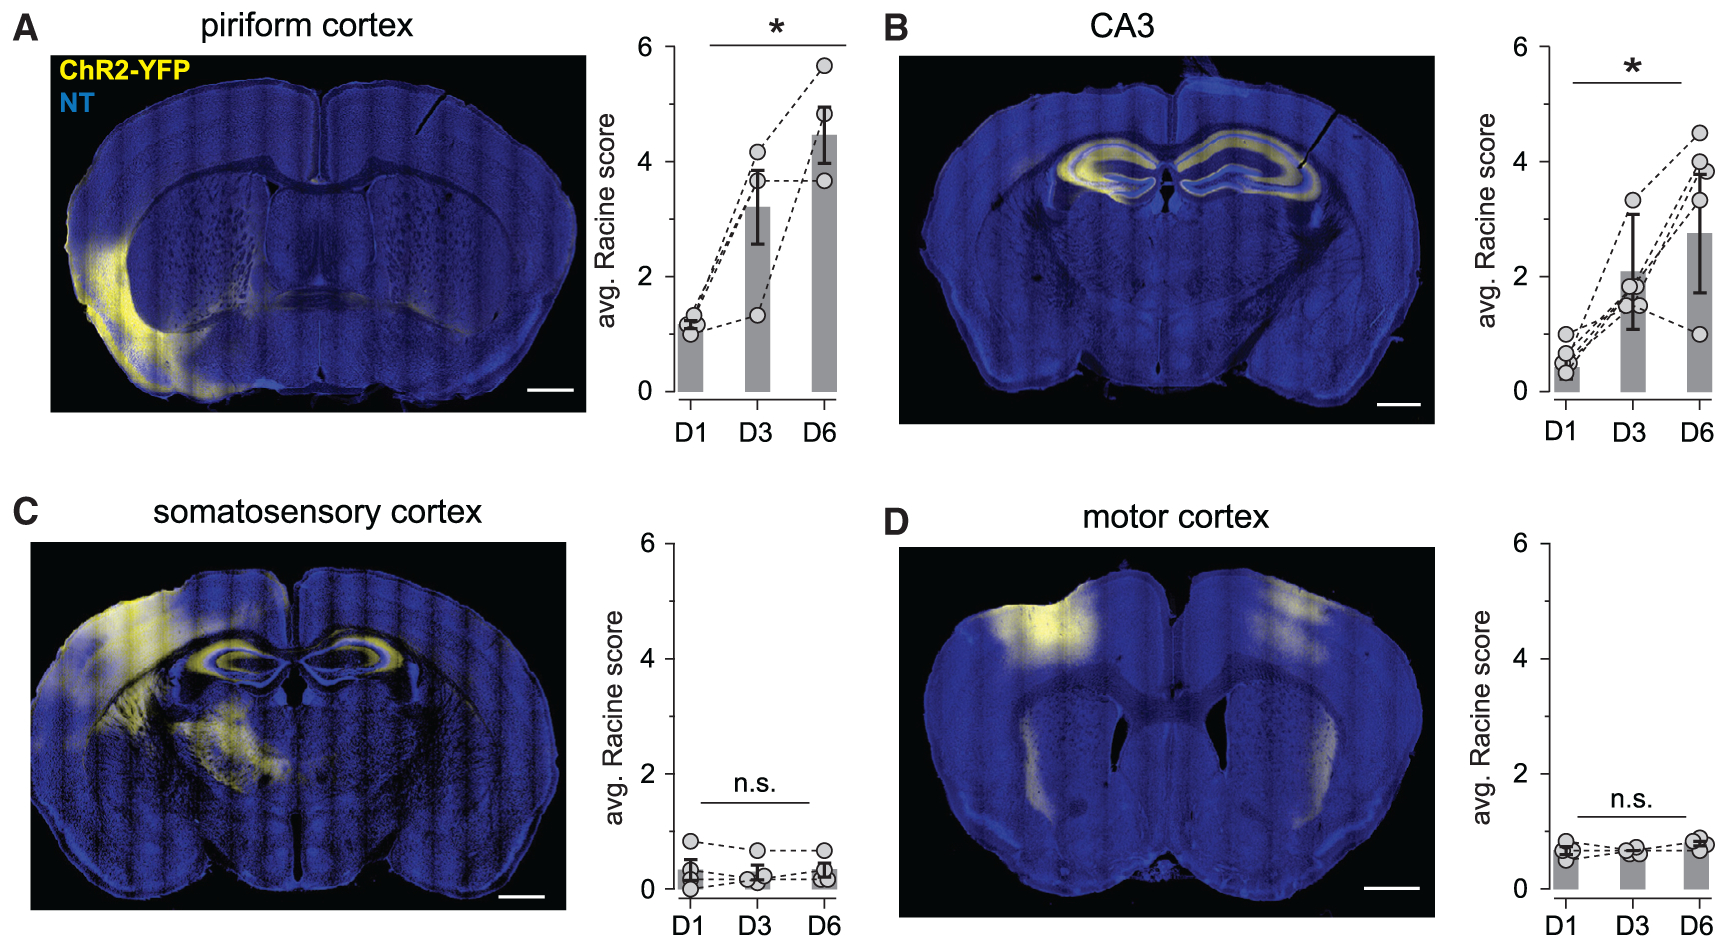
It is well established that seizures beget seizures, yet the cellular processes that underlie progressive epileptogenesis remain unclear. Here, we use optogenetics to briefly activate targeted populations of mouse piriform cortex (PCx) principal neurons in vivo. After just 3 or 4 days of stimulation, previously subconvulsive stimuli trigger massive, generalized seizures. Highly recurrent allocortices are especially prone to "optokindling." Optokindling upsets the balance of recurrent excitation and feedback inhibition. To understand how this balance is disrupted, we then selectively reactivate the same neurons in vitro. Surprisingly, we find no evidence of heterosynaptic potentiation; instead, we observe a marked, pathway-specific decrease in feedback inhibition. We find no loss of inhibitory interneurons; rather, decreased GABA synthesis in feedback inhibitory neurons appears to underlie weakened inhibition. Optokindling will allow precise identification of the molecular processes by which brain activity patterns can progressively and pathologically disrupt the balance of cortical excitation and inhibition.

Keywords: GABA depletion; channelrhodopsin-2; epilepsy; kindling; olfactory cortex; optogenetics; optokindling; piriform cortex; seizures.


Conflict of interest statement

Declaration of interests The authors declare no competing interests.

Figures

Figure 1.
Figure 1.. Robust, prolonged seizures develop following daily optical stimulation
(A) Experimental schematic. Cre-dependent AAVs conditionally expressing ChR2-YFP were injected into aPCx of Emx1-Cre mice. After waiting for viral expression to stabilize, infected cells were briefly photoactivated with trains consisting of 100 pulses (10 ms) at 20 Hz. Each train was presented six times per day (S1–S6), 10 min apart. This protocol was repeated for 6 days. (Bi) Example ChR2-YFP expression pattern in aPCx. Arrowheads indicate scarring from the optical fiber track. (Bii–Biv) Higher magnification of insets in red box in (i). ChR2-YFP expression is focal, with few ChR2-YFP+ cells rostral (v) and no ChR2-YFP+ cells caudal (vi) to the injection site. Scale bars: 500 μm (i); 250 μm (v). (C) Seizure severity quantified as modified Racine scores for each of the six stimuli presented on days 2 (black bars) and 6 (red bars). Bar size corresponds to Racine seizure score. Data are shown for the first cohort of 23 mice in which the optokindling protocol was followed most strictly. (D) Mean daily Racine scores averaged over across all six daily stimuli (closed circles). Note that the first stimulus of the day (open circles) was less effective at evoking seizures than the subsequent five stimuli (red circles). Error bars indicate SEM. (E) Probability of kindling expressed as fraction of mice that expressed at least two (closed circles) or three (open circles) stage ≥ 4 seizures on any of the six stimuli presented on each day. (F) Representative day 2 LFP recording (top) and spectrogram (bottom). The blue shading indicates the timing of the 5-s-long, 20-Hz light train. The insets provide expanded views during the stimulation period and approximately 30 s later. (G) Example LFP recording on day 6 from same mouse as (F). Note that the seizure persists and intensifies long after the stimulus ends and then terminates abruptly. The main trace, the inset, and the spectrogram are all drawn the same scale as those in (F).
Figure 2.
Figure 2.. Optokindling disrupts the balance of recurrent excitation and feedback inhibition
(A) Schematic showing in vivo stimulation paradigm. ChR2+ cells in aPCx are activated optically. ChR2 cells in pPCx receive excitatory recurrent inputs from aPCx but are not directly activated. (B) ChR2-YFP and Fos expression in aPCx and pPCx from mice killed 1 h after the last stimulus on either day 1 or 6. Dashed white lines demarcate layers, which are labeled by numerals. ChR2-YFP+ cells in aPCx extend axons through layer I of pPCx. Scale bar: 100 μm. (C) Number of Fos+ neurons in aPCx after the first or sixth day of stimulation. Bars indicate mean Fos+ cell counts across animals, and error bars represent SEM; each circle represents the mean number of Fos+ neurons per mouse averaged across four sequential 50-μm sections. (D) As in (C) but for pPCx. (E) Schematic of in vitro slice experiments. We recorded from ChR2 pyramidal cells and either measured monosynaptic recurrent EPSCs and disynaptic feedback IPSCs evoked by optically activating ChR2+ axons. We also activated excitatory olfactory bulb inputs and disynaptic feedforward inhibition by electrically stimulating mitral cell axons in the LOT. (F) Recurrent EPSCs (Vm = −70 mV) and feedback IPSCs (Vm = +5 mV) in an example cell from an unstimulated control (cntl) mouse (black traces) and in a cell from an OpK mouse (red traces) evoked by 2-ms light pulses (blue bars). (G) Amplitudes of recurrent EPSCs (left), disynaptic feedback IPSCs (middle), and their ratios (right) evoked using equivalent stimuli in cells from cntl and OpK mice. Each circle represents the amplitude or amplitude ratio for a single cell, bars indicate average across cells, and error bars represent SEM. (H) Example afferent EPSCs and feedforward IPSCs evoked by electrically stimulating the LOT (arrows). Stimulus artifacts have been truncated for clarity. (I) Summary of evoked EPSC amplitudes, IPSC amplitudes, and their ratios following electrical LOT stimulation.
Figure 3.
Figure 3.. Optokindling does not strengthen recurrent excitation
(A–C) Equivalent paired-pulse ratios in cells from example of a cntl mouse (A) and an OpK mouse (B), and summary across mice (C; cntl, n = 8 cells from 3 mice; OpK, n = 8 cells from 3 mice; two-way ANOVA; F(1,56) = 2.299, p = 0.136) do not support changes in presynaptic release probability. (D) Experimental schematic for evoking and measuring quantal EPSCs (qEPSCs) in uninfected neurons by 2-ms focal light pulses. Transmitter release is desynchronized when extracellular Ca2+ is replaced with Sr2+. (E) Example single Sr2+ trial trace in a cell from a cntl mouse (i) following optical activation (blue bar). Inset below (ii) shows the trace at an expanded scale corresponding to the boxed region in (i). Traces on right bottom (iii) show 30 sequentially recorded qEPSCs (thin traces) and the ensemble average response (thick traces) that was used to provide an average qEPSC amplitude for the example cell. (F) As in (E) but for an example cell from an OpK mouse. (G) Summary of all qEPSC amplitudes recorded from cntl and OpK mice. Mean qEPSC amplitudes for each cell (open circles) and average across experiments (bars). (H) Experimental schematic for evoking and measuring unitary EPSCs (uEPSCs). Weak 5-s ramping light pulses evoke asynchronous spiking in ChR2+ neurons (thin black ticks), which produce uEPSCs in postsynaptic ChR2 neurons (thicker gray trace). (I) Example single trial in a cell from a cntl mouse (i) following weak, ramping light pulse activation (blue triangle). Inset below (ii) shows the trace at an expanded scale corresponding to the boxed region in (i). Traces on right bottom (iii) show 30 sequentially recorded uEPSCs (thin traces) and averaged response for all uEPSCs (thick traces) to provide an average uEPSC amplitude for the example cell. (J) As in (I) but for an example cell from an OpK mouse. (K) Summary of all uEPSCs recorded from cntl and OpK mice. Mean uEPSC amplitudes for each cell (open circles) and average across experiments (bars).
Figure 4.
Figure 4.. Optokindling depletes GABA and weakens feedback inhibition
(A) Experimental schematic for recording miniature IPSCs (mIPSCs). Fast IPSCs that originate from perisomatic-targeting feedback inhibitory interneurons (orange cells) were included; IPSCs from dendritic-targeting feedforward inhibitory interneurons (purple cells) were excluded based on their slow kinetics. Recordings were obtained using a high-Cl internal solution with sodium channels and glutamate receptors blocked. (B) Example trace from a cntl mouse (Vm = −70 mV; i). Synaptic currents were completely blocked by gabazine (10 μM, ii). Insets on bottom show indicated region on top trace at an expanded timescale (iii). mIPSCs with fast (orange checks) and slow (purple crosses) kinetics were clearly distinguishable, and we excluded slow mIPCSs to select for feedback mIPSCs. (iv) Overlaid examples of the first 20 mIPSCs (thin traces) and average of all mIPSCs from that cell (thick trace). (C) As in (B), but with an example from an OpK mouse. (D) Summary of average mIPSC amplitudes measured from cntl and OpK mice. Open circles represent mean mIPSC amplitudes for each cell (cntl, 14 cells/3 mice; OpK, 21 cells/3 mice); bars indicate average mIPSC amplitudes across cells. (E) As in (D), but for mIPSC frequency. (F) Representative VGAT in situ hybridization images from pPCx of cntl (left) and OpK (right) mice. Dashed lines demarcate laminar boundaries, which are labeled by numerals. Scale bar: 100 μm. (G) Number of L. I VGAT+ neurons from cntl (black) and OpK (red) mice. Each point represents counts for one section, bars indicate average across sections, and error bars represent SEM. VGAT+ cells in aPCx: cntl vs. OpK, p = 0.855; pPCx: cntl vs. OpK, p = 0.731. We used 7 sections from 2 mice for cntl and 10 sections from 3 mice for OpK analyses, and unpaired t tests were used in all cases. (H) As in (G) but for L. III. aPCx: cntl vs. OpK, n = 830; IpPCx: cntl vs. OpK, p = 0.670. (I) Representative sections of GABA-stained sections from mice stimulated for either 1 or 6 days; aPCx and pPCx sections are from the same mouse. Dashed lines demarcate different layers, which are indicated by numerals. Some GABA-stained neurons are indicated by arrowheads. Note the absence of GABA-stained neurons in layers II and III following OpK, especially in pPCx. Insets show magnified regions indicated by boxes, with contrast increased for visibility of perisomatic GABA puncta. Scale bars: 100 μm and 10 μm. (J) Average numbers of GABA+ neurons in each layer measured in aPCx after 1 (black) or 6 (red) days of stimulation. Circles represent the average cell counts for each animal across four sequential 50-μm sections. L. I: day 1 (n = 18 sections/5 mice) vs. day 6, (n = 23 sections/6 mice), p = 0.503, unpaired t test; L. II: day 1 vs. day 6 p = 0.00402; L. III: day 1 vs. day 6, p = 0.000209). (K) As in (J), but for pPCx. L. I: day 1 vs. day 6, p = 0.106; L. II: day 1 vs. day 6, p = 2.15 × 10⁻⁵; L. III: day 1 vs. day 6, p = 3.96 × 10⁻⁵.
Figure 5.
Figure 5.. Optokindling decreases synaptic GABA concentration and slows vesicle refilling
(A) Experimental schematic. Direct IPSCs were evoked by electrically stimulating at the layer II/III boundary ~250 μm from the recorded cell with excitatory synaptic transmission blocked. Responses were recorded (Vm = −70 mV) with a high-chloride pipette solution, resulting in inward IPSCs. (B) Example IPSCs from a cntl mouse (black traces on top) and an OpK mouse (red traces on bottom) in regular artificial cerebrospinal fluid (aCSF) (i), after addition of 100 μM TPMPA (ii), followed by addition of 10 μM GBZ (iii). (C) Summary of residual IPSCs after addition of 100 μM TPMPA. (D) Example IPSCs from a cntl mouse (black traces on top) and an OpK mouse (red traces on bottom) in regular aCSF (i), after addition of 100 nM GBZ (ii). (E) Summary of residual percentage of IPSCs after addition of 100 nM GBZ. (F) Schematic for experiments, as in (A), except responses were recorded (Vm = +5 mV) with a regular Cs-gluconate pipette solution, resulting in outward IPSCs. (G) Example responses following 100 stimuli at 20 Hz in a cntl (top) and OpK (bottom) mouse. Traces represent averages of 8 sequential trials presented 30 s apart. Stimulus artifacts have been truncated for clarity. Note the different vertical scale bars of cntl and OpK traces. (H) Paired-pulse ratios (50-ms interstimulus interval) calculated as the ratio of the second over the first IPSC amplitude. (I) Measure of vesicle depletion calculated as the ratio of the 100th over the first IPSC amplitude. (J) Overlays of the first IPSCs within a trial for each of the 8 trials that are averaged in (G). The amplitudes across trials are constant in cntl slices (left), whereas there is a progressive decrease in amplitude in slices from OpK mice (right). (K) Average first IPSC ratios across trials, normalized to the amplitude on the first trial (cntl, 11 cells/3 mice; OpK, 12 cells/3 mice). (L) Ratios of first IPSC amplitudes for the first and eighth trials.
Figure 6.
Figure 6.. Optokindling decreases PV expression
(A) Representative sections showing PV expression (green) in aPCx (top) and pPCx (bottom) from a cntl mouse (left) and an OpK mouse (right). The dashed rectangles indicate the 500 μm × 700 μm areas that were used for counting PV+ neurons. Scale bar, 300 μm. The NT counterstain is shown in magenta. (B) Number of PV+ neurons in aPCx (cntl, 241 ± 5.83 cells/mm2, n = 16 slices/4 mice; OpK, 195 ± 7.38 cells/mm2, n = 16 slices/4 mice; p = 0.043, unpaired t test). (C) Number of PV+ neurons in pPCx (cntl, 146 ± 8.34 cells/mm2, n = 16 slices/4 mice; OpK, 120 ± 3.85 cells/mm2, n = 16 slices/4 mice; p = 0.033, unpaired t test). (D) Intensity of detected PV+ somata in pPCx normalized to average intensity of identified PV+ somata in the contralateral hemisphere (cntl, 1.05 ± 0.0309, n = 16 slices/4 mice; paired t test, 0.137; OpK, 0.905 ± 0.0209, n = 16 slices/4 mice; p = 0.00031).
Figure 7.
Figure 7.. Recurrent circuits are especially prone to optokindling
(A, left) A representative coronal section showing ChR2-YFP expression in PCx. (right) Summary of change in Racine scores across days. Connected dots show the average scores across all six daily stimuli for each mouse, and bars show daily averages across mice (n = 4 mice; one-way ANOVA, F(2,9) = 12.8, p = 0.00234). (B) As in (A) but for CA3 (n = 6; one-way ANOVA, F(2,9) = 16.8, p = 0.000148). (C) As in (A) but for S1 (n = 4; one-way ANOVA, F(2,9) = 0.0244, p = 0.975). (D) As in (A) but for M1 (n = 4; one-way ANOVA, F(2,9) = 2.40, p = 0.147). All scale bars: 1 mm.

References

    1. Bertram E (2007). The relevance of kindling for human epilepsy. Epilepsia 48 (Suppl 2), 65–74. - PubMed
    1. Bolding KA, and Franks KM (2017). Complementary codes for odor identity and intensity in olfactory cortex. eLife 6, e22630. - PMC - PubMed
    1. Bolding KA, and Franks KM (2018). Recurrent cortical circuits implement concentration-invariant odor coding. Science 361, eaat6904. - PMC - PubMed
    1. Bolding KA, Nagappan S, Han BX, Wang F, and Franks KM (2020). Recurrent circuitry is required to stabilize piriform cortex odor representations across brain states. eLife 9, e53125. - PMC - PubMed
    1. Borg-Graham LJ, Monier C, and Frégnac Y (1998). Visual input evokes transient and strong shunting inhibition in visual cortical neurons. Nature 393, 369–373. - PubMed

Publication types

MeSH terms

Substances

LinkOut - more resources