. 2021 Apr 20;35(3):109021.
doi: 10.1016/j.celrep.2021.109021.

Subiculum as a generator of sharp wave-ripples in the rodent hippocampus

Affiliations

Subiculum as a generator of sharp wave-ripples in the rodent hippocampus

Barbara Imbrosci et al. Cell Rep. .

Abstract

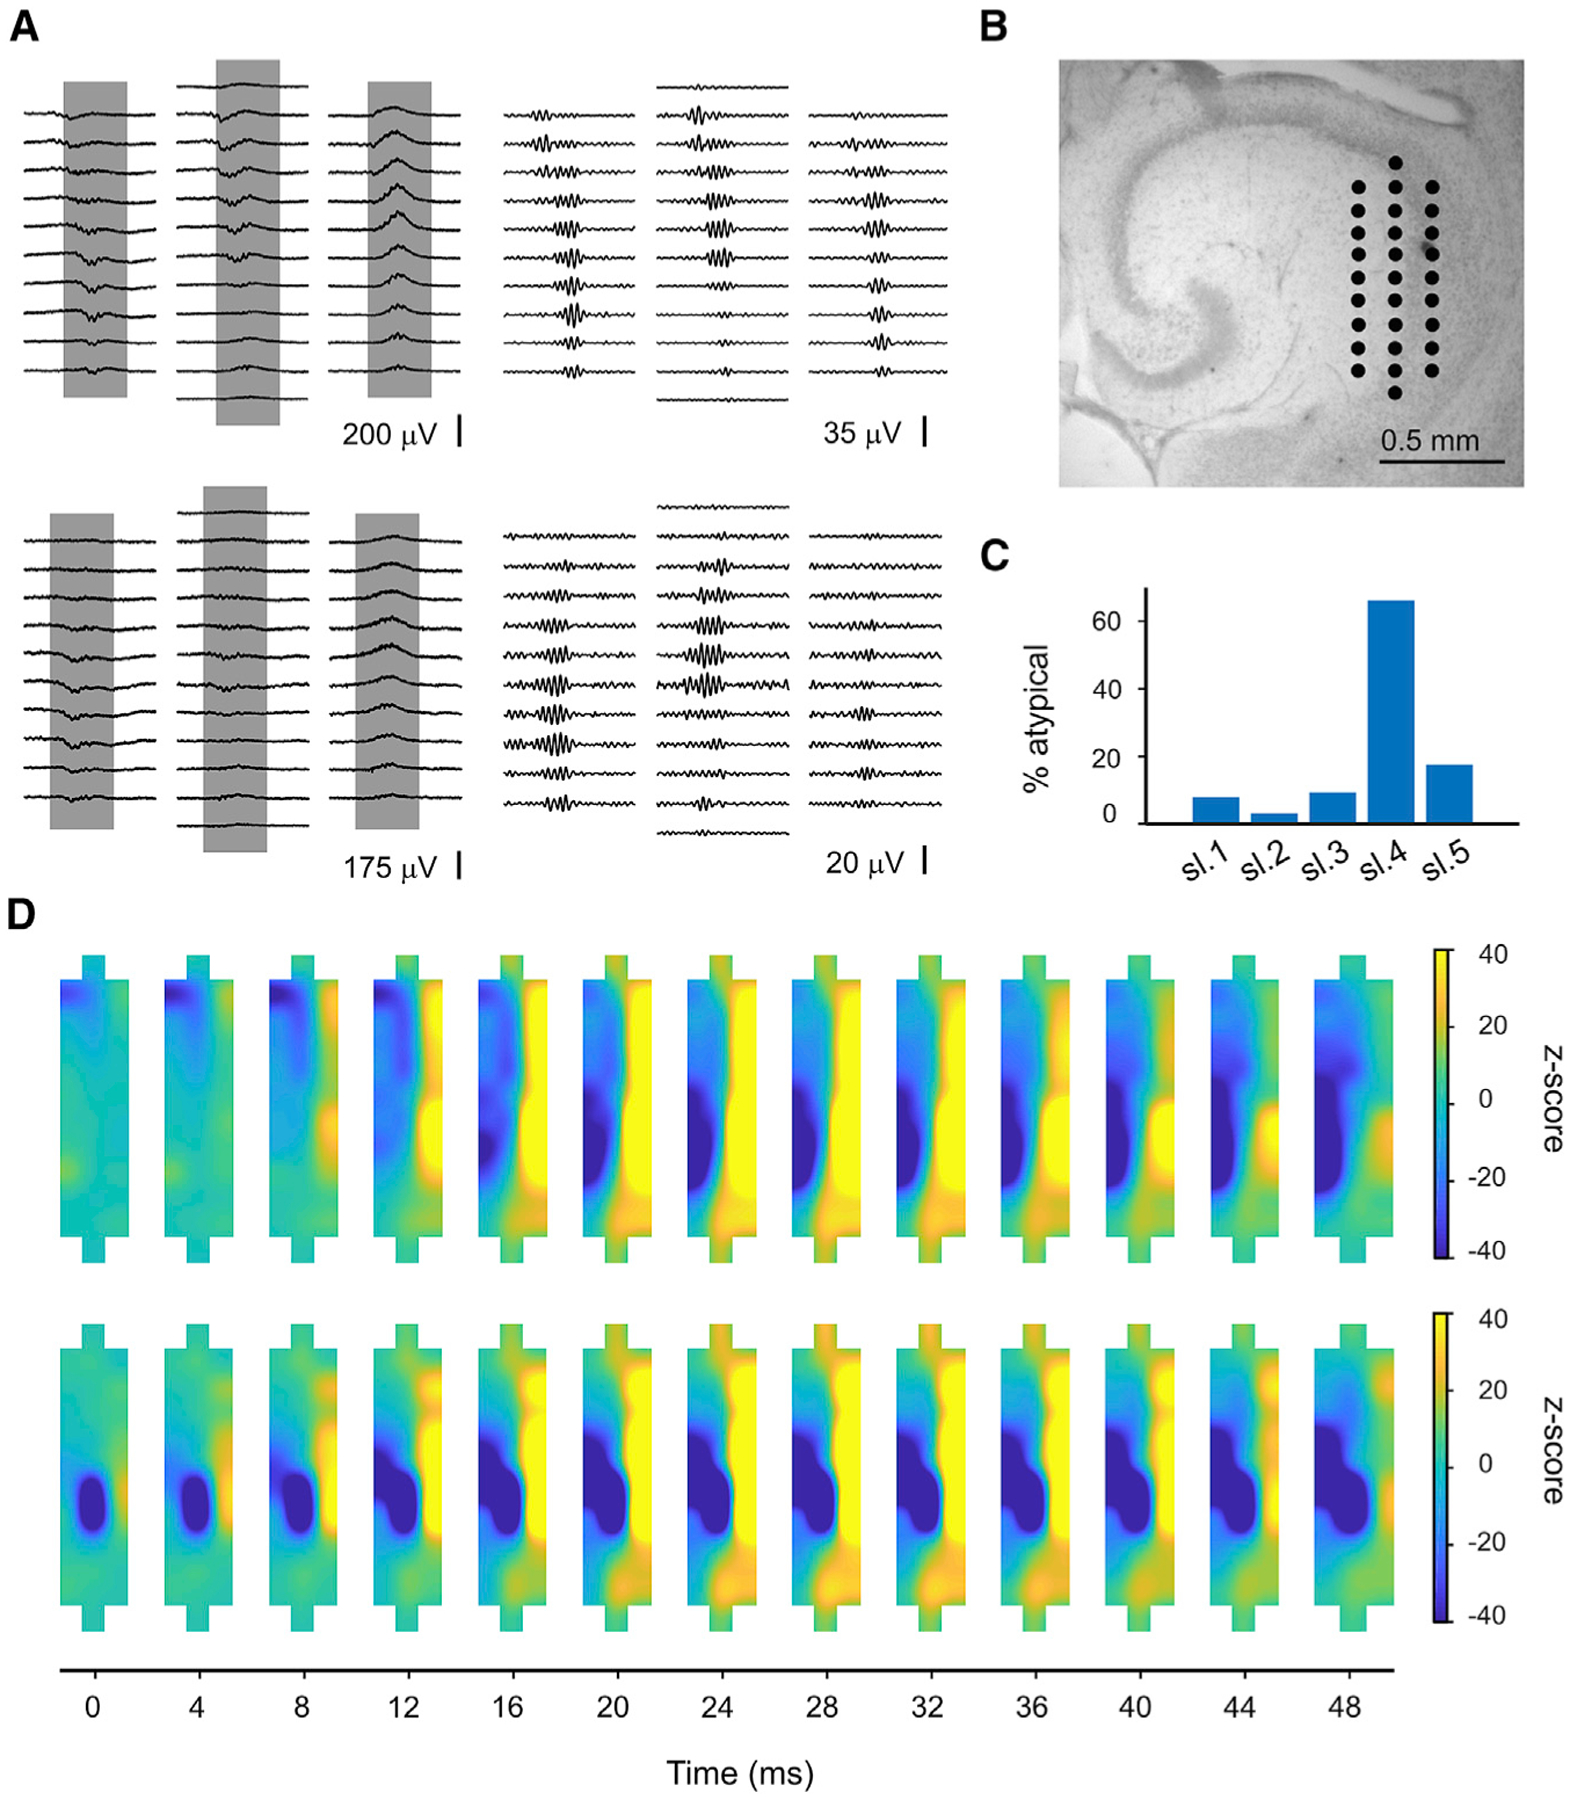
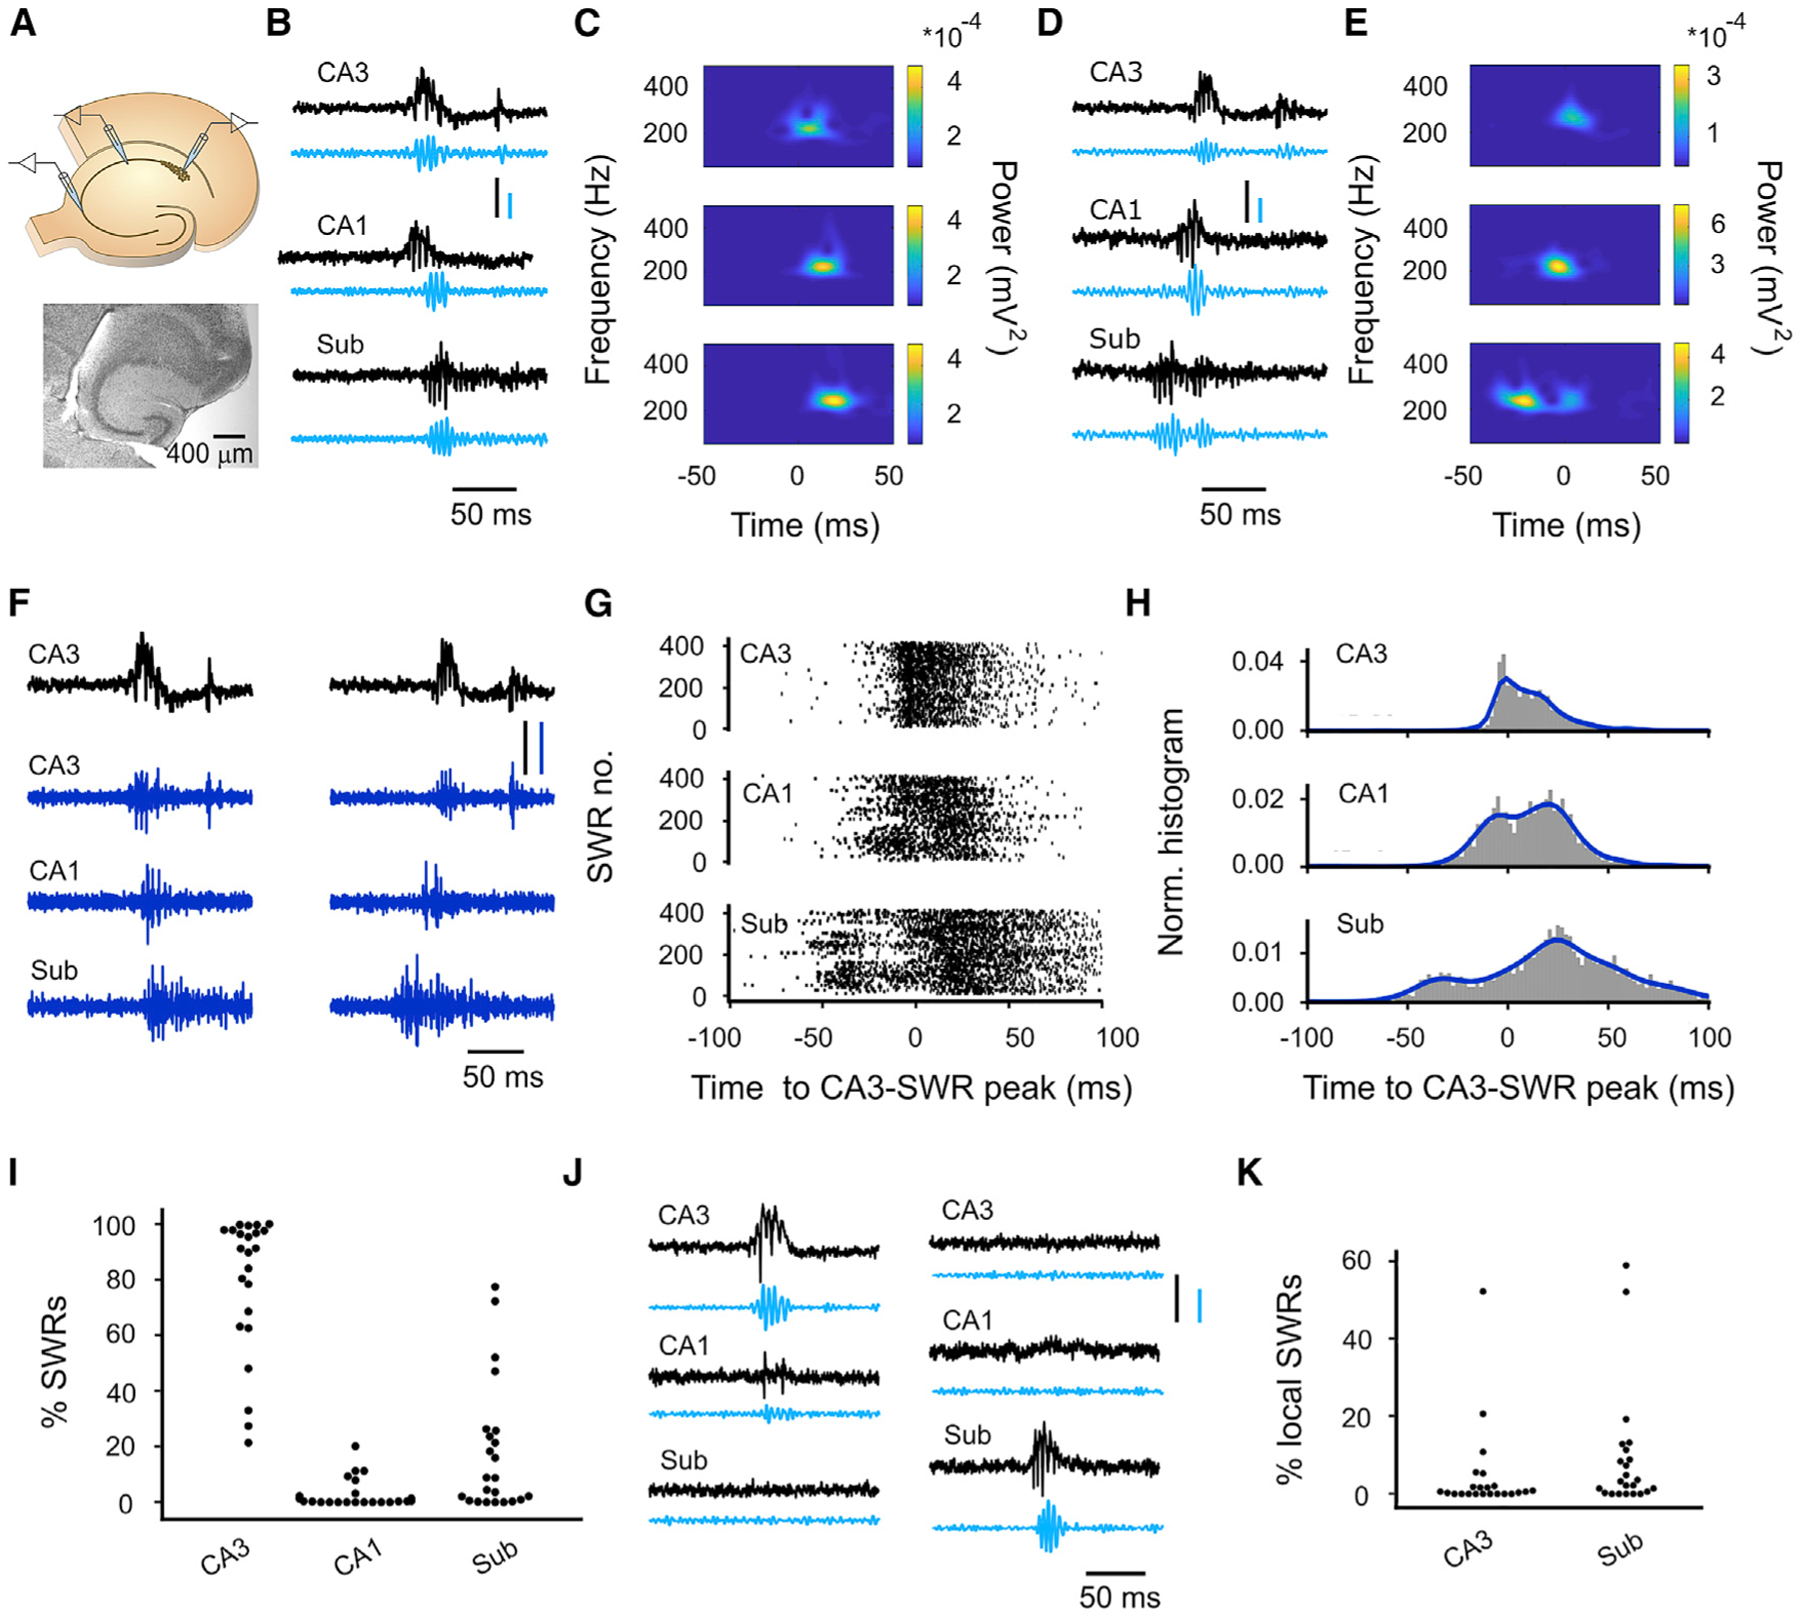
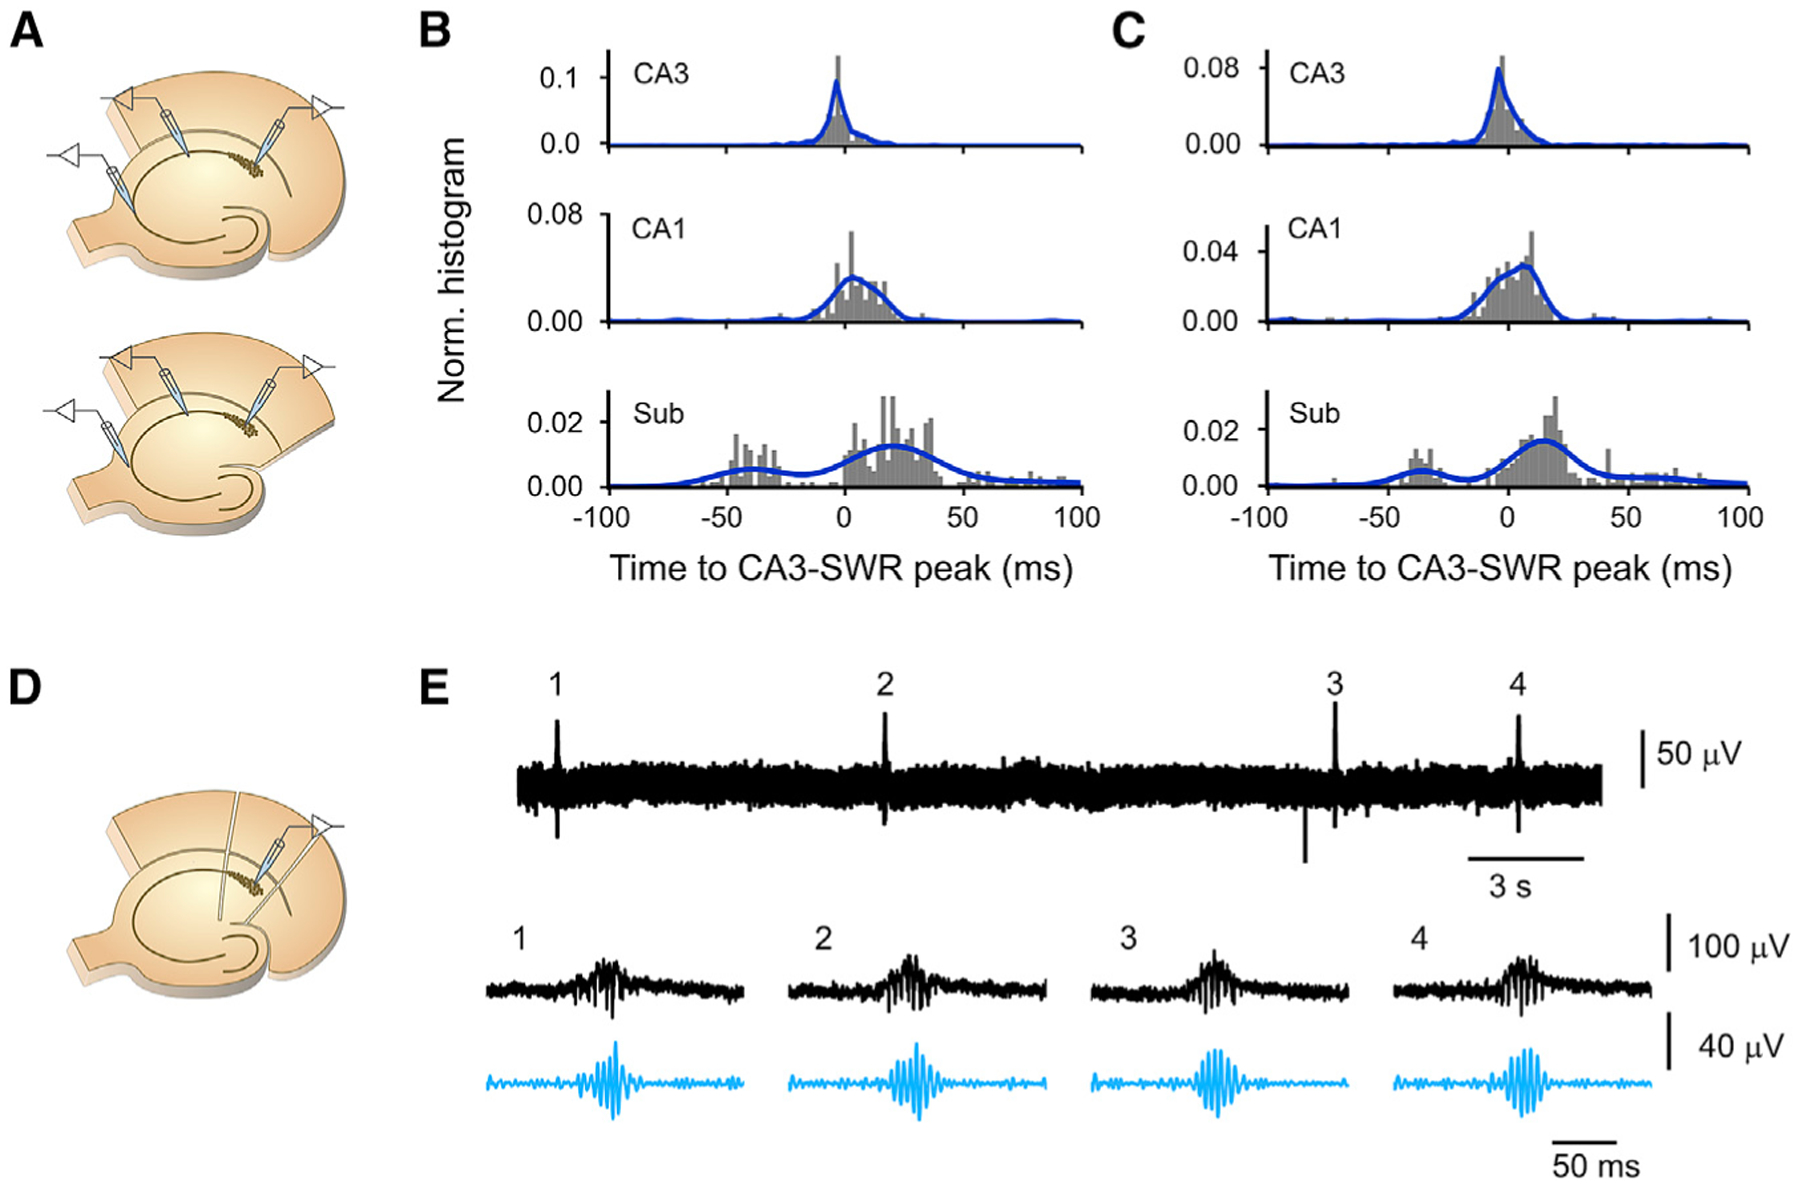
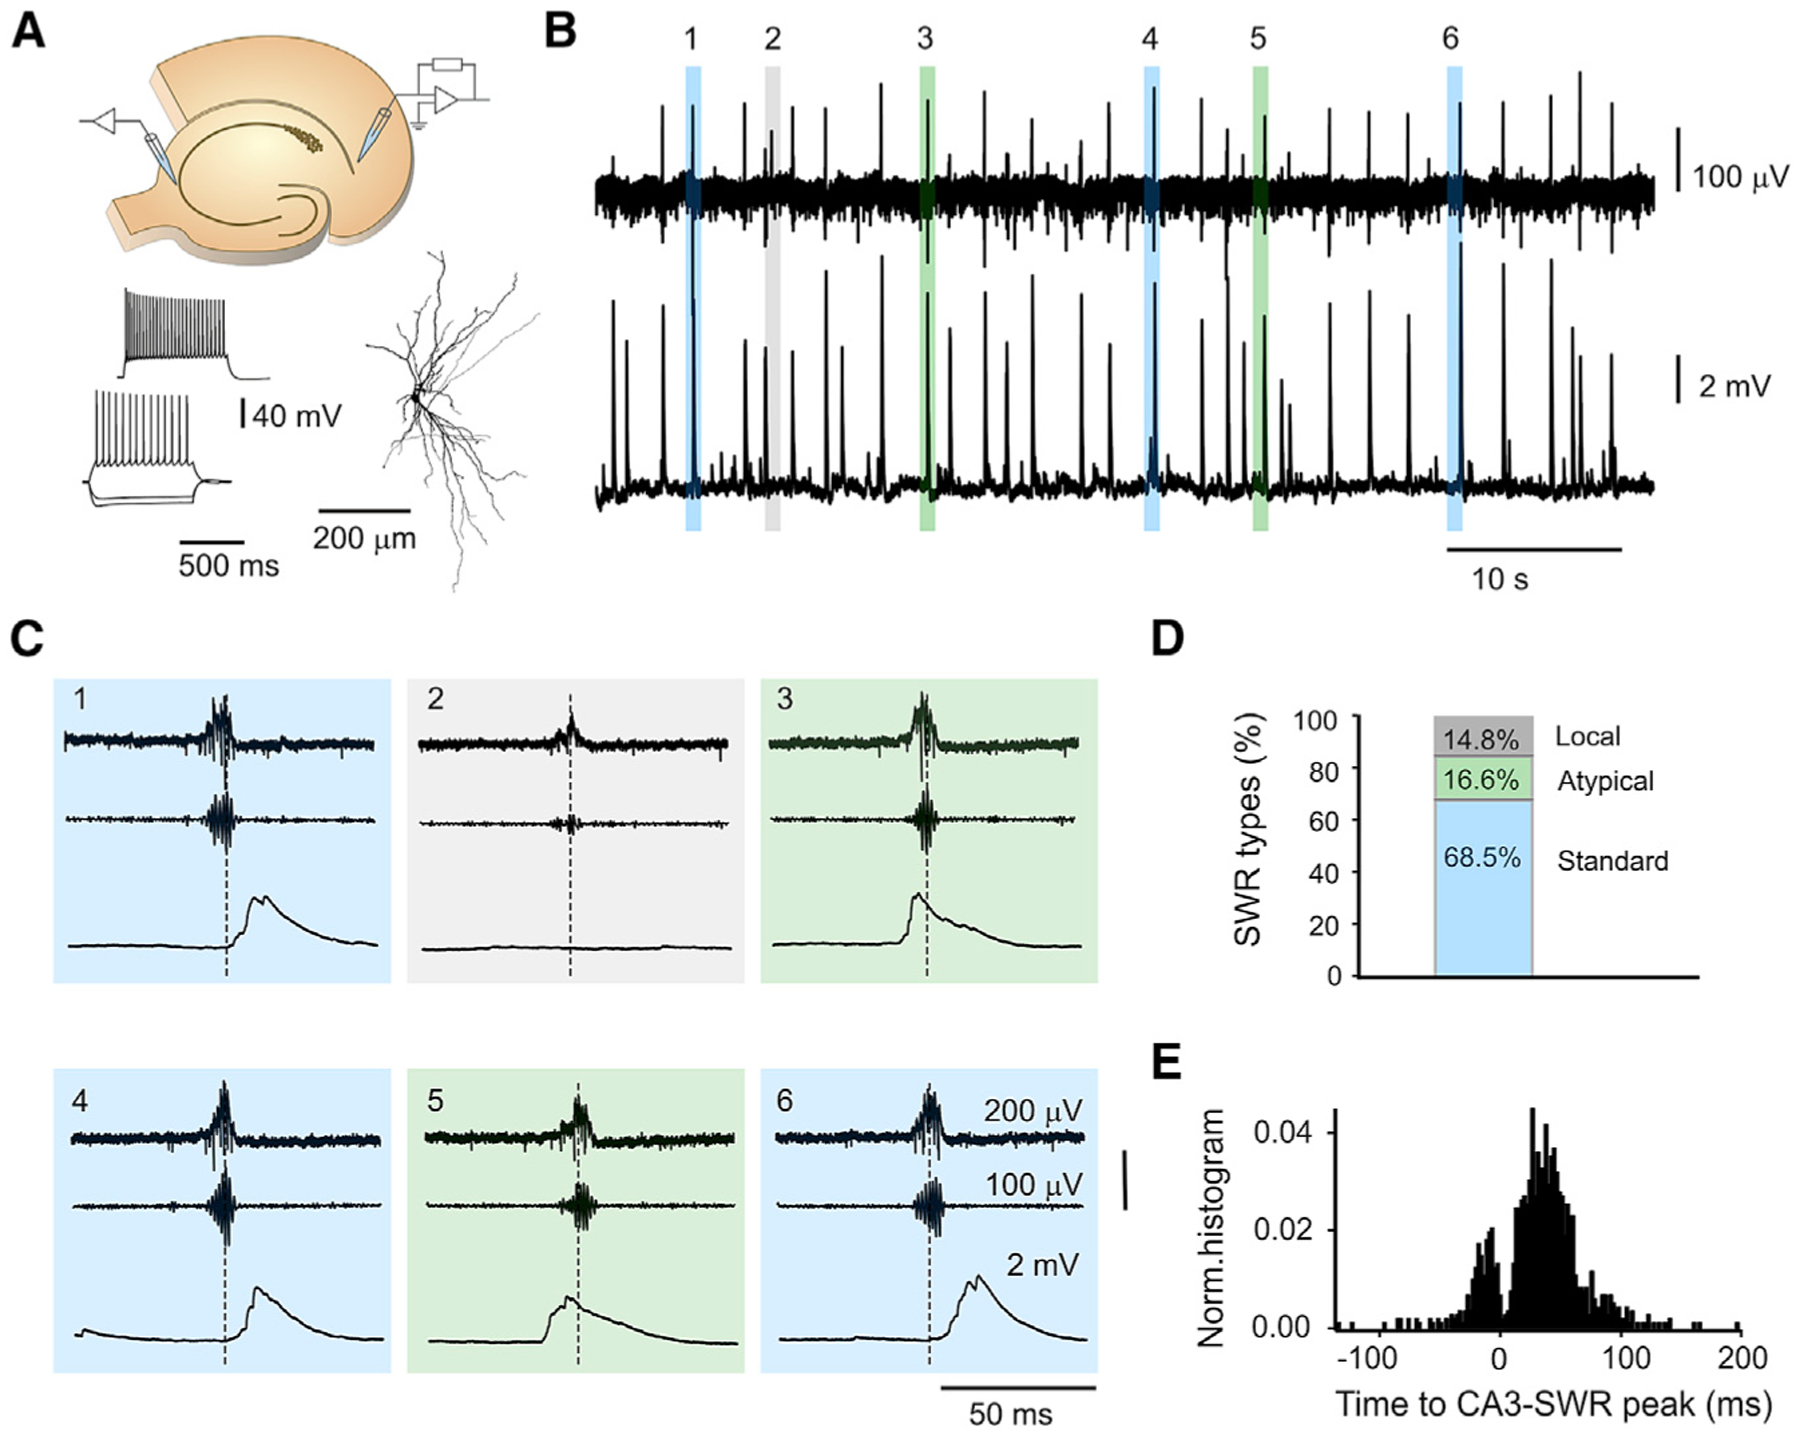
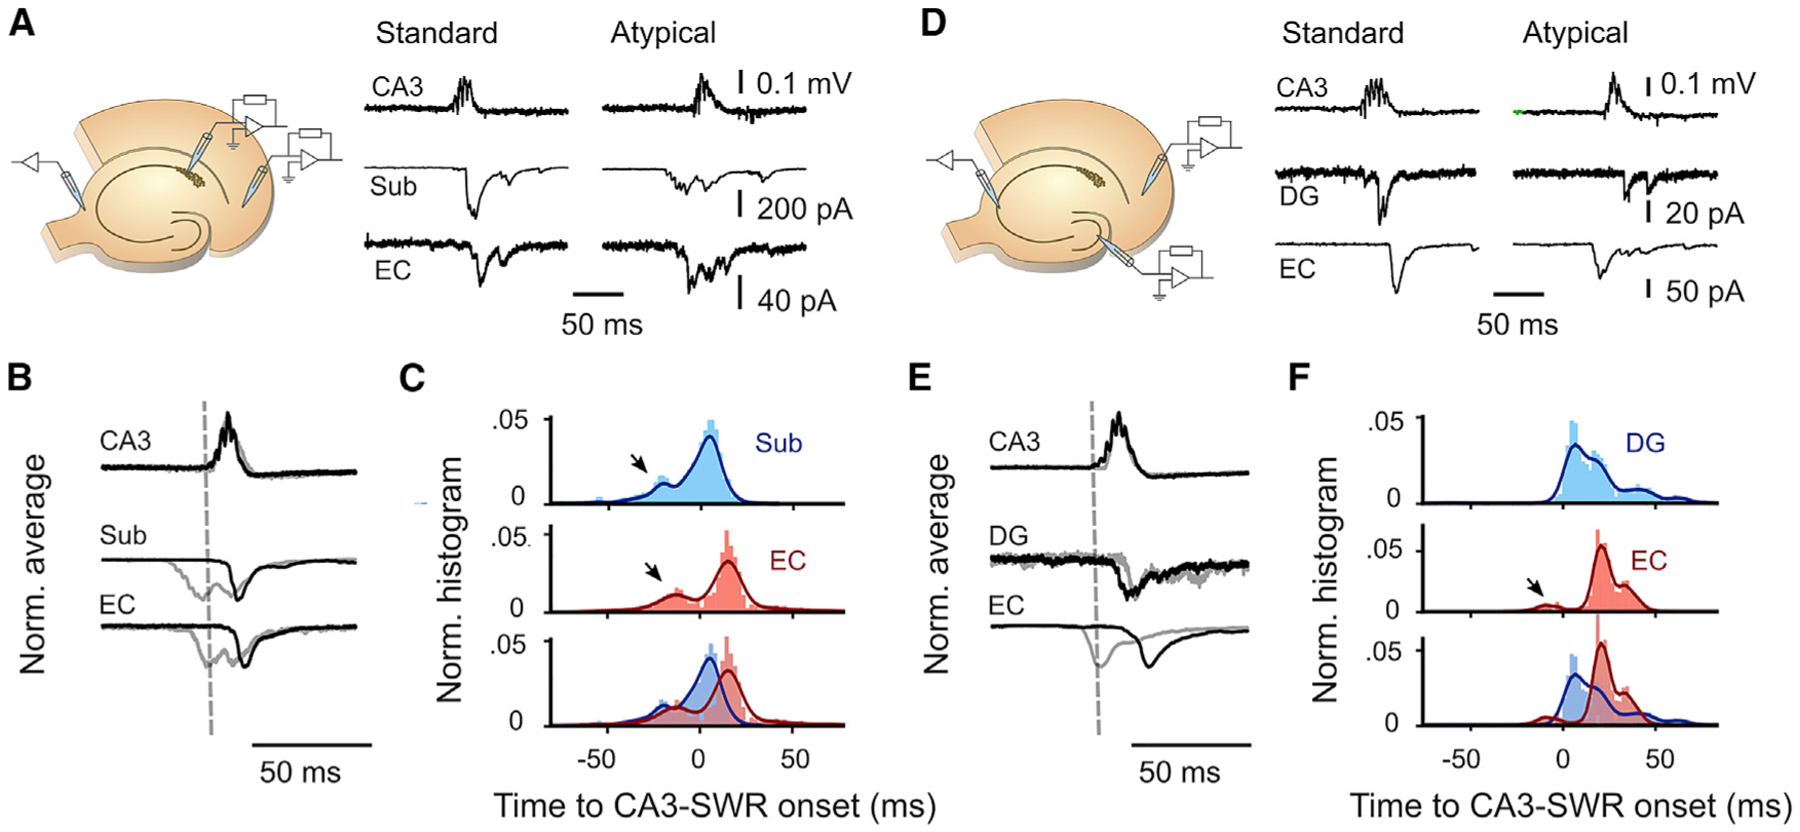
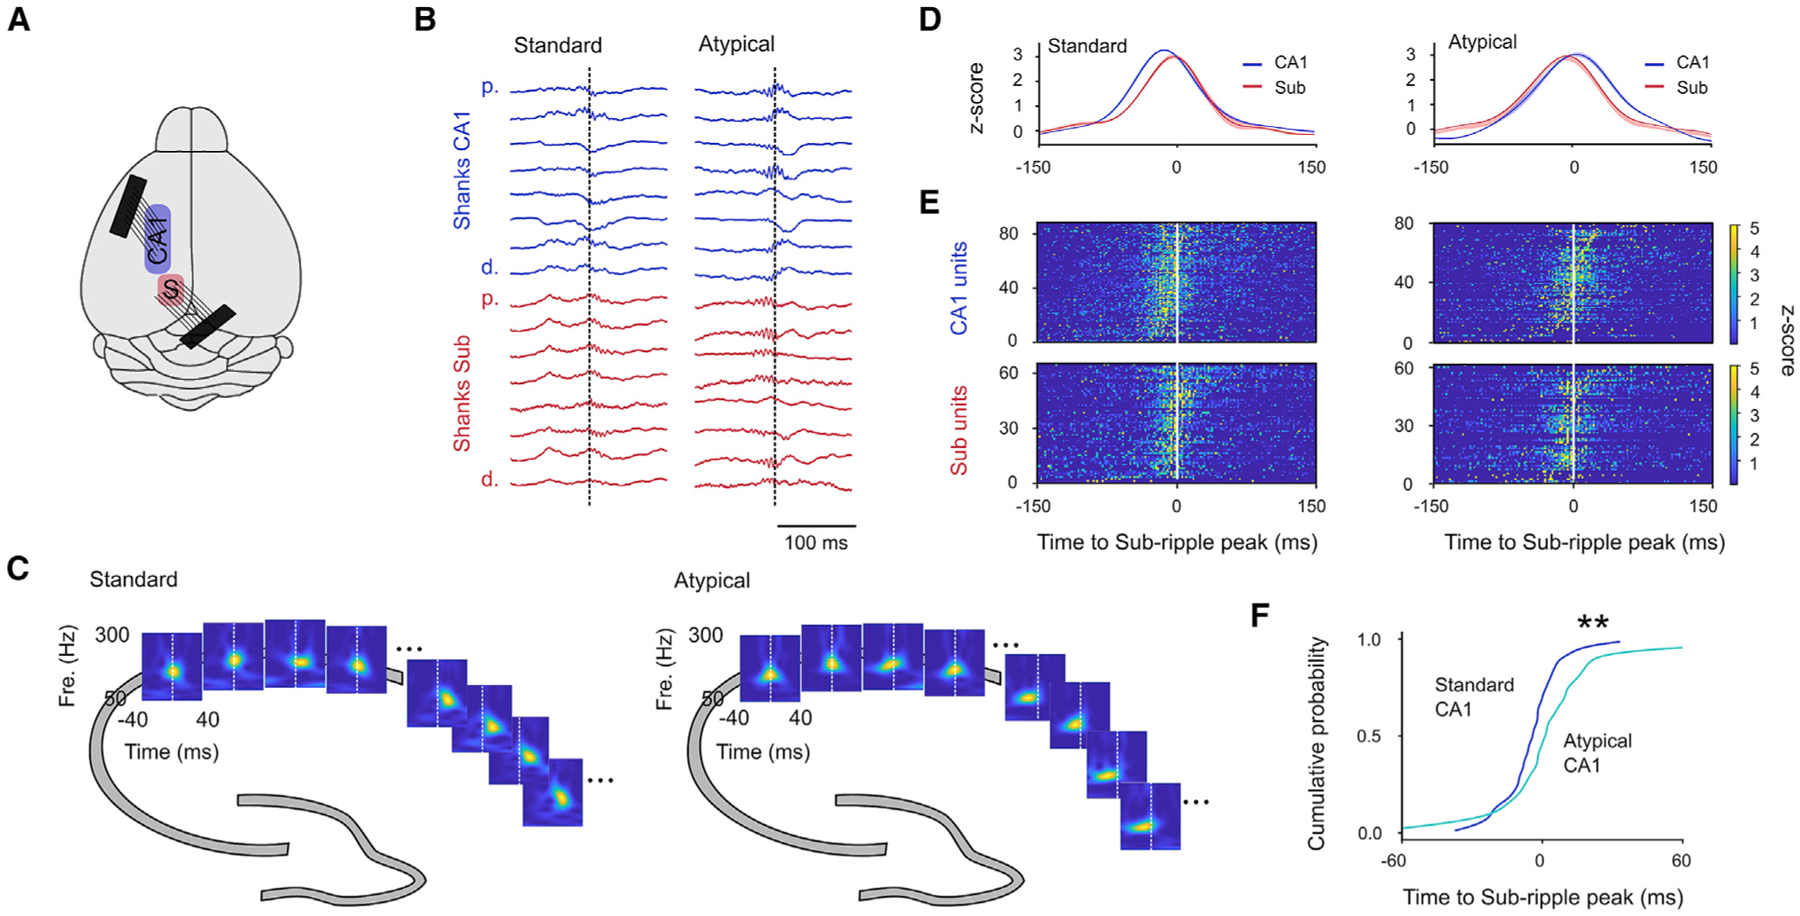
Sharp wave-ripples (SWRs) represent synchronous discharges of hippocampal neurons and are believed to play a major role in memory consolidation. A large body of evidence suggests that SWRs are exclusively generated in the CA3-CA2 network. In contrast, here, we provide several lines of evidence showing that the subiculum can function as a secondary SWRs generator. SWRs with subicular origin propagate forward into the entorhinal cortex as well as backward into the hippocampus proper. Our findings suggest that the output structures of the hippocampus are not only passively facilitating the transfer of SWRs to the cortex, but they also can actively contribute to the genesis of SWRs. We hypothesize that SWRs with a subicular origin may be important for the consolidation of information conveyed to the hippocampus via the temporoammonic pathway.

Keywords: CA1; CA3; entorhinal cortex; hippocampus; oscillations; sharp wave-ripples; subiculum.


Conflict of interest statement

Declaration of interests The authors declare no competing interests.

Figures

Figure 1.
Figure 1.. Multi-channel recordings reveal an atypical site of SWR origin
(A) Representative, 100-ms-long, raw (left) and ripple-filtered (150–300 Hz) (right) signals from the 32 perforated MEA (pMEA) channels showing an SWR event with a standard (top) and an atypical (bottom) propagation. (B) Nissl staining of the hippocampal slice from which the pMEA recordings in (A) were performed. The schematic drawings represent the location of the 32 electrodes of the pMEA. (C) Percentage of SWRs with an atypical origin and propagation in different slices. (D) Pseudocolor maps representing the amplitude Z scores of the SWR voltage deflections shown in (A). Each plot represents a 4-ms time frame. Displayed data correspond to the signal within the gray shading boxes in (A). On top, the population activity first arises in channels covering the proximal CA1 and displays positive/negative voltages presumably reflecting Schaffer collateral-associated input from CA3, before propagating toward distal CA1 and the subiculum. On the bottom, the population activity first arises in distal CA1 and then propagates bidirectionally, toward proximal CA1 and the subiculum.
Figure 2.
Figure 2.. A secondary SWR generator in the subiculum
(A) The sites of simultaneous LFP recordings (top) and a representative Nissl staining of one of the probed slices (bottom). (B and C) Representative raw (black) and ripple-filtered (150–300 Hz) (light blue) signals showing a SWR propagating along the standard path from CA3, to CA1 and subiculum (standard SWR) (B) and their respective ripple-filtered wavelet spectrograms (C). Time zero refers to the peak of the CA3-SWRs. (D and E) Same as in (B) and (C), but for an event emerging first in the subiculum and propagating backward (atypical SWR). Scale bars in (B) and (D): 100 μV (black) and 40 μV (light blue). (F) Representative raw (black) and multi-unit activity (MUA)-filtered (>500 Hz) (blue) signals from a standard (left) and an atypical SWR (right). Scale bars: 100 μV (black) and 100 μV (blue). (G) Raster plots showing the timing of spikes in the 3 regions with respect to the peak of the CA3-SWRs in a representative recording. (H) Normalized peri-SWR spike-time histogram and its kernel density estimate (blue lines) at the 3 different recording sites for the same recording shown in (G). Note the bimodal distribution particularly evident in the subiculum. (I) Percentage of SWRs with respect to their region of origin. (J) Example of a SWR locally confined to CA3-CA1 (left) or to the subiculum (right). Scale bars: 100 μV (black) and 50 μV (light blue). (K) Percentage of locally confined SWRs with respect to their region of origin.
Figure 3.
Figure 3.. The subiculum as independent, secondary SWR generator
(A) The recording sites of a hippocampal slice before (top) and after (bottom) removal of the entorhinal cortex (EC). (B and C) Normalized peri-SWR spike-time histograms and their kernel density estimates (blue lines) at the 3 different recording sites before (B) and after (C) the removal of the EC in the same slice. (D) The recording in the isolated subiculum. (E) Representative LFP recording from the subiculum (top). The detected SWRs are marked with the numbers 1–4. On the bottom, the detected SWRs (raw and ripple filtered signals, in black and blue, respectively) are displayed at higher temporal resolution.
Figure 4.
Figure 4.. Propagation of standard and atypical SWRs in the EC
(A) The location of the LFP and patch-clamp recordings (top) and the reconstruction of a neuron recorded in the deep layers of the EC (bottom right) with the respective voltage traces in response to step currents (−280, −160, 200, and 400 pA) (bottom left). (B) LFP recording from the area CA3 showing spontaneously occurring SWRs (top) and simultaneous whole-cell current-clamp recording from an EC deep layer neuron (bottom). The presence of postsynaptic potentials (EC-PSPs) coupled to SWRs demonstrates the efficient propagation of SWRs in hippocampal-entorhinal slices. (C) The SWR-PSP pairs in the colored shaded boxes in (B) are displayed at a higher temporal resolution. Note the presence of CA3-SWRs followed (blue) and preceded (green) by an EC-PSP, most likely corresponding to standard and atypically originated SWRs, and an event that failed to propagate to the EC (gray). (D) Percentage of standard, atypical, and locally confined SWRs in all recordings in which both standard and atypical SWRs were detected. (E) Normalized peri-SWR EC-PSP-time histogram from all recordings in which both standard and atypical SWRs were detected. Note the bimodal distribution of the histogram emphasizing the presence of 2 different temporal associations between CA3-SWRs and synaptic inputs in the EC.
Figure 5.
Figure 5.. SWRs with atypical origin propagate to the EC, but do not re-enter the hippocampus via dentate gyrus (DG)
(A) Illustration (left) and representative traces (right) of simultaneous CA3-LFP and dual whole-cell recordings from neurons in the subiculum (Sub) and in the deep layers of the EC (EC). (B) Average of voltage signals from all standard and atypical SWRs (black and gray, respectively) (top) and for the associated PSCs in a subicular (center) and an EC neuron (bottom) in 1 recording. (C) Normalized peri-SWR PSC onset-time histogram and its kernel density estimate (solid lines) from all double-patch clamp recordings with subicular (blue) and EC (red) neurons in which both standard and atypical SWRs were detected (overlaid histograms, bottom). Note similar bimodal distributions in both histograms. (D) Illustration (left) and representative traces (right) of simultaneous CA3-LFP and dual whole-cell recordings from a DG granule cell (DG) and a neuron in the deep layers of the EC (EC). Note the absence of DG granule cells inputs before the CA3-SWR. (E) Average voltage signals from all standard (black) and atypical (gray) SWRs (top) and for the associated PSCs in a DG granule cell (center) and an EC neuron (bottom) in 1 recording. (F) Normalized peri-SWR PSC onset-time histogram and its kernel density estimate (solid lines) from all DG (blue) and EC neuron recordings (red), in which both standard and atypical SWRs were detected (overlaid histograms, bottom). Note the absence of bimodality for DG data.
Figure 6.
Figure 6.. Standard and atypical ripple propagation in freely moving rats in vivo
(A) Representative illustration showing the position of the 2 probes in CA1 and the subiculum. (B) Representative LFP traces showing a ripple epoch with standard propagation from CA1 to subiculum (left) and atypical propagation from subiculum to CA1 (right). Each trace represents the ripple-centered signal from the channel displaying the highest power in the ripple band for each shank (from top to bottom: proximal (p.)–distal (d.) CA1, blue; subiculum, red. For better visualization of the timing of the signals, amplitudes are displayed in arbitrary values. (C) Normalized ripple-triggered wavelet spectrograms; the 4 most proximal CA1 and subiculum channels in (B) are shown. Note the difference in timing for standard and atypical ripples. (D and E) Peri-ripple Z scored means (lines) ± SEMs (lighter areas) spike time (D) histograms and (E) raster plots from all units detected in CA1 and subiculum showing that the recruitment of neurons in both areas follows a different temporal order for standard (left) or atypical (right) ripples. (F) Cumulative probability functions for CA1 units during standard and atypical ripples (89 and 81 neurons, respectively, from 4 recordings from 2 rats) representing time points at which CA1 units reach 50% of their total spike counts in a window of ±250 ms from the peak of subicular ripples. Ripple-related firing occurs later in atypical compared to standard ripples (Mann-Whitney U test, p = 0.0012).

Similar articles

Cited by

References

    1. Ang CW, Carlson GC, and Coulter DA (2005). Hippocampal CA1 circuitry dynamically gates direct cortical inputs preferentially at theta frequencies. J. Neurosci 25, 9567–9580. - PMC - PubMed
    1. Battaglia FP, Sutherland GR, and McNaughton BL (2004). Hippocampal sharp wave bursts coincide with neocortical “up-state” transitions. Learn. Mem 11, 697–704. - PMC - PubMed
    1. Böhm C, Peng Y, Maier N, Winterer J, Poulet JF, Geiger JR, and Schmitz D (2015). Functional diversity of subicular principal cells during hippocampal ripples. J. Neurosci 35, 13608–13618. - PMC - PubMed
    1. Bragin A, Jandó G, Nádasdy Z, van Landeghem M, and Buzsáki G (1995). Dentate EEG spikes and associated interneuronal population bursts in the hippocampal hilar region of the rat. J. Neurophysiol 73, 1691–1705. - PubMed
    1. Buzsáki G (1986). Hippocampal sharp waves: their origin and significance. Brain Res. 398, 242–252. - PubMed

Publication types

MeSH terms

LinkOut - more resources