. 2021 Apr 20;35(3):109008.
doi: 10.1016/j.celrep.2021.109008.

Alzheimer's pathology causes impaired inhibitory connections and reactivation of spatial codes during spatial navigation

Affiliations

Alzheimer's pathology causes impaired inhibitory connections and reactivation of spatial codes during spatial navigation

Stephanie M Prince et al. Cell Rep. .

Abstract

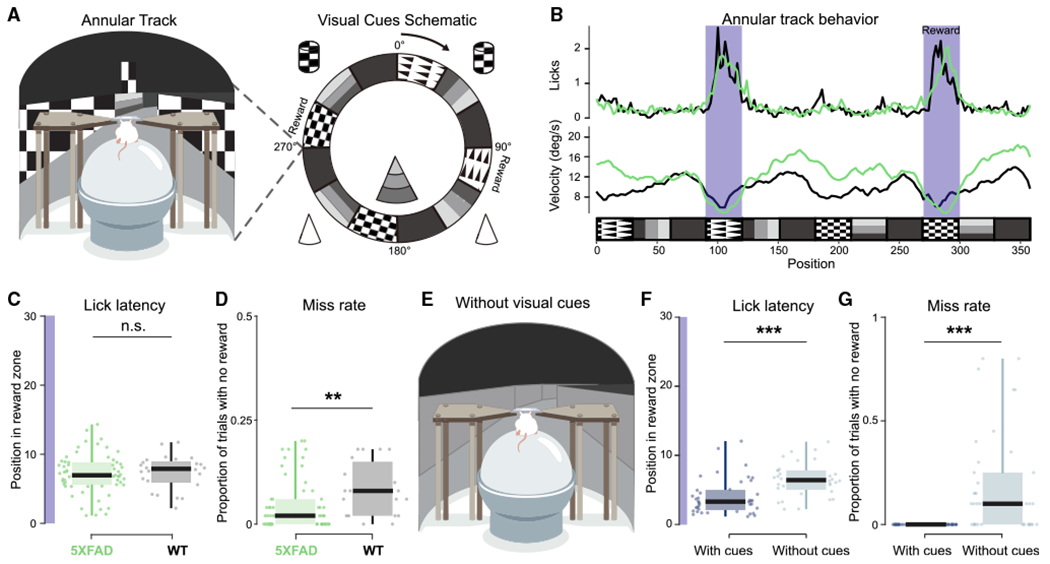
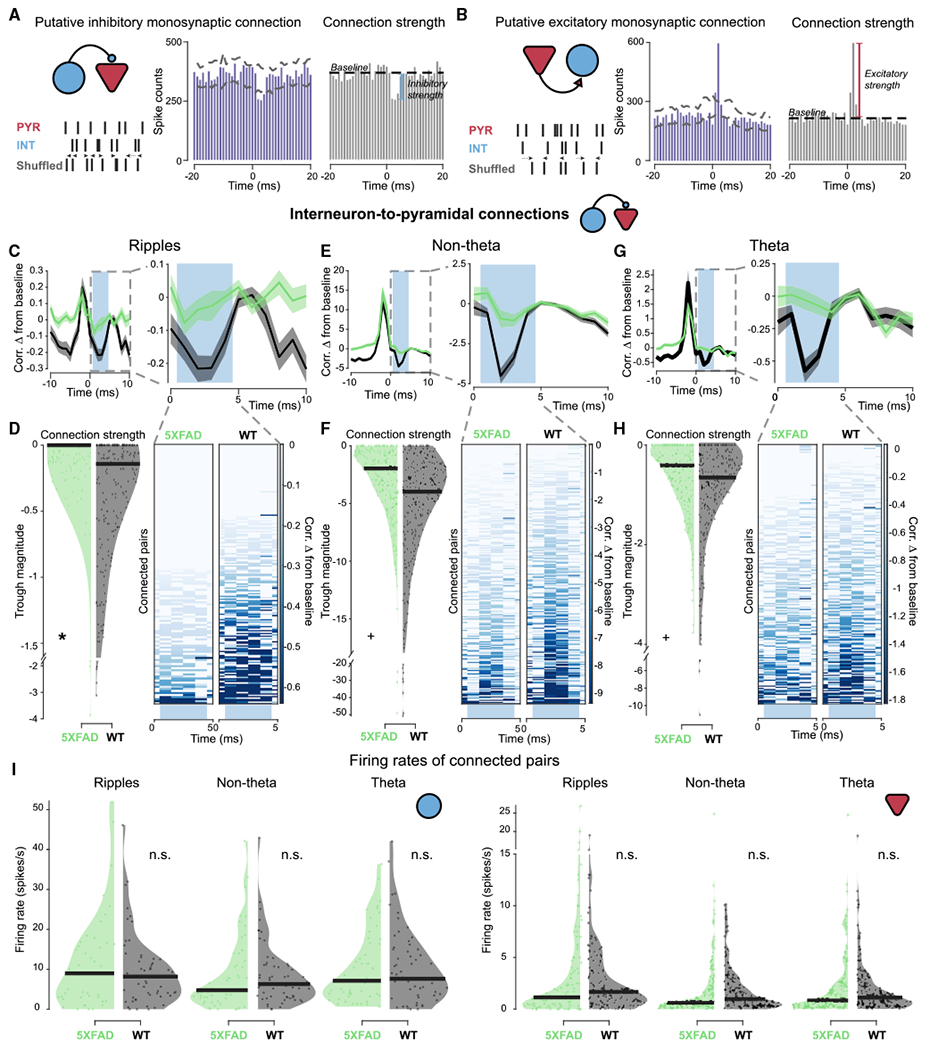
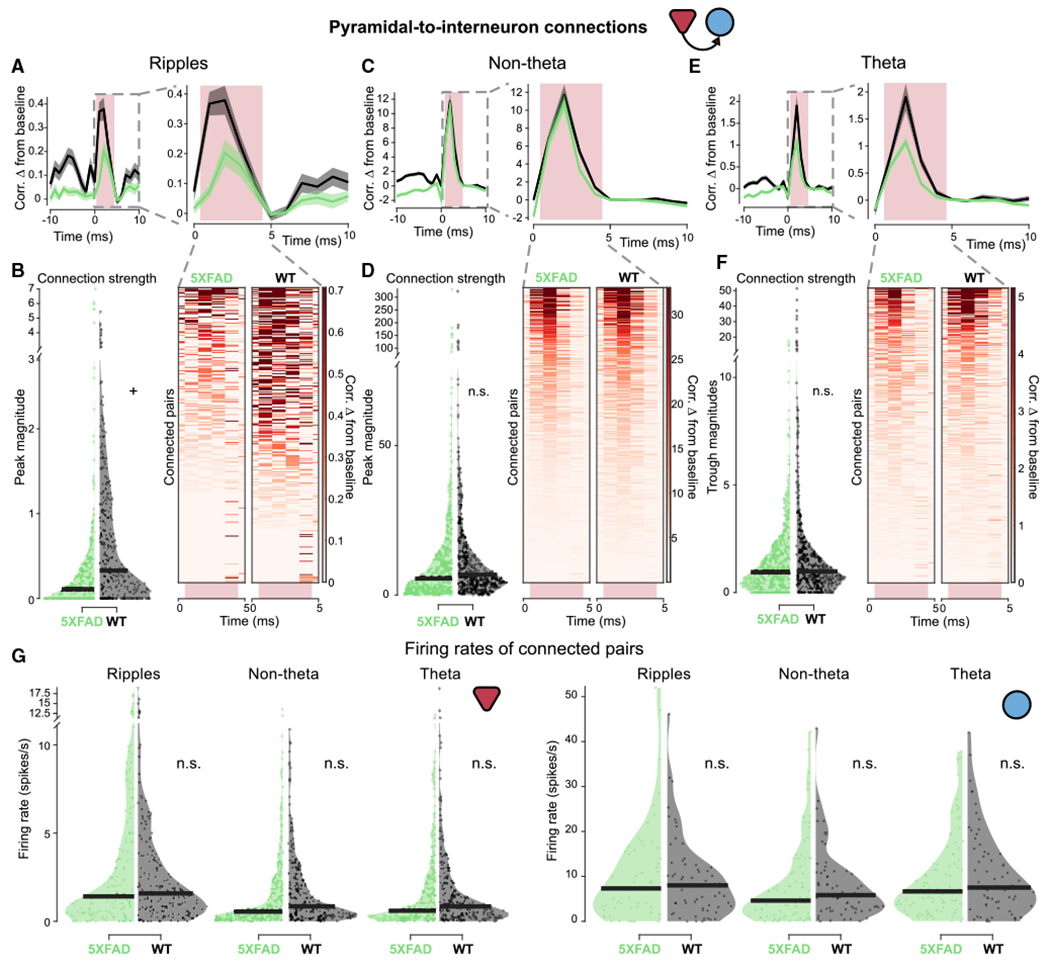
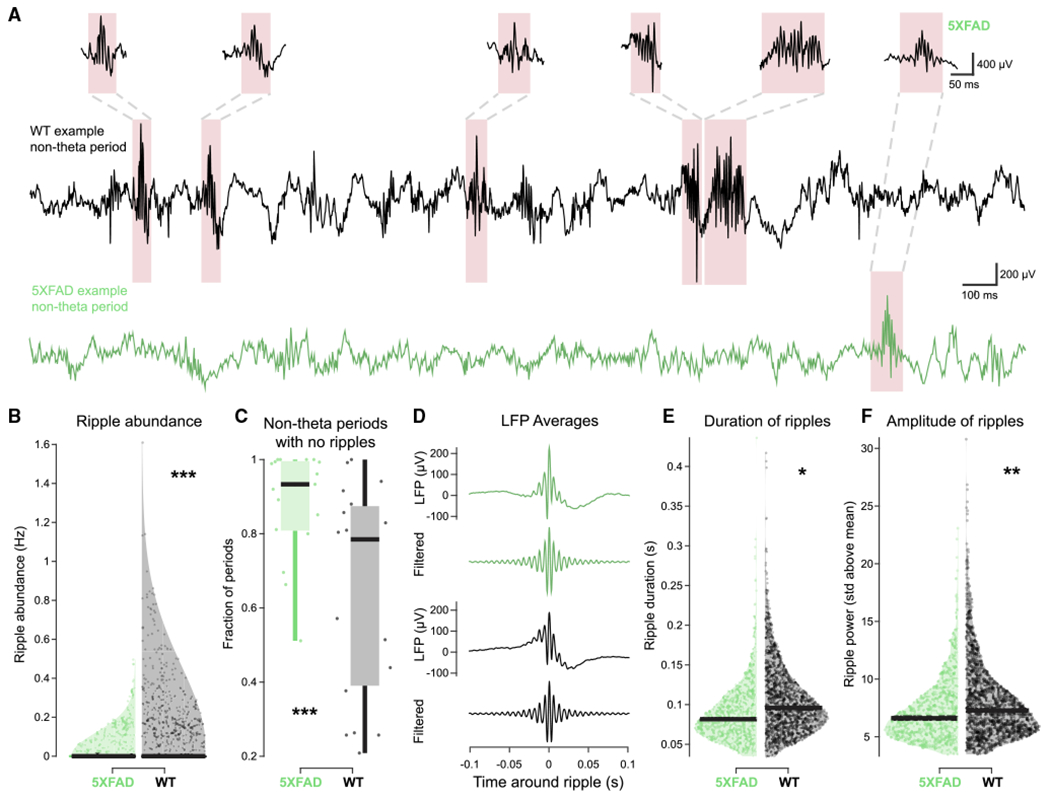
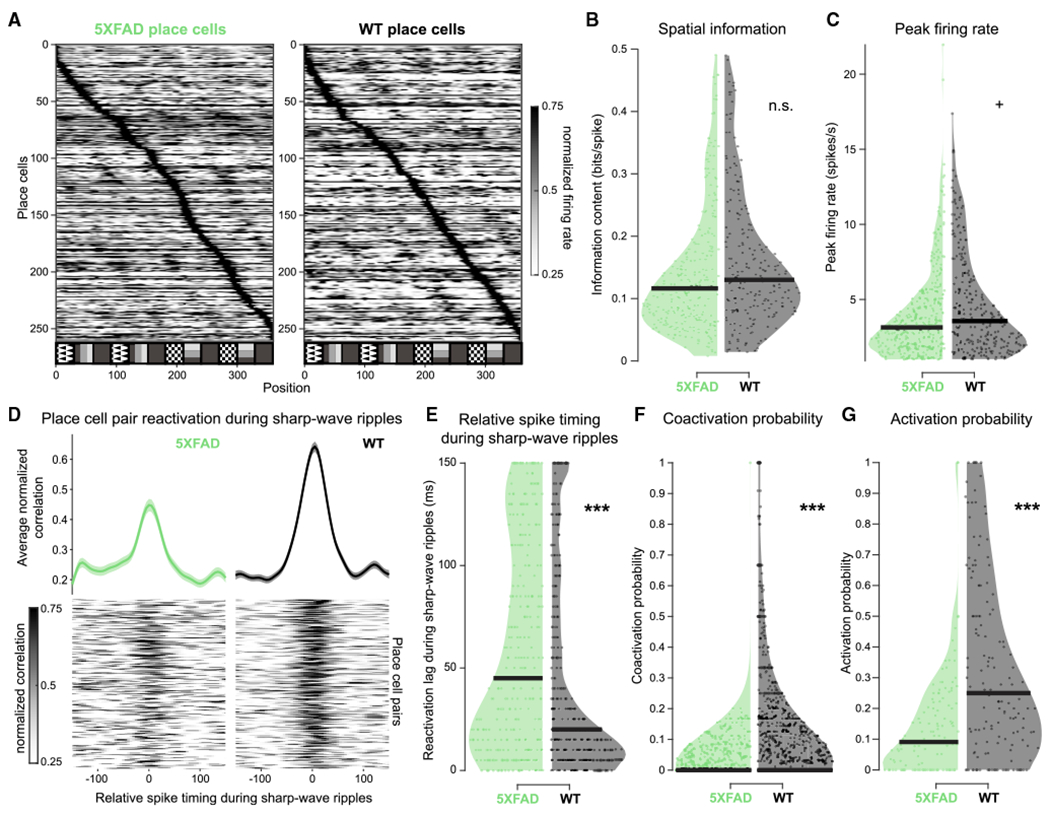
Synapse loss and altered synaptic strength are thought to underlie cognitive impairment in Alzheimer's disease (AD) by disrupting neural activity essential for memory. While synaptic dysfunction in AD has been well characterized in anesthetized animals and in vitro, it remains unknown how synaptic transmission is altered during behavior. By measuring synaptic efficacy as mice navigate in a virtual reality task, we find deficits in interneuron connection strength onto pyramidal cells in hippocampal CA1 in the 5XFAD mouse model of AD. These inhibitory synaptic deficits are most pronounced during sharp-wave ripples, network oscillations important for memory that require inhibition. Indeed, 5XFAD mice exhibit fewer and shorter sharp-wave ripples with impaired place cell reactivation. By showing inhibitory synaptic dysfunction in 5XFAD mice during spatial navigation behavior and suggesting a synaptic mechanism underlying deficits in network activity essential for memory, this work bridges the gap between synaptic and neural activity deficits in AD.

Keywords: 5XFAD; Alzheimer’s disease; inhibition; interneurons; monosynaptic connections; neural coding; place cells; reactivation; sharp-wave ripples.


Conflict of interest statement

Declaration of interests The authors declare no competing interests.

Figures

Figure 1.
Figure 1.. 5XFAD mice and wild-type (WT) littermates lick for reward in a virtual reality spatial task
(A) Left: schematic of virtual reality experimental setup. Right: annular track spatial navigation task with local and distal cues. (B) Example of lick and velocity rate averaged over 50 trials of 5XFAD (green) and WT (black) mice as a function of position in the annular track. Each trial is considered one lap around the annular track. Reward zones are indicated in dark purple. (C) Lick latency (position at the first lick after reward zone entry) for 50-trial blocks for all sessions in 5XFAD (green) and WT (black) mice from the start of the reward zone (degree 0) to the end of the reward zone(degree 30) on trials when the animal received a reward. Dot indicates 50-trial block. Purple highlight indicates length of reward zone. 5XFAD, 7.13 ± 0.72 degrees, n = 8 animals; WT, 7.38 ± 1.01 degrees, n = 4 animals (only including animals with >50 trials); prob(WT ≥ 5XFAD) = 0.64; 5XFAD, n = 59 trial blocks, lick latency percentiles = 1.12, 5.59, 6.95, 8.82, 14.32; WT, n = 24 trial blocks, lick latency percentiles = 2.19, 6.01, 7.90, 8.91, 11.74. (D) Miss rate (number of laps around the annular track with zero rewards received) for 50-trial blocks for all sessions in 5XFAD (green) and WT (black) mice. Each dot indicates a 50-trial-block, 5XFAD, 4.3% ± 1.46% trials with zero rewards; WT, 8.4% ± 2.72%; prob(WT ≥ 5XFAD) = 0.996**; 5XFAD, n = 60 trial blocks, miss rate percentiles = 0, 0, 0.02, 0.060, 0.20; WT, n = 19 trial blocks, miss rate percentiles = 0, 0.02, 0.08, 0.14, 0.18. (E) Annular track spatial navigation task with visual cues removed. (F) As in (C) for track with and without visual cues. Dark blue indicates data from last two sessions in the annular track with visual cues, and light blue indicates the first two sessions in the annular track without visual cues. Track with cues: 5XFAD, 5.63 ± 1.37; WT, 3.02 ± 0.56; track without cues: 5XFAD, 7.65 ± 0.69; WT, 4.99 ± 0.14; prob(with cues ≥ without cues) < 10−4 (limit due to resampling 104 times)***; with visual cues: 5XFAD, n = 3 animals, lick latency percentiles = 2.46, 3.30, 4.95, 6.94, 12.06; WT, n = 3 animals, lick latency percentiles = 1.14, 1.68, 2.44, 3.50; without visual cues: 5XFAD, n = 3 animals, lick latency percentiles = 6.89, 6.97, 7.22, 7.60, 9.56; WT, n = 3 animals, lick latency percentiles = 3.15, 3.58, 4.57, 6.34, 7.48. (G) As in (D) for track with visual cues (dark blue) versus the track without visual cues (light blue) in 5XFAD and WT mice. Track with cues: 5XFAD, 0 ± 0, WT, 0 ± 0 miss trials; track without cues: 5XFAD, 34.5% ± 0.19% miss trials; WT, 40.22% ± 0.32% miss trials; prob(with cues ≥ without cues) < 10−4 (limit due to resampling 104 times)***; with visual cues: 5XFAD, n = 3 animals, miss rate percentiles = 0, 0, 0, 0, 0; WT, n = 2 animals, miss rate percentiles = 0, 0, 0, 0, 0; without visual cues: 5XFAD, n = 3 animals, miss rate percentiles = 6.89, 6.97, 7.22, 7.60, 9.56; WT, n = 3 animals, miss rate percentiles = 3.15, 3.58, 4.57, 6.34, 7.47. See also Figure S1. Boxplot edges indicate quartiles, whiskers indicate range, and black bar indicates median. All percentiles are minimum, 25th percentile, median, 75th percentile, maximum. All statistics were performed with a hierarchical bootstrap analysis to determine the direct probability that the resampled mean of WT mice is greater than the resampled mean of 5XFAD mice, in contrast to statistical methods that test whether to reject the null hypothesis. Using this method the probability that WT mice have significantly larger resampled means than do 5XFAD mice is indicated by prob(WT ≥ 5XFAD)>0.975, or prob> 1 – α/2 where α is the significance level. The probability that WT mice have significantly smaller resampled means than do 5XFAD mice is indicated by prob(WT ≥ 5XFAD) < 0.025, or prob < α/2 (see STAR Methods). **prob > 0.995 or prob < 0.005 (α = 0.01); ***prob > 0.9995 or prob < 0.0005 (α = 0.001); n.s., not significant.
Figure 2.
Figure 2.. Interneuron-to-pyramidal (INT-to-PYR) monosynaptic connections are weaker in 5XFAD mice
(A) Schematic of monosynaptic connection identification analysis and quantification of inhibitory connection strength. Left: connection type and illustration of shuffled spike train controls. (Center) Example of putative INT-to-PYR connection with cross-correlation values from −20- to +20-ms lags; dashed lines indicate the maximum and minimum values of the cross-correlation of shuffle controls. Connections were identified by a significant trough below the shuffle controls in the 1- to 3-ms range. Right: schematic of inhibitory connection strength: baseline (an average taken outside the 1- to 4-ms window) minus the trough (minimum value in the 1- to 4-ms window) of the cross-correlogram (CCG). (B) As in (A) for excitatory connection strength of a PYR-to-INT connection. (C) Left: average CCG of monosynaptically connected INT-to-PYR cell pairs between 5XFAD (green) and WT (black) mice during sharp-wave ripple (SWR) periods from −10- to +10-ms lags normalized by geometric mean firing rate and displayed as difference from baseline, mean ± SEM. Right: zoomed-in view of average CCG on left from 0 to 10-s lag. Light blue box indicates region where connection strength was measured. Inhibitory connection strength was measured as the minimum value in the 1- to 4-ms window. The CCGs that were rectified for the strength measurement are not included in the visualization of the average and individual CCGs. Statistics are described in (D). (D) Connection strength as measured by trough magnitude in 5XFAD and WT mice during SWR periods. Each dot indicates the connection strength measured from a single INT-to-PYR cell pair-across all SWR periods. (Right) individual CCGs of putative INT-to-PYR cell connected pairs during SWR periods that make up the average shown above in (C). Heatmap indicates change in correlation from baseline measurement. Note CCGs during SWRs look more variable because there are fewer spikes during SWRs than during non-theta and theta periods. The number of spikes included in this figure was 49,649 in 5XFAD mice and 167,402 in WT mice. 5XFAD, −0.14 ± 0.13 trough magnitude; WT, −0.38 ± 0.19 trough magnitude; prob(5XFAD ≥ WT) = 0.981*, here 5XFAD ≥ WT indicates a deficit in inhibition because inhibitory troughs are negative; 5XFAD, n = 146INT-to-PYR cell pairs; connection strength percentiles = −3.86, −0.13,0, 0, 0; WT, n = 213 INT-to-PYR cell pairs; connection strength percentiles = −3.12, −0.59, −0.14, 0, 0. (E) As in (C) for INT-to-PYR connections during non-theta periods. Statistics are described in (F). (F) As in (D) for INT-to-PYR connections during non-theta periods. The number of spikes included in this figure was 12,201,118 in 5XFAD mice and 15,240,501 in WT mice. 5XFAD, −3.25 ± 1.04 trough magnitude; WT, −5.78 ± 2.61 trough magnitude; prob(5XFAD ≥ WT) = 0.954+; 5XFAD, n = 250 INT-to-PYR cell pairs, connection strength percentiles = −49.17, −4.35, −1.96, −0.59, 0; WT, n = 249 INT-to-PYR cell pairs, connection strength percentiles = −50.78, −7.46, −3.98, −1.88, 0. (G) As in (C) for INT-to-PYR connections during theta periods. Statistics are described in (H). (H) As in (D) for INT-to-PYR connections during theta periods. The number of spikes included in this figure was 1,122,202 in 5XFAD mice and 1,451,377 in WT mice. 5XFAD, −0.61 ± 0.22 trough magnitude; WT, −0.99 ± 0.44 trough magnitude; prob(5XFAD ≥ WT) = 0.952+; 5XFAD, n = 257 INT-to-PYR cell pairs, connection strength percentiles = −3.77, −0.93, −0.41, 0, 0; WT, n = 244 INT-to-PYR cell pairs, connection strength percentiles = −11.06, −1.29, −0.65, −0.25, 0. (I) Firing rates for putative INT-to-PYR cell connected pairs during the time periods of interest in 5XFAD (green) versus WT (black) mice. (Left) Firing rates of pre-synaptic interneurons during time periods of interest; a single dot represents one single unit even when it is part of multiple cell pairs. During ripples: 5XFAD, 11.66 ± 4.50 Hz; WT, 9.67 ± 2.91; prob(WT ≥ 5XFAD) = 0.24; 5XFAD, 43 interneurons, firing rate percentiles = 0, 3.00, 9.00, 16.48, 51.95; WT, n = 56 interneurons, firing rate percentiles = 0, 3.52, 8.20, 12.53, 46.12; non-theta: 5XFAD, 8.59 ± 3.14; WT, 8.43 ± 2.53; prob(WT ≥ 5XFAD) = 0.46; 5XFAD, n = 54 interneurons, firing rate percentiles = 0, 2.71, 4.78, 11.87, 42.16; WT, n = 59 interneurons, firing rate percentiles = 0, 3.05, 6.32, 11.00, 42.92; theta: 5XFAD, 10.27 ± 2.74; WT, 10.53 ± 2.95, prob(WT ≥ 5XFAD) = 0.54; 5XFAD, 54 interneurons, firing rate percentiles = 0.62, 3.72, 7.11, 15.62, 36.32; WT, n = 59 interneurons, firing rate percentiles = 0, 3.61, 7.65, 14.96, 42.01. (Right) Firing rates of post-synaptic pyramidal cells during time periods of interest. During ripples: 5XFAD, 3.17 ± 1.78; WT, 2.80 ± 0.65, prob(WT ≥ 5XFAD) = 0.38; 5XFAD, n = 108 pyramidal cells, firing rate percentiles = 0, 0.36, 1.14, 3.94, 26.97; WT, n = 131 pyramidal cells, firing rate percentiles = 0, 0.60, 1.67, 3.75, 18.98; non-theta: 5XFAD, 1.78 ± 0.64; WT, 1.96 ± 0.43; prob(WT ≥ 5XFAD) = 0.72; 5XFAD, n = 175 pyramidal cells, firing rate percentiles = 0, 0.27, 0.61, 2.01, 24.79; WT, n = 161 pyramidal cells, firing rate percentiles = 0, 0.34, 0.98, 2.68, 10.16; theta: 5XFAD, 2.01 ± 0.68; WT, 1.95 ± 0.56; prob(WT ≥ 5XFAD) = 0.47; 5XFAD, n = 171 pyramidal cells, firing rate percentiles = 0, 0.24, 0.82, 2.39, 24.53; WT, n = 160 pyramidal cells, firing rate percentiles = 0, 0.41, 1.09, 2.41, 18.80. See also Figures S2, S3, and S5. Black bar indicates median for violin plots. All percentiles are minimum, 25th percentile, median, 75th percentile, maximum. +prob > 0.95 or prob < 0.05 (α = 0.10); *p > 0.975 or prob < 0.025 (α = 0.05); n.s., not significant throughout as tested by the hierarchical bootstrap analysis, which directly tests the hypothesis that the resampled means differ instead of the likelihood that the null hypothesis should be rejected.
Figure 3.
Figure 3.. PYR-to-INT monosynaptic connections in 5XFAD mice
(A) (Left) Average cross-correlogram (CCG) of monosynaptically connected PYR-to-INT cell pairs between 5XFAD (green) and WT (black) mice during SWR periods from −10- to +10-ms lags. Normalized by geometric mean firing rate and displayed as difference from baseline, mean ± SEM. (Right) View of average CCG on left from 0 to 10-ms lag. Light pink box indicates region where connection strength was measured. Excitatory connection strength was measured as the maximum value in the 1- to 4-ms window. Statistics are described in (B). (B) Left: connection strength as measured by peak magnitude in 5XFAD and WT mice during SWR periods. Dot indicates the connection strength measured from a single PYR-to-INT cell pair across all SWR periods. Right: individual CCGs of putative PYR-to-INT cell connected pairs during SWR periods. The individual CCGs make up the average shown above. Heatmap indicates change in correlation from baseline measurement. Note CCGs during SWRs look more variable because there are significantly fewer spikes during SWRs than during non-theta and theta periods. The number of spikes included in this figure was 116,444 in 5XFAD mice and 243,457 in WT mice. 5XFAD, 0.36 ± 0.28 peak magnitude; WT, 0.70 ± 0.24 peak magnitude; prob(WT ≥ 5XFAD) = 0.96+; 5XFAD, n = 306 PYR-to-INT cell pairs, connection strength percentiles = 0, 0, 0.12, 0.35, 7.01; WT, n = 349 PYR-to-INT cell pairs, connection strength percentiles = 0, 0, 0.32, 1.11, 5.40 (minimum, 25th percentile, median, 75th percentile, and maximum, respectively). (C) As in (A) for PYR-to-INT connections during non-theta periods. Statistics are described in (D). (D) As in (B) for PYR-to-INT connections during non-theta periods. The number of spikes included in this figure was 12,201,118 in 5XFAD mice and 21,369,627 in WT mice. 5XFAD, 12.70 ± 5.35 peak magnitude; WT, 13.81 ± 6.08 peak magnitude; prob(WT ≥ 5XFAD) = 0.62; 5XFAD, n = 527 PYR-to-INT cell pairs, connection strength percentiles = 0, 1.91, 5.55, 13.61, 330.81; WT, n = 447 PYR-to-INT cell pairs, connection strength percentiles = 0, 3.51, 6.78, 13.89, 323.36. (E) As in (A) for PYR-to-INT connections during theta periods. Statistics are described in (F). (F) As in (B) for PYR-to-INT connections during theta periods. The number of spikes included in this figure was 2,362,729 in 5XFAD mice and 2,258,135 in WT mice. 5XFAD, 1.51 ± 0.54 peak magnitude; WT, 2.32 ± 1.32 peak magnitude; prob(WT ≥ 5XFAD) = 0.89; 5XFAD, n = 539 PYR-to-INT cell pairs, connection strength percentiles = 0, 0.36, 0.95, 1.93, 17.53; WT, n = 442 PYR-to-INT cell pairs, connection strength percentiles = 0, 0.52, 1.00, 1.99, 51.43. (G) Firing rates for putative PYR-to-INT cell connected pairs during the time periods of interest in 5XFAD (green) versus WT (black) mice. (Left) firing rates of pre-synaptic pyramidal cells during time periods of interest, each single unit is represented once even when it is part of multiple cell pairs. During ripples: 5XFAD, 3.35 ± 1.42; WT, 2.72 ± 0.65; prob(WT ≥ 5XFAD) = 0.22; 5XFAD, n = 153 pyramidal cells, firing rate percentiles = 0,0.47, 1.40, 4.50, 26.97; WT, n = 168 pyramidal cells, firing rate percentiles = 0, 0.64, 1.58, 3.63, 18.98; non-theta: 5XFAD, 1.57 ± 0.42; WT, 1.72 ± 0.38; prob(WT ≥ 5XFAD) = 0.73; 5XFAD, n = 293 pyramidal cells, firing rate percentiles = 0, 0.19, 0.55, 1.91, 24.79; WT, n = 238 pyramidal cells, firing rate percentiles = 0, 0.30, 0.85, 2.33, 10.88; theta: 5XFAD, 1.73 ± 0.47; WT, 1.73 ± 0.47; prob(WT ≥ 5XFAD) = 0.51; 5XFAD, n = 284 pyramidal cells, firing rate percentiles = 0, 0.20, 0.59, 2.20, 24.53; WT, n = 234 pyramidal cells, firing rate percentiles = 0, 0.30, 0.85, 2.16, 18.80. (Right) Firing rates of post-synaptic interneurons during time periods of interest. During ripples: 5XFAD, 10.31 ± 3.54; WT, 9.30 ± 2.66; prob(WT ≥ 5XFAD) = 0.36, 5XFAD, n = 57 interneurons, firing rate percentiles = 0, 3.00, 7.31, 15.45, 51.95; WT, n = 63 interneurons, firing rate percentiles = 0, 3.02, 7.99, 12.24, 46.12; non-theta: 5XFAD, 8.00 ± 2.32; WT, 8.08 ± 2.49; prob(WT ≥ 5XFAD) = 0.53; 5XFAD, n = 83 interneurons, firing rate percentiles = 0, 1.35, 4.60, 10.82, 42.16; WT, n = 67 interneurons, firing rate percentiles = 0, 2.77, 5.83, 10.80, 42.92; theta: 5XFAD, 9.43 ± 2.14; WT, 10.29 ± 2.80; prob(WT ≥ 5XFAD) = 0.71; 5XFAD, n = 88 interneurons, firing rate percentiles = 0.029, 2.96, 6.63, 12.68, 37.76; WT, n = 68 interneurons, firing rate percentiles = 0, 3.46, 7.51, 14.95, 42.01. See also Figures S2, S4, and S5. Black bar indicates median for violin plots. All percentiles are minimum, 25th percentile, median, 75th percentile, maximum. +prob > 0.95 or prob < 0.05 (α = 0.10). n.s., not significant throughout.
Figure 4.
Figure 4.. 5XFAD mice have shorter and fewer SWRs compared to WT mice
(A) Example non-theta periods with representative SWRs in 5XFAD (green) and WT (black) mice. (B) Violin plot of SWR abundance during non-theta periods longer than 5 s in 5XFAD (green) versus WT (black) mice. Each dot indicates a non-theta period. Black bar at bottom indicates median. 5XFAD, 0.013 ± 0.0082 SWR abundance (Hz); WT, 0.074 ± 0.043 SWR abundance (Hz); prob(WT ≥ 5XFAD) = 0.9999 (limit due to resampling 104 times)***; 5XFAD, n = 1,969 non-theta periods 5 s or longer, ripple abundance percentiles = 0, 0, 0, 0, 0.50; WT, n = 1,389 non-theta periods 5 s or longer, ripple abundance percentiles = 0, 0, 0, 0.08, 1.61 (minimum, 25th percentile, median, 75th percentile, maximum, respectively). (C) Fraction of non-theta periods 5 s or longer with no SWRs in 5XFAD (green) and WT (black) mice. Each data point indicates a single recording session. Boxplot edges indicate quartiles, whiskers indicate range, and black bar indicates median. 5XFAD, 0.88 ± 0.053 proportion of periods; WT, 0.64 ± 0.098 proportion of periods; prob(WT ≥ 5XFAD)<10−4(limit due to resampling 104 times)***; 5XFAD, n = 17 sessions, fraction of periods with no ripples percentiles = 0.51, 0.81, 0.93, 0.99, 1; WT, n = 19 sessions, fraction of periods with no ripples percentiles = 0.21, 0.40, 0.78, 0.87, 1. (D) Averages of all SWR events in 5XFAD (green) and WT (black) mice aligned by peak of filtered signal. For green and black traces, top indicates LFP signal (1300 Hz) from the peak ripple power channel, and bottom indicates filtered LFP signal (150–250 Hz) from the peak ripple power channel. (E) Distribution of SWR durations in 5XFAD (green) versus WT (black) mice. Each dot indicates a SWR event. Black bar indicates median. SWRs had to be a minimum of 0.015 s above a threshold, so no SWRs are shorter than 0.015 s. 5XFAD, 0.090 ± 0.0098 s; WT, 0.11 ± 0.0074 s; prob(WT ≥ 5XFAD) = 0.9787*; 5XFAD, n = 776 SWRs, ripple duration percentiles = 0.035, 0.065, 0.082, 0.11, 0.44; WT, n = 1,542 SWRs, ripple duration percentiles = −0.034, 0.074, 0.096, 0.13, 0.42. (F) As in (E) for SWR power as measured in standard deviations (SD) above the SWR power mean. SWRs had to be a minimum of 3 SD above the mean, so no SWRs have less power than 3 SD. 5XFAD, 7.29 ± 1.01 SD above the mean; WT, 8.18 ± 0.49 SD above the mean, prob(WT ≥ 5XFAD) = 0.9977**; 5XFAD, n = 776 SWRs, ripple power percentiles = 3.45, 5.35, 6.61,8.48, 23.08; WT, n = 1,542 SWRs, ripple duration percentiles = 3.48, 5.71, 7.28, 9.53, 30.79. See also Figure S6. All percentiles are minimum, 25th percentile, median, 75th percentile, maximum. *prob > 0.975 or prob < 0.025 (α = 0.05); **prob > 0.995 or prob < 0.005 (α = 0.01); ***prob > 0.9995 or prob < 0.0005 (α = 0.001) throughout.
Figure 5.
Figure 5.. Place cells of 5XFAD mice have lower probability of activation and coactivation during SWRs
(A) All place cells in 5XFAD and WT mice, sorted by normalized peak firing rate. (B) Distribution of spatial information of place cells with spatially tuned firing in this task in 5XFAD (green) versus WT (black) mice. Each dot indicates a single place cell. 5XFAD, 0.14 ± 0.016 bits/spike; WT, 0.16 ± 0.018 bits/spike; prob(WT ≥ 5XFAD) = 0.94; 5XFAD, n = 271 place cells, spatial information percentiles = 0.0081, 0.068, 0.12, 0.18, 0.49; WT, n = 215, spatial information percentiles = 0.015, 0.082, 0.13, 0.21, 0.49 (min, 25th percentile, median, 75th percentile, and maximum, respectively). We observed some outliers, and so we removed them as described in STAR Methods. (C) As in (B) for peak firing rate of place cells. 5XFAD, 3.97 ± 0.52 Hz; WT, 4.61 ± 0.53 Hz; prob(WT R 5XFAD) = 0.96+; 5XFAD, n = 336 place cells, firing rate percentiles = 1.01, 1.89, 3.14, 5.03, 21.95; WT, n = 265, firing rate percentiles = 1.03, 2.02, 3.56, 6.29, 17.37. (D) Reactivation during SWR events of place cell pairs with spiking near in time during theta in 5XFAD and WT mice. (Bottom) Heatmaps of normalized CCGs of place cell pairs during SWR with spiking near in time during theta (lower half of the activity index of all place cell pairs). (Top) Average of all place cell pair reactivation during SWR events with spiking near in time during theta, mean ± SEM. Activity index distributions: 5XFAD, 0.37 ± 0.035, n = 335 place cell pairs; WT, 0.28 ± 0.065, n = 387 place cell pairs; prob(WT ≥ 5XFAD) = 0.030, bootstrap test. (E) Relative spike timing during SWRs in place cells that spike near in time during theta in 5XFAD (green) and WT (black) mice. Each dot indicates the peak reactivation lag of a single place cell pair across all SWR events. The number of spikes included in this figure was 107,276 in 5XFAD mice and 131,910 in WT mice. 5XFAD, 59.84 ± 7.37 ms; WT, 43.41 ± 5.77 ms; prob(WT ≥ 5XFAD) = 0.0003***; 5XFAD, n = 335 place cell pairs, spike timing lags during ripples percentiles = 0, 10, 45, 110, 150; WT, n = 387, spike timing lags during ripples percentiles = 0, 5, 20, 70, 150. (F) SWR coactivation probabilities of place cells with spatially tuned firing in this task in 5XFAD (green) versus WT (black) mice. Only animals with at least 10 SWRs during non-theta periods per recording were included. Each dot indicates the coactivation probability of a place cell pair across all SWR events. 5XFAD, 0.024 ± 0.0049 probability; WT, 0.11 ± 0.025 probability; prob(WT ≥ 5XFAD) > 0.9999 (limit due to resampling 104 times)***; 5XFAD, n = 845 place cell pairs, coactivation probability percentiles = 0, 0, 0, 0.026, 1; WT, n = 1,061 place cell pairs, coactivation probability percentiles = 0, 0, 0, 0.15, 1. (G) As in (F) for SWR activation probabilities of place cells. 5XFAD, 0.14 ± 0.035 probability; WT, 0.32 ± 0.049 probability; prob(WT ≥ 5XFAD) > 0.9999 (limit due to resampling 104 times)***; 5XFAD, n = 125 place cells, activation probability percentiles = 0, 0, 0.091, 0.22, 1; WT, n = 157, activation probability percentiles = 0, 0.081, 0.25, 0.50, 1. See also Figure S7. Black bars indicate median of distribution for violin plots. All percentiles are minimum, 25th percentile, median, 75th percentile, maximum. **prob > 0.995 or prob < 0.005 (α = 0.01); ***prob > 0.9995 or prob < 0.0005 (α = 0.001). n.s., not significant throughout.

Similar articles

Cited by

References

    1. Abramov E, Dolev I, Fogel H, Ciccotosto GD, Ruff E, and Slutsky I (2009). Amyloid-β as a positive endogenous regulator of release probability at hippocampal synapses. Nat. Neurosci. 12, 1567–1576. - PubMed
    1. Alger BE, and Nicoll RA (1982). Feed-forward dendritic inhibition in rat hippocampal pyramidal cells studied in vitro. J. Physiol. 328, 105–123. - PMC - PubMed
    1. Ali F, Baringer SL, Neal A, Choi EY, and Kwan AC (2019). Parvalbumin-positive neuron loss and amyloid-β deposits in the frontal cortex of Alzheimer’s disease-related mice. J. Alzheimers Dis. 72, 1323–1339. - PMC - PubMed
    1. Alonso JM, Usrey WM, and Reid RC (1996). Precisely correlated firing in cells of the lateral geniculate nucleus. Nature 383, 815–819. - PubMed
    1. Amarasingham A, Harrison MT, Hatsopoulos NG, and Geman S (2012). Conditional modeling and the jitter method of spike resampling. J. Neurophysiol. 107, 517–531. - PMC - PubMed

Publication types

MeSH terms

LinkOut - more resources