. 2021 Apr 20;35(3):109002.
doi: 10.1016/j.celrep.2021.109002.

NDUFS3 depletion permits complex I maturation and reveals TMEM126A/OPA7 as an assembly factor binding the ND4-module intermediate

Affiliations

NDUFS3 depletion permits complex I maturation and reveals TMEM126A/OPA7 as an assembly factor binding the ND4-module intermediate

Luigi D'Angelo et al. Cell Rep. .

Abstract

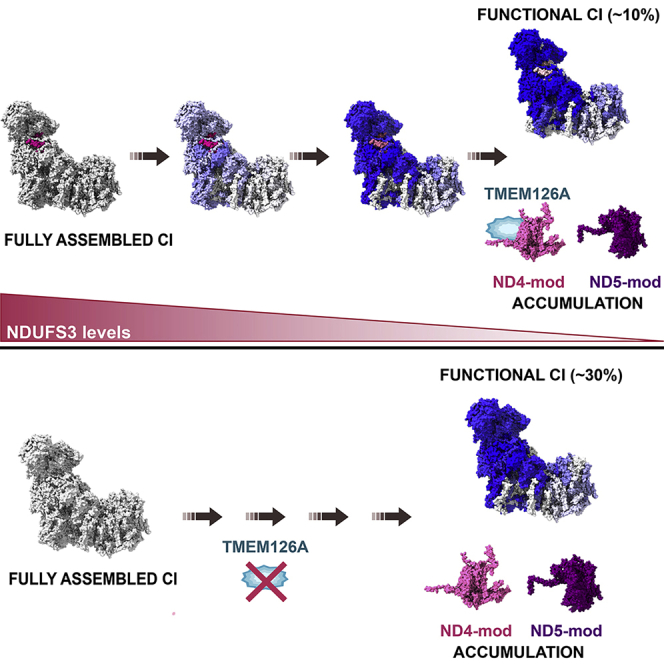
Complex I (CI) is the largest enzyme of the mitochondrial respiratory chain, and its defects are the main cause of mitochondrial disease. To understand the mechanisms regulating the extremely intricate biogenesis of this fundamental bioenergetic machine, we analyze the structural and functional consequences of the ablation of NDUFS3, a non-catalytic core subunit. We show that, in diverse mammalian cell types, a small amount of functional CI can still be detected in the complete absence of NDUFS3. In addition, we determine the dynamics of CI disassembly when the amount of NDUFS3 is gradually decreased. The process of degradation of the complex occurs in a hierarchical and modular fashion in which the ND4 module remains stable and bound to TMEM126A. We, thus, uncover the function of TMEM126A, the product of a disease gene causing recessive optic atrophy as a factor necessary for the correct assembly and function of CI.

Keywords: CI; CI modules; NDUFS3; SILAC; TMEM126A; assembly factor; optic atrophy type 7; respiratory complex I.


Conflict of interest statement

Declaration of interest The authors declare no competing interests.

Figures

None
Graphical abstract
Figure 1
Figure 1
Detectable amounts of fully assembled and functional complex I are present in NDUFS3 KO cells (A) Spectrophotometric measurements of complex I (CI) activity normalized to citrate synthase (CS). Data are means ± SD (n = 9 for 143B−/− and n = 10 for 143B+/+). ∗∗∗∗p < 0.0001 according to Mann-Whitney test. (B) CI in-gel activity (CI-IGA) of 143B+/+, 143B−/−, OS93 (heteroplasmic 97% mutant m.3571insC/MT-ND1), OS (homoplasmic mutant m.3571insC/MT-ND1), and Rho 0 (mtDNA depleted) samples solubilized with n-dodecyl β-D-maltoside (DDM) and separated by high-resolution clear native PAGE (hrCNE). (C) CI-IGA of 143B+/+ and 143B−/− samples solubilized with digitonin and separated by BN-PAGE. SCs include CI+III2 and respirasomes (I+III2+IV1−n). (D) Immunodetection of CI, CIII, and CIV subunits on western blots of total lysates from 143B+/+ and 143B−/− cells lines resolved by SDS-PAGE. β-actin was used as loading control. Superfluous lanes were cropped in the UQCRC2 and relative loading control images. (E) Immunodetection of CI, CIII, and CIV subunits on western blots of mitochondrial fractions from 143B+/+ and 143B−/− cell lines solubilized with digitonin and separated by 2D BN-PAGE. All subunits were immunodetected on the same blot. (F) CI-driven ATP synthesis rates (CI-ATP) for 143B+/+ (n = 6), 143B−/− (n = 6), 143B−/− treated with 50 μg/mL chloramphenicol (CAP) (n = 3), HCT116+/+ (n = 12), HCT116−/− (n = 8), and HCT116−/− treated with 50 μg/mL CAP (n = 4). Rotenone-sensitive ATP synthesis rates (nmol/min × mg) were normalized to CS activity and protein content. Values are means ± SD. ∗∗p = 0.0022, ∗∗∗∗p < 0.0001 according to Mann-Whitney test. ND, not detected. See also Figures S1–S3.
Figure 2
Figure 2
Persistence of functional respiratory CI during repression of NDUFS3 (A) Immunodetection of NDUFS3 on western blots of whole-cell lysates from 143B−/− NDUFS3 cells treated with 100 ng/mL doxycycline (Dox) for 0 (untreated), 1, 2, 4, and 8 days (n = 3). NDUFS3 band intensities were quantified by densitometry and normalized to the signal of Hsp70, used as loading control. The mean values of the treated cells were referred to those of untreated (control) set to 100%. Data are means ± SD. ∗∗∗∗p < 0.0001 treated versus untreated; one-way ANOVA with Sidak’s multiple comparisons test. (B) CI-IGA of enriched mitochondrial fractions from repressed 143B−/−NDUFS3, solubilized either with digitonin or DDM and separated by BN-PAGE. SCs include CI+III2 and respirasomes (I+III2+IV1-n). (C) Immunodetection of CI subunits on western blots of 143B−/−NDUFS3 cells, treated either with 100 ng/mL Dox for 0 (untreated), 1, 2, 4, and 8 days or simultaneously with 100 ng/mL Dox and 50 μg/mL CAP for 8 days, resolved by SDS-PAGE. β-actin was used as loading control. (D) Immunodetection of CI subunits NDUFA12 (N-module), NDUFS2 (Q-module), NDUFS3 (Q-module), NDUFB8 (ND5-module), CIII subunit UQCRFS1, and CIV subunit MT-CO2, in western blots of mitochondrial fractions from 143B−/−NDUFS3, treated either with 100 ng/mL Dox for 0 (untreated), 1, 2, 4, and 8 days or simultaneously with 100 ng/mL Dox and 50 μg/mL CAP for 8 days, solubilized with digitonin and separated by BN-PAGE. SCs include CI+III2 and respirasomes (I+III2+IV1-n). SDHB and SDHA (CII) were used as loading controls. (E) Immunodetection of CI, CIII, and CIV subunits on western blots of mitochondrial fractions from 143B−/−NDUFS3 cells treated with 100 ng/mL Dox for 0 (untreated), 2, 4, and 8 days, solubilized with digitonin and resolved by 2D BN-PAGE. All subunits were immunodetected on the same blot. One asterisk () indicates a non-specific signal derived from an anti-NDUFA8 antibody with which the membrane was previously incubated. Two asterisks (∗∗) indicate a signal derived from anti-MT-CO1. See also Figure S3.
Figure 3
Figure 3
Progressive loss of NDUFS3 reveals the modular dynamics of CI disassembly (A) Scatterplots generated from the liquid chromatography-mass spectrometry (LC-MS) analysis of mitochondrial-enriched fractions corresponding to the duplicate SILAC experiments, comparing untreated 143B−/−NDUFS3 with cells treated with 100 ng/mL Dox for 2, 4, or 8 days. The values of the logarithmic fold change (log2 H/L) for each protein in experiment 1 (exp.1; light untreated, heavy Dox treated) are represented in the x axis. The logarithmic fold-change values (−log2 H/L) derived from experiment 2 (exp.2; heavy untreated, light Dox treated) are represented in the y axis. Each point represents the values for a specific protein. CI subunits and assembly factors are highlighted; CI subunits of the same module are the same color. The group termed “uncertain” includes the subunits with still-unclear domain assignments (Stroud et al., 2016). (B) Heatmap generated from the mean of the duplicate SILAC experiments for the detected CI subunits at each of the Dox treatment points (2, 4, and 8 days). Grey, not detected either in one or both of the duplicates. (C) CI subunit relative protein abundance changes induced by repression of NDUFS3 after 2 and 8 days of 100 ng/mL Dox treatment depicted on the structure of the active mouse CI (PDB: 6G2J) (Agip et al., 2018) using ChimeraX version 1.1 (Goddard et al., 2018). See also Figure S4.
Figure 4
Figure 4
TMEM126A is associated with a stable CI subassembly of the ND4-module (A) Scatterplots generated from the liquid chromatography-mass spectrometry (LC-MS) analysis of CI immunopurified fractions performed on the same mitochondrial-enriched fractions used for the proteomic analyses in Figure 3. The values of the logarithmic fold change (log2 H/L) for each protein in experiment 1 (exp.1; light untreated, heavy Dox treated) are represented on the x axis. The logarithmic fold change values (−log2 H/L) derived from experiment 2 (exp.2; heavy untreated, light Dox treated) are represented on the y axis. Each point represents a specific protein. CI subunits and assembly factors are highlighted; CI subunits of the same module are the same color. “Uncertain” subunits are those with still unclear assignment. TMEM126A is shown in red. Proteins with statistically significant changes are also labeled. (B) Immunodetection of TMEM126A and NDUFS3 on western blots of whole-cell lysates and mitochondrial enriched fractions from 143B−/− NDUFS3 cells treated with 100 ng/mL Dox for 0 (untreated), 1, 2, 4, and 8 days (n = 2). TMEM126A band signal intensities were quantified by densitometry and normalized to the signal of either vinculin for whole-cell lysates, and CS or voltage-dependent anion channel (VDAC) for mitochondrial fractions. The mean values of the treated cells are the percentage of those of the untreated control. Data are means ± SD. (C) Immunodetection of TMEM126A and NDUFB6 (ND4-module) in western blots of enriched-mitochondrial fractions from 143B−/−NDUFS3 cells treated with 100 ng/mL Dox for 0 (untreated), 1, 2, 4, and 8 days, solubilized using digitonin and separated by BN-PAGE. Two asterisks (∗∗) indicate a subassembly containing TMEM126A and co-migrating with NDUFB6 subassembly; one asterisk () indicates a lower-molecular-sized subassembly with positive staining for TMEM126A.The two panels correspond to the same samples separated in the same BN-PAGE gel and transferred onto the same membrane, which was subsequently cut in two for immunodetection. SDHA (CII) was used as loading control in BN-PAGE blots. VDAC was used as loading control in western blots of the same samples separated by SDS-PAGE. (D) Immunodetection of TMEM126A, NDUFB6 (ND4-module), UQCRC2 (CIII), and MT-CO2 (CIV) on western blots of mitochondrial enriched fractions from 143B−/−NDUFS3 cells treated with 100 ng/mL Dox for 0 (untreated) and 8 days, solubilized with 4 mg digitonin/mg protein and resolved by 2D BN-PAGE. All the subunits were immunodetected on the same blot. One asterisk () indicates a signal derived from the anti-TMEM126A antibody with which the membrane was previously incubated.
Figure 5
Figure 5
TMEM126A is required for respiratory CI biogenesis and function (A) Immunodetection of TMEM126A on western blots of total lysates and mitochondrial fractions from HAP1WT and HAP1KO cells. β-actin and CS were used as loading controls. (B) Immunodetection of CI, CIII, and CIV subunits on western blots of whole-cell lysates from HAP1WT and HAP1KO cells lines (n = 3–8) resolved by SDS-PAGE. β-actin or vinculin were used as loading controls. Band signal intensities were quantified by densitometry and normalized to the signal of the relative loading control. Data are means ± SD. p < 0.0001 according to unpaired multiple t test, Holm-Sidak method, with α = 0.05. (C) Spectrophotometric kinetic measurements of CI activity normalized to CS. Data are means ± SD (n = 3). p = 0.0189 according to an unpaired Student’s t test. (D) CI-IGA assay (left panel) and a western blot (right panel) in which NDUFB6 was immunodetected from HAP1WT and HAP1KO mitochondrial-enriched fractions solubilized with digitonin or DDM and separated by BN-PAGE. SDHA (CII) was the loading control. (E) Immunodetection of CI, CIII, and CIV subunits on western blots of mitochondrial-enriched fractions from HAP1WT and HAP1KO cells, solubilized with digitonin and resolved by 2D BN-PAGE. All the subunits were immunodetected on the same blot. One asterisk () indicates a signal derived from an anti-NDUFA9 antibody with which the membrane was previously incubated. (F) Immunodetection of NDUFB11 and NDUFB6 (ND4-module) on western blots of mitochondrial-enriched fractions from HAP1WT and HAP1KO cells, solubilized with digitonin and resolved by 2D BN-PAGE. One asterisk () indicates signals derived from anti-NDUFB11, with which the membrane was previously incubated. (G) Oxygen consumption rate (OCR) profiles of HAP1WT and HAP1KO cells. Additions were 1 μM oligomycin (O), 0.25 μM FCCP (F), and 1 μM rotenone plus antimycin A (R/A) diluted in Seahorse medium, pH 7.4. Data are expressed as pmoles/min of O2 normalized on SRB absorbance and shown as means ± SEM of n = 4 independent replicates, p < 0.01 according to unpaired multiple t test Holm-Sidak method, with α = 0.05. (H) HAP1WT and HAP1KO cell viability determined by sulforhodamine B (SRB) assay after 72 h of incubation with either 25 mM glucose or glucose-free medium containing 5 mM galactose. Data are means ± SD of n = 4 independent replicates, p = 0.0197 and ∗∗∗p < 0.0001 according to unpaired Student’s t test. See also Figure S5.

Similar articles

Cited by

References

    1. Acin-Perez R., Enriquez J.A. The function of the respiratory supercomplexes: the plasticity model. Biochim. Biophys. Acta. 2014;1837:444–450. - PubMed
    1. Acín-Pérez R., Bayona-Bafaluy M.P., Fernández-Silva P., Moreno-Loshuertos R., Pérez-Martos A., Bruno C., Moraes C.T., Enríquez J.A. Respiratory complex III is required to maintain complex I in mammalian mitochondria. Mol. Cell. 2004;13:805–815. - PMC - PubMed
    1. Acín-Pérez R., Fernández-Silva P., Peleato M.L., Pérez-Martos A., Enriquez J.A. Respiratory active mitochondrial supercomplexes. Mol. Cell. 2008;32:529–539. - PubMed
    1. Agip A.A., Blaza J.N., Bridges H.R., Viscomi C., Rawson S., Muench S.P., Hirst J. Cryo-EM structures of complex I from mouse heart mitochondria in two biochemically defined states. Nat. Struct. Mol. Biol. 2018;25:548–556. - PMC - PubMed
    1. Andrews B., Carroll J., Ding S., Fearnley I.M., Walker J.E. Assembly factors for the membrane arm of human complex I. Proc. Natl. Acad. Sci. USA. 2013;110:18934–18939. - PMC - PubMed

Publication types

MeSH terms

LinkOut - more resources