Multicenter Study
. 2021 Aug 1:236:118082.
doi: 10.1016/j.neuroimage.2021.118082. Epub 2021 Apr 18.

Minimal specifications for non-human primate MRI: Challenges in standardizing and harmonizing data collection

Affiliations
Multicenter Study

Minimal specifications for non-human primate MRI: Challenges in standardizing and harmonizing data collection

Joonas A Autio et al. Neuroimage. .

Abstract

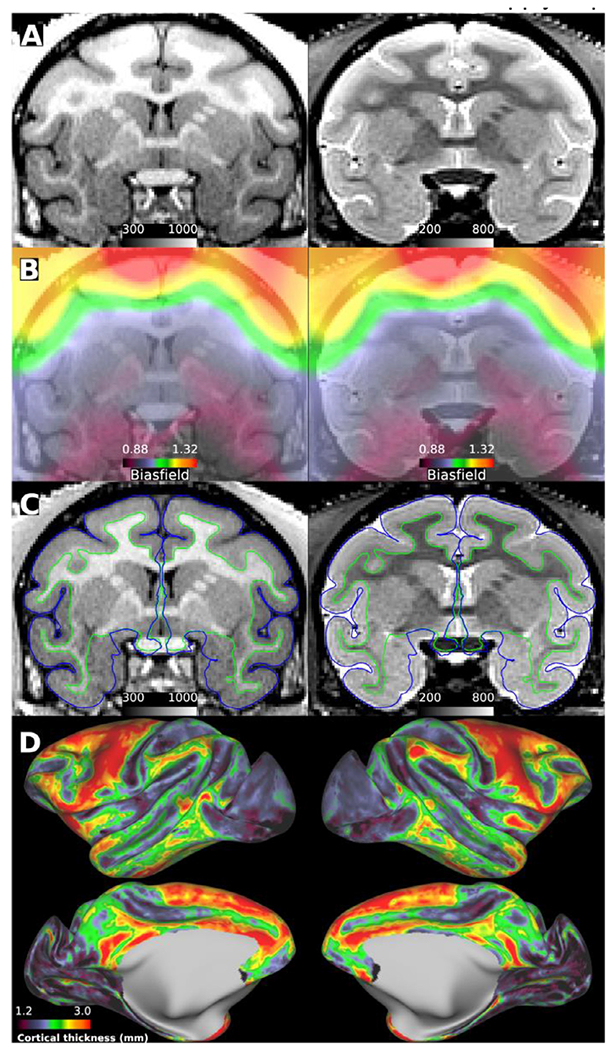
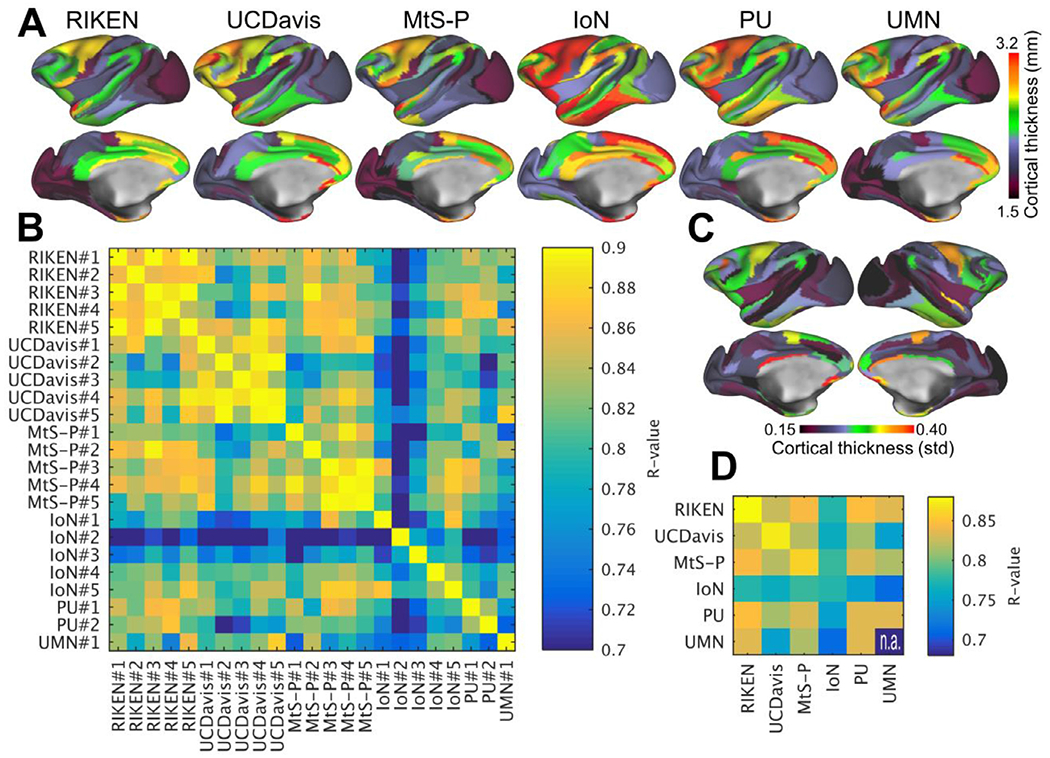
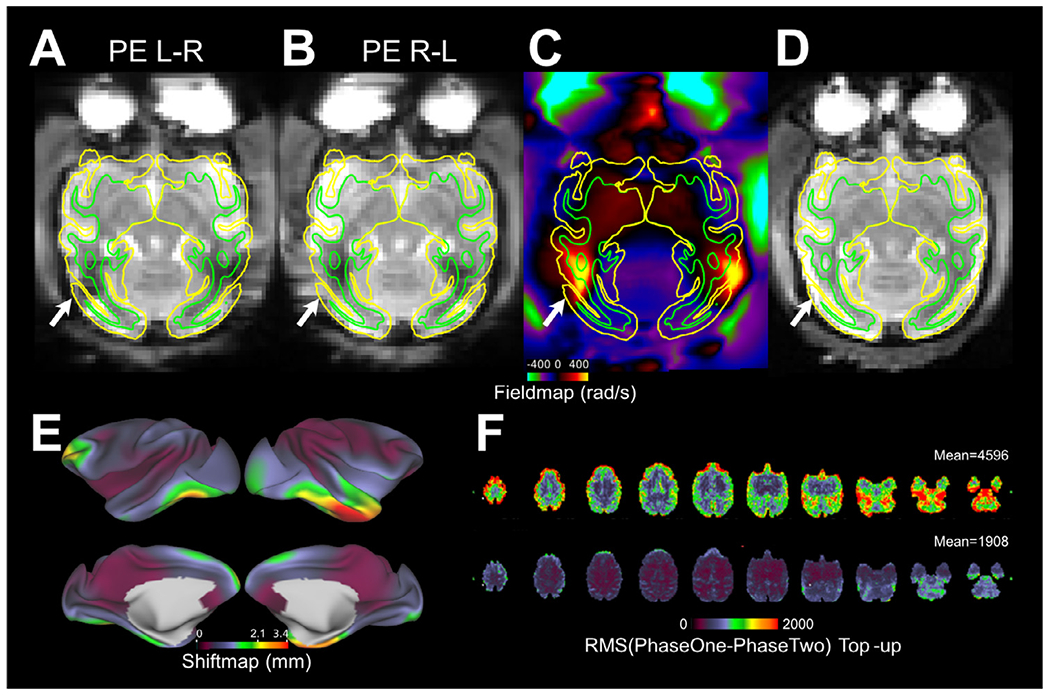
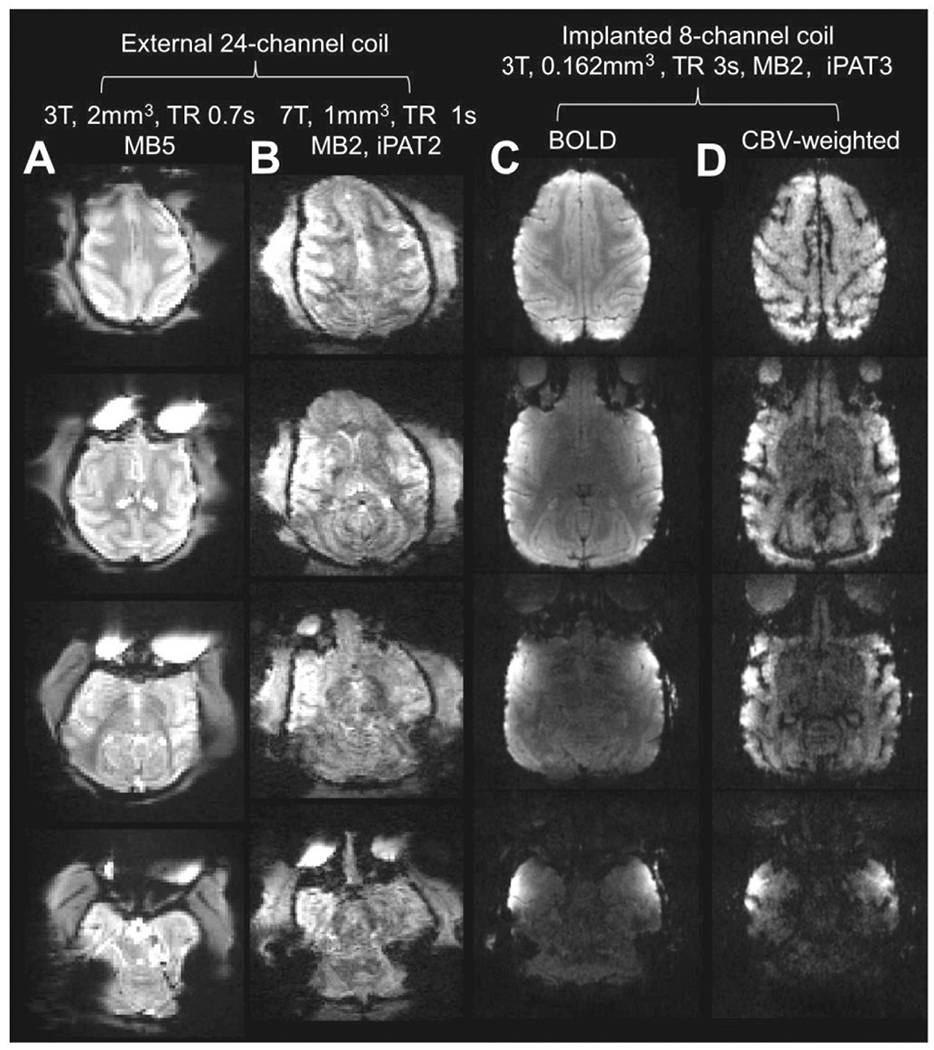
Recent methodological advances in MRI have enabled substantial growth in neuroimaging studies of non-human primates (NHPs), while open data-sharing through the PRIME-DE initiative has increased the availability of NHP MRI data and the need for robust multi-subject multi-center analyses. Streamlined acquisition and analysis protocols would accelerate and improve these efforts. However, consensus on minimal standards for data acquisition protocols and analysis pipelines for NHP imaging remains to be established, particularly for multi-center studies. Here, we draw parallels between NHP and human neuroimaging and provide minimal guidelines for harmonizing and standardizing data acquisition. We advocate robust translation of widely used open-access toolkits that are well established for analyzing human data. We also encourage the use of validated, automated pre-processing tools for analyzing NHP data sets. These guidelines aim to refine methodological and analytical strategies for small and large-scale NHP neuroimaging data. This will improve reproducibility of results, and accelerate the convergence between NHP and human neuroimaging strategies which will ultimately benefit fundamental and translational brain science.

Keywords: MRI; Multi-site; Non-human primate; PRIME-DE; Standardization.


Figures

Fig. 1.
Fig. 1.. Structural image quality standards and B1− biasfield correction.
(A) Prescan normalized T1w MPRAGE (left) and T2w SPACE (right) images acquired with 0.5 mm isotropic resolution. Note the signal intensity bias near the superior surface of the brain despite prescan normalization and the decreased tissue contrast for myelin in the temporal lobes relative to the superior frontal lobes. (B) Intensity biasfield, due to uncorrected B1− and shared B1 +, estimated using within-brain smoothed and normalized sqrt(T1w*T2w) images (Glasser and Van Essen, 2011). (C) Biasfield corrected (divided) T1w and T2w images. The pial and white matter surfaces are indicated by blue and green contours, respectively. (D) Cortical thickness displayed over inflated cortical midthickness surface. Macaque data was acquired using the Human Connectome Project (HCP)—style data acquisition (https://brainminds-beyond.riken.jp/hcp-nhp-protocol), preprocessed using non-human primate version of the HCP pipelines (https://github.com/Washington-University/NHPPipelines) and visualized using HCP’s Connectome Workbench (Autio et al., 2020; Donahue et al., 2018; Glasser et al., 2013a). Data available at https://balsa.wustl.edu/study/show/kNj6K.
Fig. 2.
Fig. 2.. Comparison of cortical thickness across exemplar subjects in the PRIME-DE.
(A) Top row shows exemplar parcellated curvature corrected cortical thickness maps from six PRIME-DE sites. (B) Comparison between cortical thickness maps across sites and subjects (N=23). (C) Variability of cortical thickness (N = 23). (D) Average correlation across and within imaging centers. Cortical thickness maps were automatically generated using HCP-NHP pipelines (Autio et al., 2020; Donahue et al., 2018), parcellated using M132 atlas containing 91 parcels per hemisphere (Markov et al., 2014) and then Pearson’s correlation coefficient between parcellated cortical thickness maps was calculated. Image resolution was 0.5 mm isotropic in all centers expect in UC-Davis resolution was 0.6 mm which was then reconstructed (zero padded) to 0.3 mm isotropic. Abbreviations RIKEN Institute of Physical and Chemical Research, Japan, UC-Davis University of California, Davis; MtS-p Mount Sinai-Philips; IoN Institute of Neuroscience; PU Princeton University; UMN University of Minnesota.
Fig. 3.
Fig. 3.. Distortion correction is an important quality assurance standard to ensure spatial fidelity of functional and diffusion echo-planar images.
Functional single-band echo-planar images acquired with phase encoding (PE) directions (A) from left to right (L-R) and (B) from right to left (R-L). Note distortion, in particular near the temporal and occipital lobes (white arrows). (C) B0 field-map, created using spin-echo (SE) echo-planar images. (D) Distortion corrected SE echo-planar reference image using FSL’s TopUp (Andersson et al., 2003). Pial and white matter surfaces are indicated by the yellow and green contours, respectively. (E) Absolute shiftmap demonstrates the physical voxel dislocation (mm) due to magnetic field inhomogeneities. Shiftmap was calculated using FSL’s utility FUGUE. (F) Root-mean-square (RMS) deviation of signal intensity between R-L and L-R PE echo-planar images before (top panel, mean 4596 (a.u.)) and after (bottom panel, mean 1908 (a.u.)) TopUp configuration for the size of the NHP brain (N=30). The remaining RMS after the TopUp correction includes noise, inaccuracy of distortion correction and their cross-subject variability (related to the variability in structural standardization). Data was registered to the Yerkes19_v1.2 space using linear and non-linear registrations (Autio et al., 2020; Hayashi et al., 2021; Jenkinson et al., 2002). For TopUp configuration see https://github.com/Washington-University/NHPPipelines/blob/master/global/config/b02b0_macaque.cnf
Fig. 4.
Fig. 4.. Comparison of echo-planar image quality across different hardware configurations.
Single blood oxygen level dependent (BOLD) echo-planar images acquired on anesthetized macaque monkeys using a 24-channel coil (A) at 3T (Autio et al., 2020) and (B) at 7T (Gilbert et al., 2016). Echo-planar image quality may be further improved using implanted phased-array coils at 3T with (C) BOLD or (D) cerebral blood volume weighted (CBVw) fMRI (Janssens et al., 2012). Note that implanted RF coils enable an order of magnitude smaller voxel size in comparison to conventional multi-channel coil designs while maintaining a good signal-to-noise ratio at majority of the cortical surface. Although echo-planar image quality is an important requirement, we emphasize that it is only one factor (among others such as anesthesia, physiology, training and contrast-to-noise ratio), involved in achieving high sensitivity to neuronal activity.
Fig. 5.
Fig. 5.. Longer resting-state fMRI scan duration improves the quality of functional connectivity metrics.
Functional connectivity (Z-transformed Pearson’s correlation coefficient) between a seed point (single grayordinate seed) in the default mode network area and the rest of the cortical mantle. In the macaque two sessions each 51 minutes are acquired whereas in the Young Adult Human Connectome Project (YA-HCP) four sessions were acquired with each 15 min length. Both macaque and human BOLD fMRI data were acquired with repetition time ≈0.7 sec (Autio et al., 2020; Smith et al., 2013) and data was preprocessed using HCP and non-human primate (NHP)-HCP pipelines (Autio et al., 2020; Donahue et al., 2018; Glasser et al., 2013b), including FreeSurfer (Fischl, 2012) and ICA-FIX processing (Griffanti et al., 2017; Griffanti et al., 2014; Salimi-Khorshidi et al., 2014). Data at https://balsa.wustl.edu/study/show/kNj6K.
Fig. 6.
Fig. 6.. Distribution of seed-based resting-state functional connectivity (FC; Z-transformed correlation coefficient) in cerebral cortex.
(A) The young-adult human connectome project (YA-HCP) (Smith et al., 2013) (Subject ID: 100307). (B) HCP-style macaque imaging (Autio et al., 2020). (C) Representative PRIME DE-sites (Milham et al., 2018). Data was distortion corrected, detrended, motion corrected and FIX-cleaned using HCP-NHP pipelines (Autio et al., 2020; Glasser et al., 2013a). Violin plots contain approximately 60 × 103 nodes and 1.8 × 10⁹ edges in YA-HCP whereas they contain approximately 18 × 103 nodes and 160 × 106 edges in macaque monkeys. Local FC (2% geodesic distance) is not shown. Scan length and number of volumes acquired were 13 min and 500 at University of California, Davis (UC-Davis), 27 min and 1,600 at University of Minnesota (UMN), 42 min and 8,192 at Mount Sinai School of Medicine (Philips) (MtS-P) and 60 min and 1,824 at Princeton University (PU), respectively.
Fig. 7.
Fig. 7.. Quality assurance analysis of functional timeseries and functional connectivity.
(A) Typical MRI artefact in an anesthetized macaque monkey identified using spatially independent component analysis (sICA). Note that this artefact exhibits (A1) temporal oscillations (A2) at ventilation frequency. (B) The number of identified sICAs (including both noise and neural networks) increases with respect to the scan duration. (C, D) Comparison of functional connectivity between a seed point in area 2 (green arrow) and the rest of the cortical mantle (C) before and (D) after FIX-ICA clean-up. Note that before fMRI preprocessing there are large spatially specific signal fluctuations and FC do not appear neurobiologically meaningful whereas after the clean-up these fluctuations are reduced and strong functional connectivity is dominated by neurobiologically sensible connections. Grayplot of (E) uncleaned (but distortion corrected) and (F) FIX-ICA cleaned (including motion correction, detrending and FIX clean-up) (Power, 2016; Power et al., 2014). The grayplots are scaled according to % parcel mean signal (±2%) balanced according to parcel size (Markov et al., 2014) and for visualization purposes are ordered by hierarchical clustering (Ward’s method) (Glasser et al., 2018). Note the reduction of spatially specific fluctuations (horizontal bands) after FIX-cleanup.
Fig. 8.
Fig. 8.. Reproducibility of resting-state functional connectivity (FC) within and across PRIME-DE macaque imaging sites.
(A) Exemplar FC correlation matrices from six PRIME-DE sites, ordered according to hierarchical clustering (Ward’s method). (B) Comparison between correlation matrices across sites (six) and subjects (total N=23). fMRI timeseries were preprocessed using HCP-NHP pipelines, parcellated using M132 atlas containing 91 parcels per hemisphere (Markov et al., 2014), and then Spearman’s Rank correlation coefficient (rho) between parcellated timeseries was calculated. Comparison of FC was limited to PRIME-DE sites that fulfilled minimum acquisition criteria (high-resolution anatomical image and a B0 field-map). (C) Test-retest (heat) scatter plot of Z-scored FC matrixes (N=1, n=2, RIKEN data). (D) Reproducibility was high (>0.8; rho) in majority of the cortex (>78%), however, areas distant to RF receive channel coils and weaker SNR (i.e. hippocampal complex and ventral visual stream) exhibited lower reproducibility (RIKEN data was acquired using HCP-style protocols). Abbreviations: HCP the human connectome project; UC-Davis University of California, Davis; MtS Mount Sinai-Philips; IoN Institute of Neuroscience; PU Princeton University; UMN University of Minnesota, RH right hemisphere; LH left hemisphere.
Fig. 9.
Fig. 9.
Comparison of blood oxygen level dependent (BOLD; top row) and cerebral blood volume weighted (CBVw, MION; bottom row) fMRI activation maps of viewing scenes versus objects obtained from the same subject with an implanted phased-array coil on consecutive scan days. The same number of runs from a single imaging session with equal fixation performance (> 90% within a 2 × 2° window) were used for the analysis. Note that CBVw exhibits much higher sensitivity than BOLD (t > 2). BOLD signals are typically highest at the pial surface (draining veins) whereas the CBVw activation maps reveal differential responses in upper versus lower layers (see yellow arrows in lower right enlarged panel). Data was acquired using standard gradient-echo EPI sequence at 3T Siemens Prisma scanner (0.162 mm3 voxels, TR 3 s, MB 2, GRAPPA 3 and volumes 220).
Fig. 10.
Fig. 10.. Comparison of dMRI quality measures between imaging centers.
(A) Whole brain signal-to-noise ratio (SNR). (B) Third crossing fiber ratio in white matter (threshold at volume fraction 0.05). Primary imaging parameters were: RIKEN (N=20), MtS-P (N=4), UC-Davis (N=8) and YA-HCP (N=20): voxel size 0.7, 1.0, 0.7 and 2 mm3; number of directions (512, 60, 121 and 256) and b-values (0, 1000, 2000 and 3000; 0 and 1000; 0 and 1600; 0, 1000, 2000 and 3000 s/mm2), respectively. RIKEN data was obtained using HCP-style image acquisition protocols. Abbreviations: UC-Davis University of California, Davis; MtS-P Mount Sinai-Philips; YA-HCP the Young Adult Human Connectome Project.
Fig. 11.
Fig. 11.. Comparison between heterogeneous non-human primate (NHP) protocols and human harmonized protocol (HARP) MRI similarity measures.
Parcellated cortical thickness similarity measures were comparable across species (A) within-subject and within scanner (at RIKEN, N=5) and (B) between-subject and between-scanners (macaque N=23, 6-scanners; human N=30, 13-scanners). (C) Parcellated functional connectivity (FC) exhibited comparable test-retest reproducibility between anesthetized NHPs in RIKEN and (awake) humans. However, (D) FC exhibited poor reproducibility across NHP imaging centers in comparison to humans. HARP is a travelling subject (N=30) study across 13-clinical MRI centers (Koike et al., 2020). Macaque and human data were processed using HCP-NHP and HCP pipelines, respectively. NHP MRI data was parcellated using M132 91-areas per hemisphere atlas (Markov et al., 2014) whereas human MRI data was parcellated using HCP’s 180-areas per hemisphere atlas (Glasser et al., 2016a). The Spearman’s rank correlation coefficients (rho) are shown in mean (std).

References

    1. Ahmad F, Treanor L, McGrath TA, Walker D, McInnes MDF, Schieda N, 2021. Safety of off-label use of ferumoxtyol as a contrast agent for MRI: a systematic review and meta-analysis of adverse events. J. Magn. Reson. Imaging 53, 840–858. doi: 10.1002/jmri.27405. - DOI - PubMed
    1. Andersson JL, Hutton C, Ashburner J, Turner R, Friston K, 2001. Modeling geometric deformations in EPI time series. NeuroImage 13, 903–919. doi: 10.1006/nimg.2001.0746. - DOI - PubMed
    1. Andersson JLR, Graham MS, Drobnjak I, Zhang H, Campbell J, 2018. Susceptibility-induced distortion that varies due to motion: Correction in diffusion MR without acquiring additional data. NeuroImage 171, 277–295. doi: 10.1016/j.neuroimage.2017.12.040. - DOI - PMC - PubMed
    1. Andersson JLR, Skare S, Ashburner J, 2003. How to correct susceptibility distortions in spin-echo echo-planar i mages: application to diffusion tensor imaging. NeuroImage 20, 870–888. doi: 10.1016/S1053-8119(03)00336-7. - DOI - PubMed
    1. Autio JA, Glasser MF, Ose T, Donahue CJ, Bastiani M, Ohno M, Kawabata Y, Urushibata Y, Murata K, Nishigori K, Yamaguchi M, Hori Y, Yoshida A, Go Y, Coalson TS, Jbabdi S, Sotiropoulos SN, Kennedy H, Smith S, Van Essen DC, Hayashi T, 2020. Towards HCP-Style macaque connectomes: 24-Channel 3T multi-array coil, MRI sequences and preprocessing. NeuroImage 215, 116800. doi: 10.1016/j.neuroimage.2020.116800. - DOI - PMC - PubMed

Publication types

MeSH terms