

Managing Pandemics with Health Informatics: Successes and Challenges
- PMID: 33882594
- PMCID: PMC8416223
- DOI: 10.1055/s-0041-1726478
Managing Pandemics with Health Informatics: Successes and Challenges
Abstract
Introduction: The novel COVID-19 pandemic struck the world unprepared. This keynote outlines challenges and successes using data to inform providers, government officials, hospitals, and patients in a pandemic.
Methods: The authors outline the data required to manage a novel pandemic including their potential uses by governments, public health organizations, and individuals.
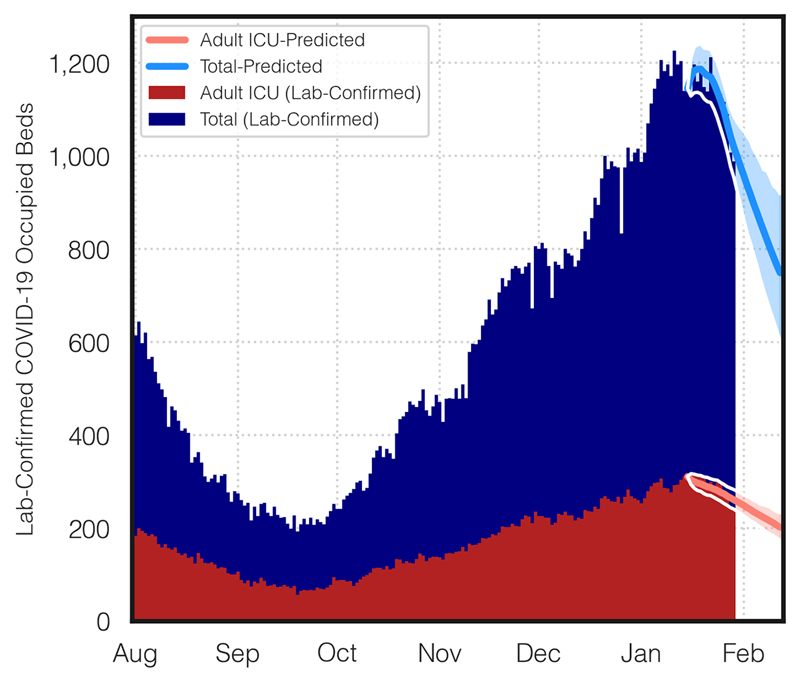
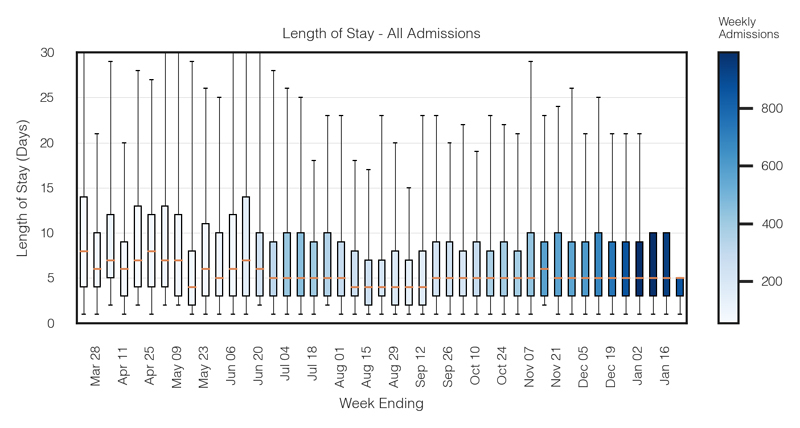
Results: An extensive discussion on data quality and on obstacles to collecting data is followed by examples of successes in clinical care, contact tracing, and forecasting. Generic local forecast model development is reviewed followed by ethical consideration around pandemic data. We leave the reader with thoughts on the next inevitable outbreak and lessons learned from the COVID-19 pandemic.
Conclusion: COVID-19 must be a lesson for the future to direct us to better planning and preparing to manage the next pandemic with health informatics.
IMIA and Thieme. This is an open access article published by Thieme under the terms of the Creative Commons Attribution-NonDerivative-NonCommercial License, permitting copying and reproduction so long as the original work is given appropriate credit. Contents may not be used for commercial purposes, or adapted, remixed, transformed or built upon. (https://creativecommons.org/licenses/by-nc-nd/4.0/).
Conflict of interest statement
Disclosure The authors report no conflicts of interest in this work.
Figures
References
-
- Center for Systems Science and Engineering (CSSE) at Johns Hopkins University (JHU) COVID-19 Dashboard [cited 2020 Nov 25]Available from:https://gisanddata.maps.arcgis.com/apps/opsdashboard/index.html#/bda7594...
-
- BBC Covid-19 vaccine: First person receives Pfizer jab in UK [cited 2020 Dec 9]Available from:https://www.bbc.com/news/uk-55227325
-
- Chang S, Pierson E, Koh P W, Gerardin J, Redbird B, Grusky D.Mobility network models of COVID-19 explain inequities and inform reopening Nature 202158982–7.[cited 2020 Dec 1]. Available from:https://doi.org/10.1038/s41586-020-2923-3 - PubMed
Publication types
MeSH terms
Grants and funding
LinkOut - more resources
Full Text Sources
Other Literature Sources
Medical