

Genetic and non-genetic factors affecting the expression of COVID-19-relevant genes in the large airway epithelium
- PMID: 33883027
- PMCID: PMC8059115
- DOI: 10.1186/s13073-021-00866-2
Genetic and non-genetic factors affecting the expression of COVID-19-relevant genes in the large airway epithelium
Abstract
Background: The large airway epithelial barrier provides one of the first lines of defense against respiratory viruses, including SARS-CoV-2 that causes COVID-19. Substantial inter-individual variability in individual disease courses is hypothesized to be partially mediated by the differential regulation of the genes that interact with the SARS-CoV-2 virus or are involved in the subsequent host response. Here, we comprehensively investigated non-genetic and genetic factors influencing COVID-19-relevant bronchial epithelial gene expression.
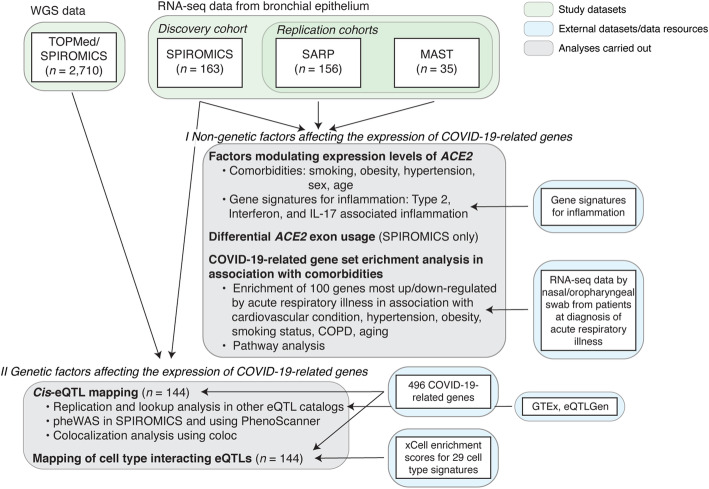
Methods: We analyzed RNA-sequencing data from bronchial epithelial brushings obtained from uninfected individuals. We related ACE2 gene expression to host and environmental factors in the SPIROMICS cohort of smokers with and without chronic obstructive pulmonary disease (COPD) and replicated these associations in two asthma cohorts, SARP and MAST. To identify airway biology beyond ACE2 binding that may contribute to increased susceptibility, we used gene set enrichment analyses to determine if gene expression changes indicative of a suppressed airway immune response observed early in SARS-CoV-2 infection are also observed in association with host factors. To identify host genetic variants affecting COVID-19 susceptibility in SPIROMICS, we performed expression quantitative trait (eQTL) mapping and investigated the phenotypic associations of the eQTL variants.
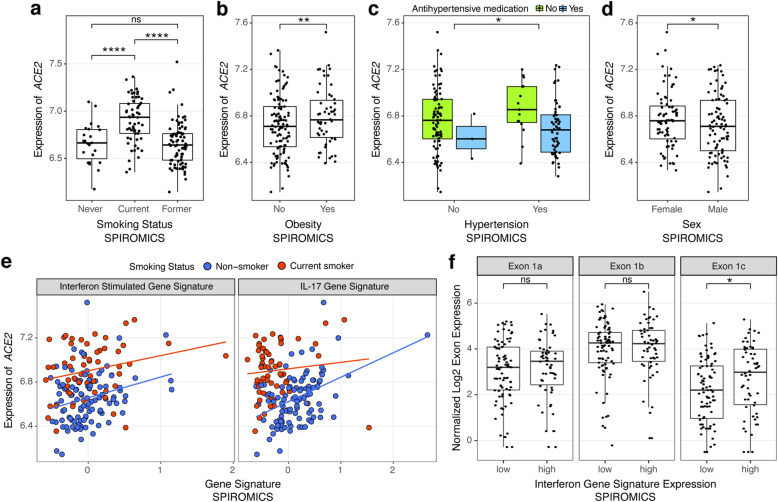
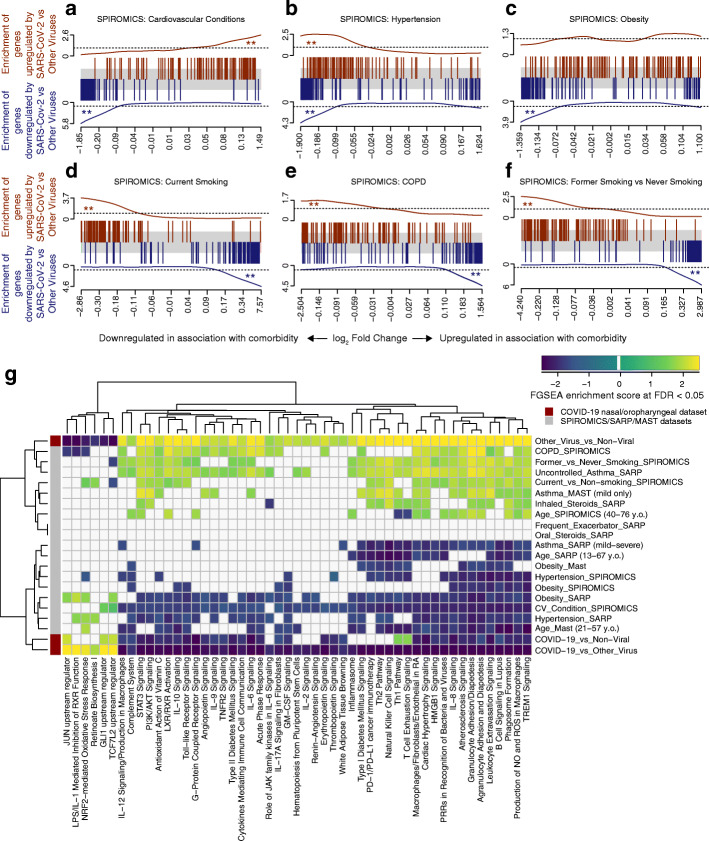
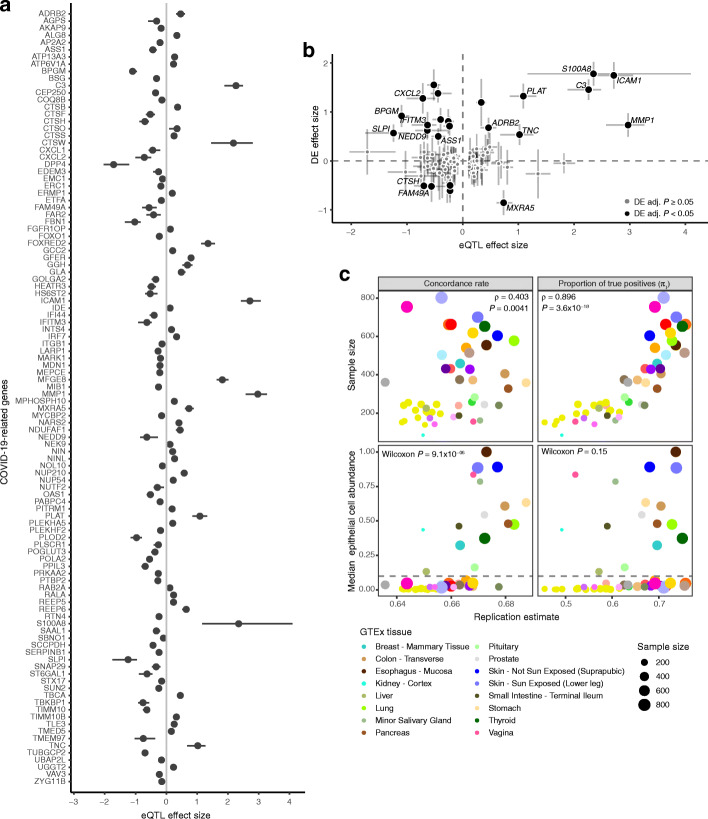
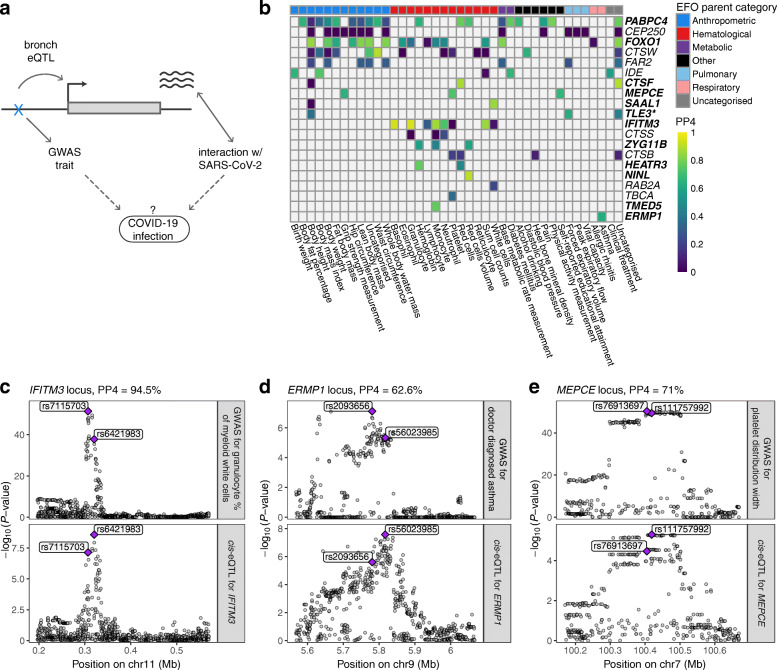
Results: We found that ACE2 expression was higher in relation to active smoking, obesity, and hypertension that are known risk factors of COVID-19 severity, while an association with interferon-related inflammation was driven by the truncated, non-binding ACE2 isoform. We discovered that expression patterns of a suppressed airway immune response to early SARS-CoV-2 infection, compared to other viruses, are similar to patterns associated with obesity, hypertension, and cardiovascular disease, which may thus contribute to a COVID-19-susceptible airway environment. eQTL mapping identified regulatory variants for genes implicated in COVID-19, some of which had pheWAS evidence for their potential role in respiratory infections.
Conclusions: These data provide evidence that clinically relevant variation in the expression of COVID-19-related genes is associated with host factors, environmental exposures, and likely host genetic variation.
Keywords: ACE2; Bronchial epithelium; COVID-19; SARS-CoV-2; eQTL.
Conflict of interest statement
S.A.C. advises for AstraZeneca, GlaxoSmithKline, Glenmark Pharmaceuticals, and Amgen, gave invited lectures to Sonovion and Genentech, and writes for UpToDate. T.L. advises and has equity in Variant Bio and is a member of the scientific advisory board of Goldfinch Bio. V.E.O. has served and currently serves on Independent Data and Monitoring Committee for Regeneron and Sanofi for COVID-19 therapeutic clinical trials unrelated to the current manuscript. The remaining authors declare that they have no competing interests.
Figures
References
-
- Goyal P, Choi JJ, Pinheiro LC, Schenck EJ, Chen R, Jabri A, Satlin MJ, Campion TR, Jr, Nahid M, Ringel JB, Hoffman KL, Alshak MN, Li HA, Wehmeyer GT, Rajan M, Reshetnyak E, Hupert N, Horn EM, Martinez FJ, Gulick RM, Safford MM. Clinical characteristics of COVID-19 in New York City. N Engl J Med. 2020;382(24):2372–2374. doi: 10.1056/NEJMc2010419. - DOI - PMC - PubMed
-
- Gupta S, Hayek SS, Wang W, Chan L, Mathews KS, Melamed ML, Brenner SK, Leonberg-Yoo A, Schenck EJ, Radbel J, Reiser J, Bansal A, Srivastava A, Zhou Y, Sutherland A, Green A, Shehata AM, Goyal N, Vijayan A, Velez JCQ, Shaefi S, Parikh CR, Arunthamakun J, Athavale AM, Friedman AN, Short SAP, Kibbelaar ZA, Abu Omar S, Admon AJ, Donnelly JP, Gershengorn HB, Hernán MA, Semler MW, Leaf DE, STOP-COVID Investigators Factors associated with death in critically ill patients with coronavirus disease 2019 in the US. JAMA Intern Med. 2020;180(11):1436. doi: 10.1001/jamainternmed.2020.3596. - DOI - PMC - PubMed
-
- Shelton JF, Shastri AJ, Ye C, Weldon CH, Filshtein-Somnez T, Coker D, et al. Trans-ethnic analysis reveals genetic and non-genetic associations with COVID-19 susceptibility and severity. Preprint at medRxiv 10.1101/2020.09.04.20188318. 2020.
Publication types
MeSH terms
Substances
Grants and funding
- R01HL142992/HL/NHLBI NIH HHS/United States
- HHSN268200900019C/HL/NHLBI NIH HHS/United States
- K01 AG059898/AG/NIA NIH HHS/United States
- P30 ES005605/ES/NIEHS NIH HHS/United States
- P01 HL107202/HL/NHLBI NIH HHS/United States
- R01 MH106842/MH/NIMH NIH HHS/United States
- R01HL121774/HL/NHLBI NIH HHS/United States
- HHSN268200900015C/HL/NHLBI NIH HHS/United States
- HHSN268200900016C/HL/NHLBI NIH HHS/United States
- HHSN268201800001C/HL/NHLBI NIH HHS/United States
- U01 HL137880/HL/NHLBI NIH HHS/United States
- U01HL137880/HL/NHLBI NIH HHS/United States
- HHSN268200900018C/HL/NHLBI NIH HHS/United States
- HHSN268200900013C/HL/NHLBI NIH HHS/United States
- K23 HL138461/HL/NHLBI NIH HHS/United States
- HHSN268200900014C/HL/NHLBI NIH HHS/United States
- U24 HL141762/HL/NHLBI NIH HHS/United States
- P30 ES010126/ES/NIEHS NIH HHS/United States
- R01MH106842/MH/NIMH NIH HHS/United States
- T32 HL144442/HL/NHLBI NIH HHS/United States
- K23HL123778/HL/NHLBI NIH HHS/United States
- R01HL142028/HL/NHLBI NIH HHS/United States
- R01 HL120393/HL/NHLBI NIH HHS/United States
- R01GM124486/GM/NIGMS NIH HHS/United States
- R01HL137880/HL/NHLBI NIH HHS/United States
- U01 HL120393/HL/NHLBI NIH HHS/United States
- R01GM122924/GM/NIGMS NIH HHS/United States
- R01 HL121774/HL/NHLBI NIH HHS/United States
- UM1 HG008901/HG/NHGRI NIH HHS/United States
- K23 HL123778/HL/NHLBI NIH HHS/United States
- R01 GM124486/GM/NIGMS NIH HHS/United States
- K24 HL137013/HL/NHLBI NIH HHS/United States
- T32HL144442/HL/NHLBI NIH HHS/United States
- K08 HL141601/HL/NHLBI NIH HHS/United States
- UM1HG008901/HG/NHGRI NIH HHS/United States
- U19 AI077439/AI/NIAID NIH HHS/United States
- R01 HL142028/HL/NHLBI NIH HHS/United States
- F30HG011194/HG/NHGRI NIH HHS/United States
- R01 HL142992/HL/NHLBI NIH HHS/United States
- F30 HG011194/HG/NHGRI NIH HHS/United States
- HHSN268200900017C/HL/NHLBI NIH HHS/United States
- HHSN268200900020C/HL/NHLBI NIH HHS/United States
- R01 GM122924/GM/NIGMS NIH HHS/United States
- R01 HL117626/HL/NHLBI NIH HHS/United States
- R01 AI129958/AI/NIAID NIH HHS/United States
LinkOut - more resources
Full Text Sources
Other Literature Sources
Medical
Molecular Biology Databases
Miscellaneous
