. 2021 Sep;11(9):2282-2299.
doi: 10.1158/2159-8290.CD-20-1213. Epub 2021 Apr 21.

Selective Modulation of a Pan-Essential Protein as a Therapeutic Strategy in Cancer

Affiliations

Selective Modulation of a Pan-Essential Protein as a Therapeutic Strategy in Cancer

Clare F Malone et al. Cancer Discov. 2021 Sep.

Abstract

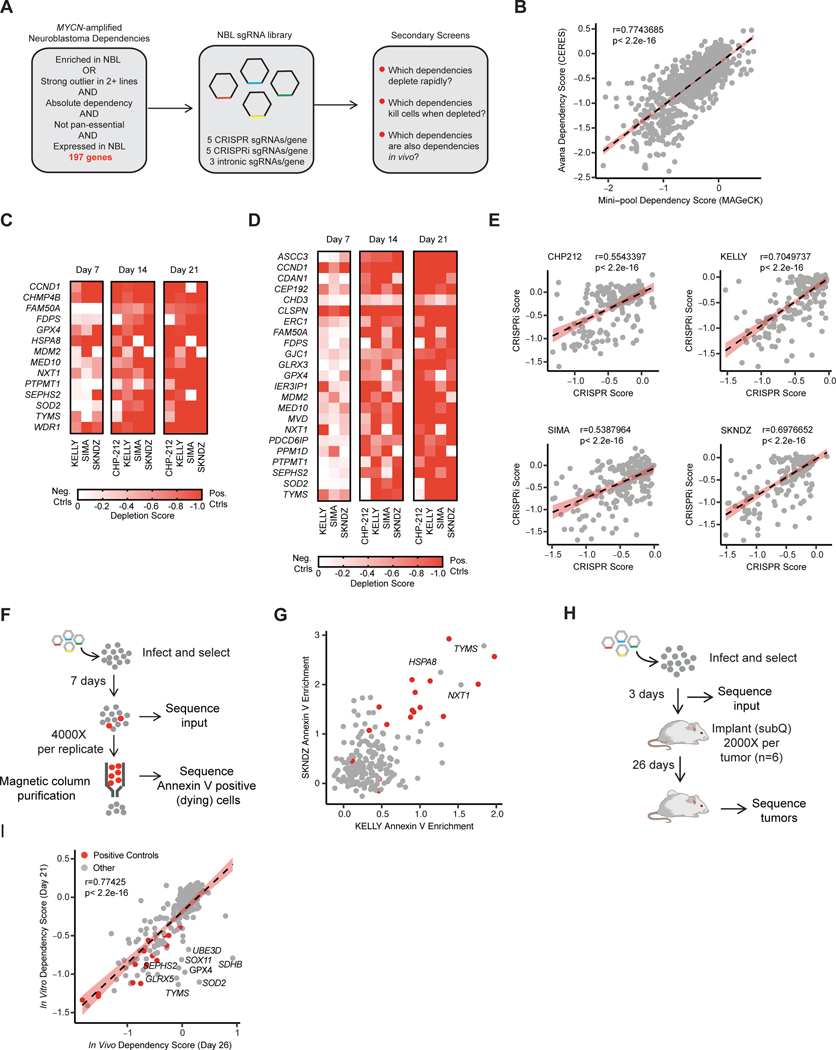
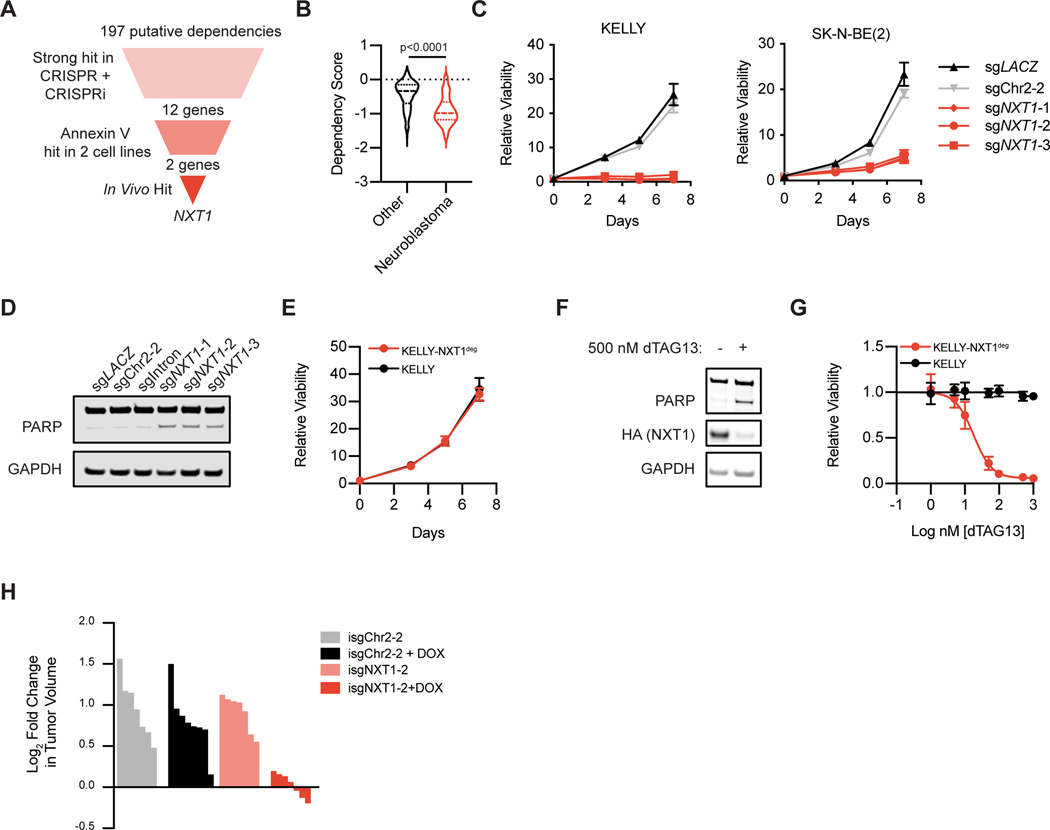
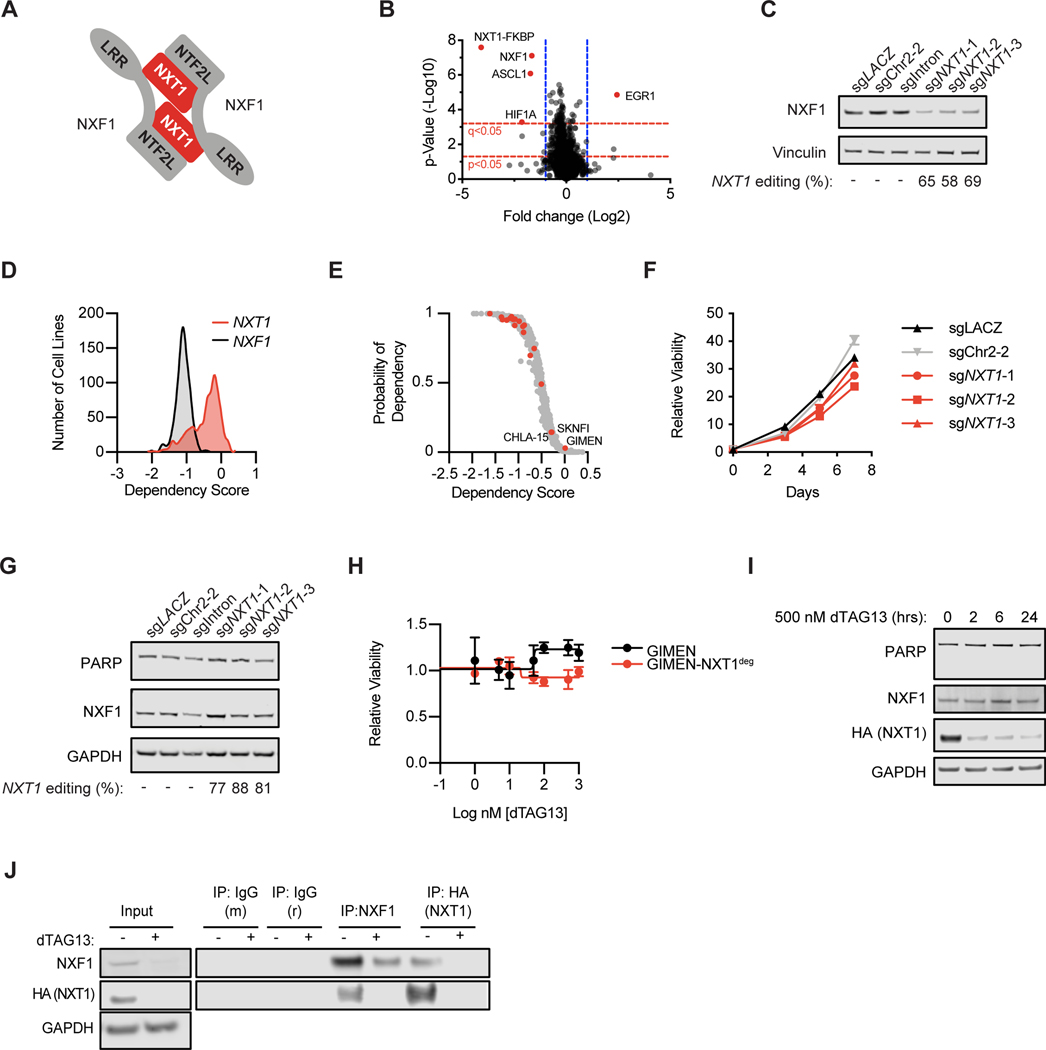
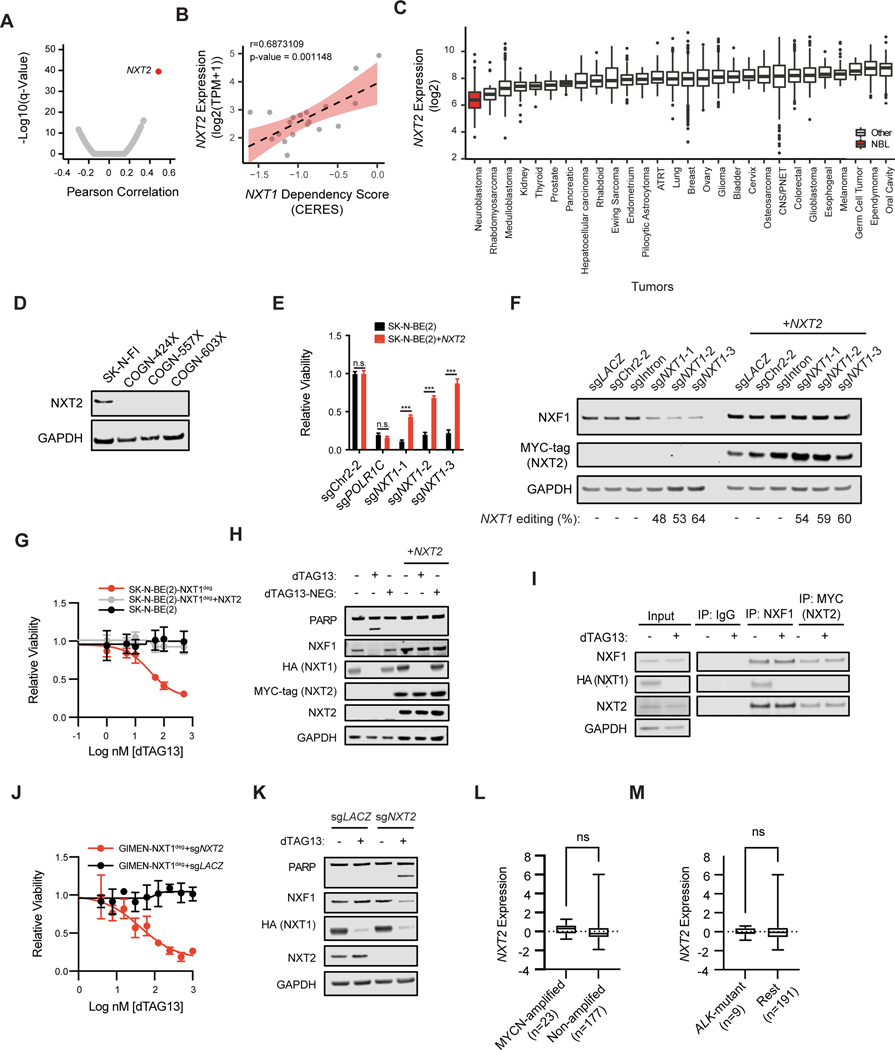
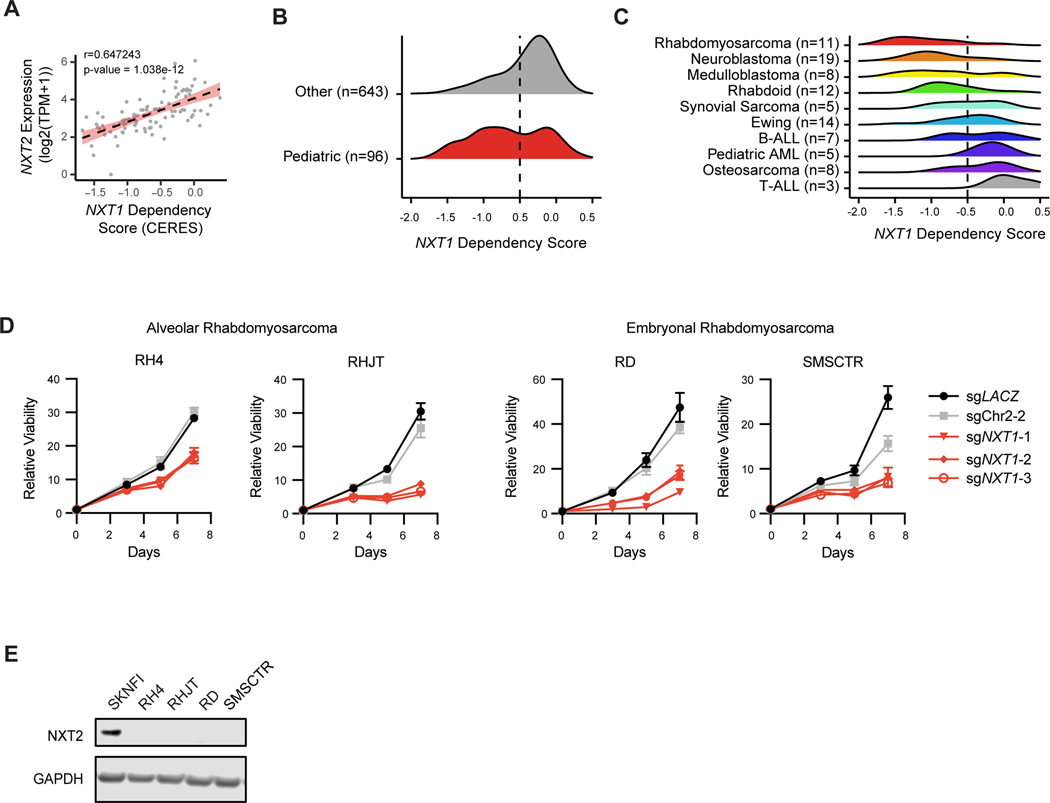
Cancer dependency maps, which use CRISPR/Cas9 depletion screens to profile the landscape of genetic dependencies in hundreds of cancer cell lines, have identified context-specific dependencies that could be therapeutically exploited. An ideal therapy is both lethal and precise, but these depletion screens cannot readily distinguish between gene effects that are cytostatic or cytotoxic. Here, we use a diverse panel of functional genomic screening assays to identify NXT1 as a selective and rapidly lethal in vivo relevant genetic dependency in MYCN-amplified neuroblastoma. NXT1 heterodimerizes with NXF1, and together they form the principal mRNA nuclear export machinery. We describe a previously unrecognized mechanism of synthetic lethality between NXT1 and its paralog NXT2: their common essential binding partner NXF1 is lost only in the absence of both. We propose a potential therapeutic strategy for tumor-selective elimination of a protein that, if targeted directly, is expected to cause widespread toxicity. SIGNIFICANCE: We provide a framework for identifying new therapeutic targets from functional genomic screens. We nominate NXT1 as a selective lethal target in neuroblastoma and propose a therapeutic approach where the essential protein NXF1 can be selectively eliminated in tumor cells by exploiting the NXT1-NXT2 paralog relationship.See related commentary by Wang and Abdel-Wahab, p. 2129.This article is highlighted in the In This Issue feature, p. 2113.


Figures

Figure 1.
Figure 1.. CRISPR screens prioritize rapidly lethal in vivo relevant dependencies
A, Diagram of gene selection and library design for neuroblastoma specific secondary screens. B, Scaled gene level dependency scores calculated with CERES from the DepMap screen (y-axis) are compared with scaled gene level dependency scores calculated with MAGeCK in our secondary screens at the same time point (21 days). Data for all 214 genes and all four cell lines are plotted. The Pearson correlation coefficient and p-value are shown. Individual cell lines are plotted in Fig. S1A. C, Heat map of scaled MAGeCK depletion scores for all genes that scored as a “strong hit” (median of positive controls in Chronos algorithm, see methods) in at least one cell line in CRISPR. Genes where intronic copy number control guides also scored are excluded. Cell lines and are indicated at the bottom and time points are indicated at the top. Color scale is indicated at right, where a value of −1 is equivalent to the median of the positive controls for that cell line at day 21, and 0 is equivalent to the cutting controls at day 21. Day 7 data for CHP-212 is not included because there was not adequate separation of positive and negative controls at this time-point. D, Heat map of scaled MAGeCK depletion scores for all genes that scored as a “hit” (median of positive controls in Chronos) in any cell line using CRISPRi/dCas9-KRAB. Gene effects are normalized as in B. As in B, Day 7 data for CHP-212 is not included because there was not adequate separation of positive and negative controls to identify hits. E, Correlation of gene effects in CRISPR and CRISPRi screens. The Chronos algorithm was used to calculate a single gene effect score incorporating data from all three time points (see methods). The y-axis indicates this value for each gene in the CRISPRi screens, the x-axis indicates this value for these genes in the CRISPR screens for each cell line. Each dot represents a gene included in the library. The cell line name is indicated at the top, and the Pearson correlation coefficient and p-value are displayed. The best fit line is plotted with standard deviation in red. F, Diagram of Annexin V positive selection screen for lethal dependencies. Briefly, cells were infected, selected, and then 7 days after infection Annexin V positive cells were purified using Annexin V antibody conjugated to magnetic beads and a magnetic column. Both input and the purified population were sequenced. G, The log2 fold change in abundance for guides in the Annexin V positive population relative to input was collapsed to gene level using the STARs algorithm. On the x-axis Annexin V enrichment is plotted for the cell line KELLY. These values are plotted on the y-axis for the SKNDZ cell line. Each dot indicates an individual gene. In gray are the 197 putative neuroblastoma dependencies. In red are the 17 positive control pan-essential genes. Genes that had enrichment scores equal to or greater than the median of the positive controls in both cell lines are labeled with their gene names. H, Diagram of the in vivo subcutaneous xenograft screen I, Correlation between in vitro and in vivo CRISPR screens in KELLY. Gene-level depletion scores were calculated with MAGeCK and the depletion for each gene in vitro at day 21 is indicated on the y-axis. The MAGeCK depletion score for these same genes in the in vivo subcutaneous xenograft model is shown on the x-axis. A subset of genes that depleted in vitro but did not deplete in vivo are labeled with their gene names. Positive control genes are highlighted in red. Pearson correlation coefficient and p-value are shown. The best fit line is plotted with standard error in red.
Figure 2.
Figure 2.. NXT1 is a selective and lethal dependency in neuroblastoma
A, Schematic of hit filtering strategy for secondary screens which identifies NXT1 as a top dependency. B, A violin plot of NXT1 dependency scores from the DepMap dataset. In red, are all neuroblastoma cell lines (n=19). In black are all other screened cell lines (n=720). The dashed line indicates the median for each, and the quartiles are shown as dotted lines. A two-tailed Mann-Whitney test was performed to compare the two groups, and the p-value is shown. C, Dependency on NXT1 was validated in two different neuroblastoma cell lines using three constitutive CRISPR guides. Non-targeting (sgLACZ) and cutting control (sgChr2–2) serve as negative controls. Viability was assessed using CellTiter-Glo on the days indicated and normalized to day 0. Data points are mean +/− stdev. D, Western blot showing PARP and GAPDH in SK-N-BE(2) cells 6 days after infection with the indicated constitutive CRISPR guides. sgIntron is an sgRNA that targets an intron in the 5’ UTR of NXT1 and is not expected to disrupt gene function (see methods). E, Relative viability of KELLY parental (black) and KELLY-NXT1deg (red) is shown, as in C. KELLY-NXT1deg is a cell line where endogenous NXT1 has been knocked out with CRISPR and exogenous NXT1 c-terminally tagged with HA and an FKBP12F36V degradation tag is expressed (see methods). F, Western blot of PARP, HA, and GAPDH in KELLY-NXT1deg with and without 24 hours of 500 nM dTAG13 treatment. G, Dose response curve to dTAG13 treatment in KELLY parental (black) and KELLY-NXT1deg (red). Data points indicate mean +/− stdev. H, Loss of NXT1 causes regression in a subset of established tumors. Subcutaneous xenografts with inducible sgRNAs targeting Chr2 or NXT1 as indicated were allowed to form and then randomized to doxycycline (+DOX) or normal chow conditions. Waterfall plot depicts the log2fold change in tumor volume four days after randomization. Each bar represents an individual tumor.
Figure 3.
Figure 3.. NXT1 loss leads to loss of NXF1
A, Diagram of NXT1 and NXF1 heterodimer (adapted from Aibara et al. (23)). B, Quantitative proteomics after 2 hours of dTAG13 treatment in KELLY-NXT1deg. X-axis indicates log2 of the relative protein abundance of mean dTAG13-treated to mean control (DMSO) samples. Y-axis indicates the -log10 of the p-value. Red dotted lines indicate q- and p-value cut-offs as indicated, and blue dotted lines indicate a cut-off of log2 fold change of 1. Proteins that reach these cut-offs are labeled. C, Western blot of NXF1 and GAPDH levels in SK-N-BE(2) cells five days after infection with constitutive CRISPR guides as indicated. Genetic editing of the NXT1 locus, calculated using TIDE, is shown below. D, Spline curves of dependency score distribution for all 739 cell lines in the DepMap data set. In red is NXT1 and in black is NXF1. Dependency scores are calculated with CERES and scaled such that −1 is equivalent to pan-essentials, and 0 is equivalent to negative control guides. E, NXT1 dependency in the DepMap dataset for neuroblastoma and other cell lines is shown. On the y-axis is the probability of dependency on NXT1 for each cell line, and on the x-axis is the dependency score calculated by CERES. Each point represents an individual cancer cell line. In red, neuroblastoma cell lines (n=19) are shown. In gray, other cell lines (n=720) are shown. Three neuroblastoma cell lines that do not show dependency on NXT1 are labeled with their cell line names. F, GIMEN cells were infected with negative control (sgLACZ or sgChr2–2, black and gray) and three different sgRNAs targeting NXT1 (red). Viability relative to day 0 was determined using CellTiter-Glo on the indicated days and mean +/− stdev of replicates is shown. G, GIMEN cells were stably infected with indicated sgRNAs and a western blot assessing NXF1, PARP, and GAPDH levels was performed. Below, the percent of CRISPR editing at the NXT1 locus calculated with the TIDE algorithm is shown. H, Dose-response curve for GIMEN parental (black) and GIMEN-NXT1deg (red) where endogenous NXT1 has been knocked out, and a degradable exogenous form of NXT1 is expressed (see methods). I, Western blot showing PARP, NXF1, HA-NXT1, and GAPDH levels after treatment with 500 nM dTAG13 for the indicated amount of time in GIMEN-NXT1deg. J, Immunoprecipitations were performed using antibodies targeting mouse and rabbit IgG, NXF1 (mouse) and HA (rabbit) six hours after DMSO or 500 nM dTAG13 treatment, as indicated in the KELLY-NXT1deg cell line. NXF1 and HA levels are shown detecting endogenous NXF1 and HA-tagged NXT1 respectively. Input lysate is shown to the left with NXF1, HA, and GAPDH.
Figure 4.
Figure 4.. Low NXT2 expression is necessary and sufficient for NXT1 dependency in neuroblastoma
A, Pearson correlations were calculated for gene expression and NXT1 dependency for all genes and cell lines in the DepMap dataset. Volcano plot indicates the Pearson correlation on the x-axis and the -log10 of the q-value on the y-axis. Each dot indicates a different gene. In red, NXT2, the gene whose expression is most significantly associated with NXT1 dependency is shown. B, The correlation between NXT2 expression and NXT1 dependency in neuroblastoma cell lines in DepMap is shown. The y-axis indicates the expression of NXT2 in log2 transcripts per million (TPM) +1. The x-axis indicates the scaled-CERES score for NXT1. Each data point indicates a different neuroblastoma cell line (n=19). The Pearson correlation coefficient and p-value are shown at the top. The best-fit line is plotted as a dotted line. C, NXT2 expression (log2 transformed, y-axis) was assessed across the R2 database of microarray data (u133p2, MAS5.0) from patient tumor samples. Data sets in the same cancer type were collapsed for clarity. Cancer type is shown on the x-axis. Sample sizes are as follows: Neuroblastoma (n=233), Breast (n=1994), ATRT (n=67), Bladder (n=93), Cervix (n=351), CNS/PNET (n=206), Colorectal (n=2182), Endometrium (n=209), Ependymoma (n=376), Esophogeal (n=40), Ewing Sarcoma (n=154), Germ Cell Tumor (n=13), Glioblastoma (n=200), Glioma (n=607), Hepatocellular Carcinoma (n=91), Kidney (n=261), Lung (n=514), Medulloblastoma (n=350), Melanoma (n=44), Oral Cavity (n=103), Osteosarcoma (n=27), Ovary (n=787), Pancreatic (n=32), Pilocytic Astrocytoma (n=41), Prostate (n=71), Rhabdoid (n=51), Rhabdomyosarcoma (n=58), Thyroid (n=34). D, Western blot showing NXT2 and GAPDH levels in three neuroblastoma patient-derived xenograft models (COGN-424X, COGN-557X, COGN603X). The NXT2-high cell line SK-N-FI serves as a positive control. E, The relative viability effect of the indicated sgRNAs after seven days of growth is shown as the mean +/− stdev. In black is SK-N-BE(2) parental, in red is SK-N-BE(2) over-expressing a MYC-tagged NXT2. sgPOLR1C-1 targets the essential gene POLR1C. n.s. indicates a p-value of >0.05 in a two-way ANOVA followed by Tukey’s multiple comparison test, while *** indicates a p-value of <0.001 (degrees of freedom =50). F, Western blot depicting NXF1, MYC-tagged exogenous NXT2, and GAPDH levels in SK-N-BE(2) cells 5 days after infection with the indicated CRISPR guides. CRISPR editing of the NXT1 locus is shown below as determined using the TIDE algorithm. G, Dose response curve for dTAG13 in parental SK-N-BE(2) (black) SK-N-BE(2)-NXT1deg (red, endogenous NXT1 knocked out, degradable NXT1 exogenously expressed), and SK-N-BE(2)-NXT1deg+NXT2 (endogenous NXT1 knocked out, degradable NXT1 exogenously expressed, and NXT2 exogenously expressed). H, Western blot depicting PARP, NXF1, HA-NXT1, MYC-tagged NXT2, and GAPDH levels after 24 hours of treatment with DMSO, 500 nM dTAG13, or 500 nM of dTAG13-NEG, an inactive form of dTAG13, as indicated at the top. At left is SK-N-BE(2)-NXT1deg, at right SK-N-BE(2)-NXT1deg+NXT2. I, Immunoprecipitations were performed using antibodies targeting mouse IgG, NXF1 and MYC (NXT2) six hours after DMSO or 500 nM dTAG13 treatment, as indicated in the KELLY-NXT1deg cell line overexpressing NXT2. Input lysate is shown to the left. NXF1, NXT2, HA (NXT1), and GAPDH levels are shown. J, Dose response curve for dTAG13 in GIMEN- NXT1deg with a non-targeting sgRNA (sgLACZ, black) and GIMEN-NXT1deg with a sgRNA targeting NXT2 (sgNXT2, red) after 72h of treatment. Y-axis indicates relative viability and x-axis indicates log of nM dose of dTAG13. K, Western blot in GIMEN- NXT1deg after infection with indicated sgRNA 24 hrs after treatment with DMSO or 500 nM dTAG13 as indicated. L, NXT2 expression Z-score for 200 neuroblastoma tumor samples in the Gabriella Miller Kid’s First (GMKF) dataset is shown on the y-axis. Samples are binned according to MYCN copy number as indicated. A t-test with Welch’s correction was not significant (n.s.). M. As in L, NXT2 expression for the GMKF dataset is shown on the y-axis, and samples are binned based on whether they contain a putative driver mutation in ALK. A t-test with Welch’s correction was not significant (n.s.).
Figure 5.
Figure 5.. Other pediatric cancer types have low NXT2 and are dependent on NXT1
A, Correlation between NXT2 expression (log2 (TPM+1)) and NXT1 dependency in pediatric cancer cell lines in DepMap (n=96). Y-axis indicates expression of NXT2 (log2 (TPM+1)). X-axis indicates scaled-CERES score for NXT1. Pearson correlation coefficient and p-value are shown at the top. The best-fit line is plotted as a dotted line, with standard error in red. B, Gene effect distributions for NXT1 in pediatric cancer cell lines (n=96, black) and adult cancer cell lines (n=643 gray). Dashed red line at −0.5 indicates the gene effect score cut-off to be considered a dependency C, Gene effect distributions for NXT1 are shown for all pediatric cell lines included in B, separated by lineage as indicated. Cell line names are at top, and cell lines are grouped by their disease subtype. D, Viability effects of negative control sgRNAs (sgLACZ and sgChr2–2) and sgRNAs targeting NXT1 in four different rhabdomyosarcoma cell lines. Cell lines were infected with indicated constitutive CRISPR guides and then viability relative to day 0 was assessed using CellTiter-Glo at indicated time points. Mean relative viability +/− stdev of technical replicates is shown. E, Western blot depicting GAPDH and NXT2 levels in rhabdomyosarcoma cell lines. The NXT2 high expressing cell line SK-N-FI serves as a control.

Comment in

References

    1. Tsherniak A, Vazquez F, Montgomery PG, Weir BA, Kryukov G, Cowley GS, et al.Defining a Cancer Dependency Map. Cell. 2017;170:564–576.e16. - PMC - PubMed
    1. Meyers RM, Bryan JG, McFarland JM, Weir BA, Sizemore AE, Xu H, et al.Computational correction of copy number effect improves specificity of CRISPR-Cas9 essentiality screens in cancer cells. Nat Genet. 2017;49:1779–84. - PMC - PubMed
    1. Behan FM, Iorio F, Picco G, Gonçalves E, Beaver CM, Migliardi G, et al.Prioritization of cancer therapeutic targets using CRISPR-Cas9 screens. Nature. 2019;568:511–6. - PubMed
    1. Chen L, Alexe G, Dharia NV, Ross L, Iniguez AB, Conway AS, et al.CRISPR-Cas9 screen reveals a MYCN-amplified neuroblastoma dependency on EZH2. J Clin Invest. American Society for Clinical Investigation; 2018;128:446–62. - PMC - PubMed
    1. Chan EM, Shibue T, McFarland JM, Gaeta B, Ghandi M, Dumont N, et al.WRN helicase is a synthetic lethal target in microsatellite unstable cancers. Nature. 2019;568:551–6. - PMC - PubMed

Publication types

Substances