. 2021 Jul;70(7):1549-1560.
doi: 10.2337/db20-1220. Epub 2021 Apr 21.

Vascular Expression of Permeability-Resistant Occludin Mutant Preserves Visual Function in Diabetes

Affiliations

Vascular Expression of Permeability-Resistant Occludin Mutant Preserves Visual Function in Diabetes

Andreia Goncalves et al. Diabetes. 2021 Jul.

Abstract

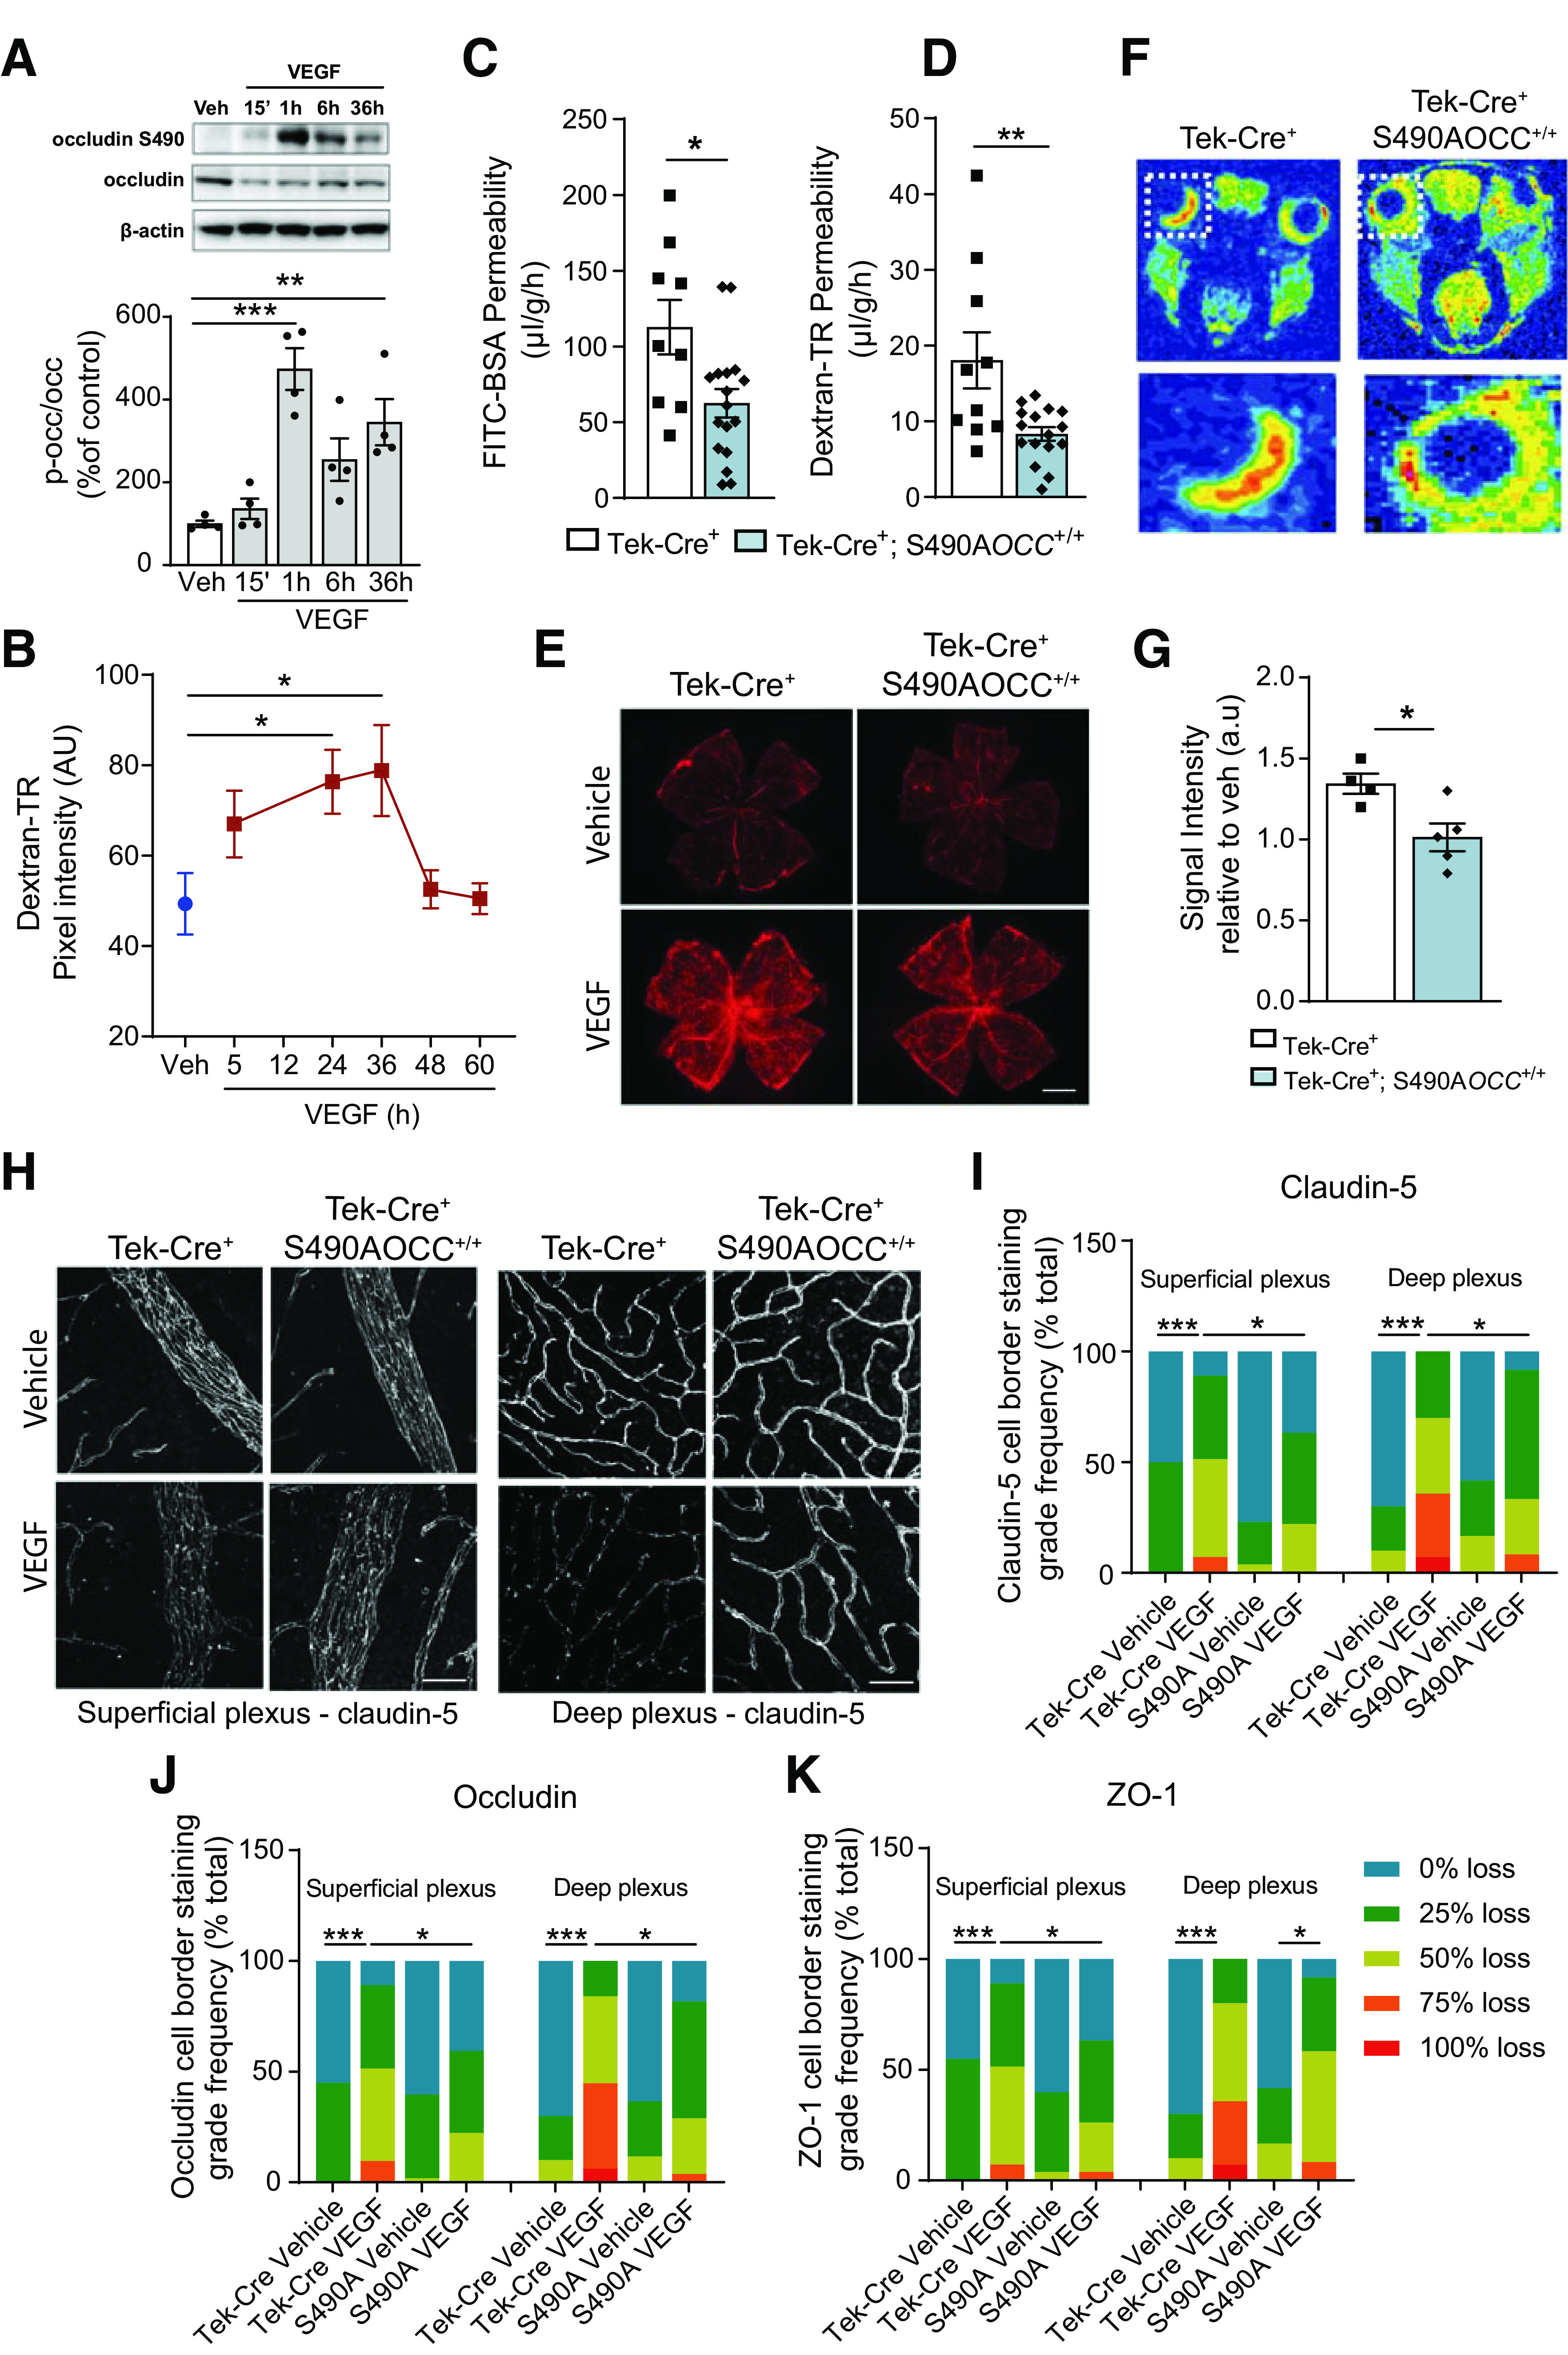
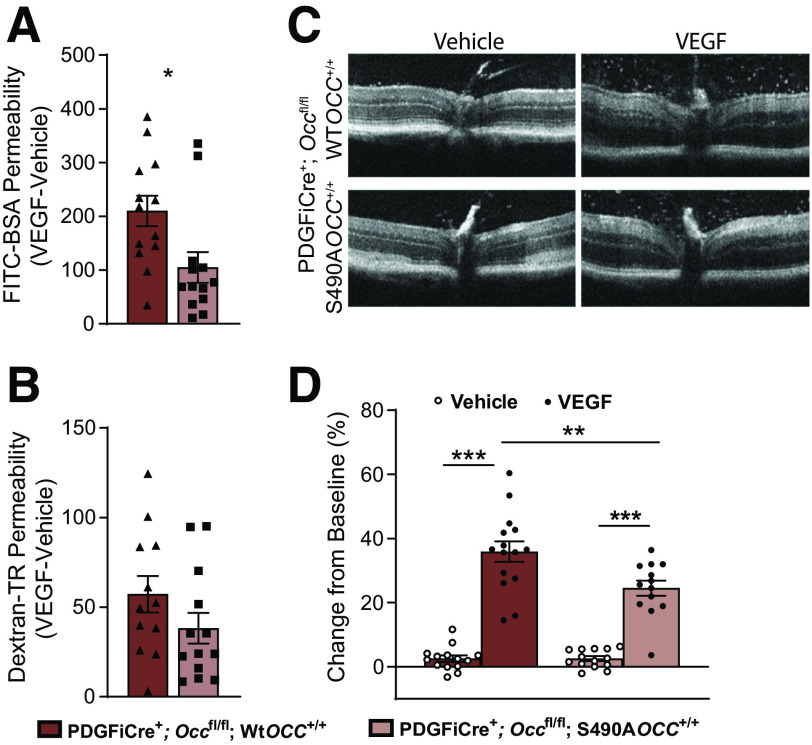
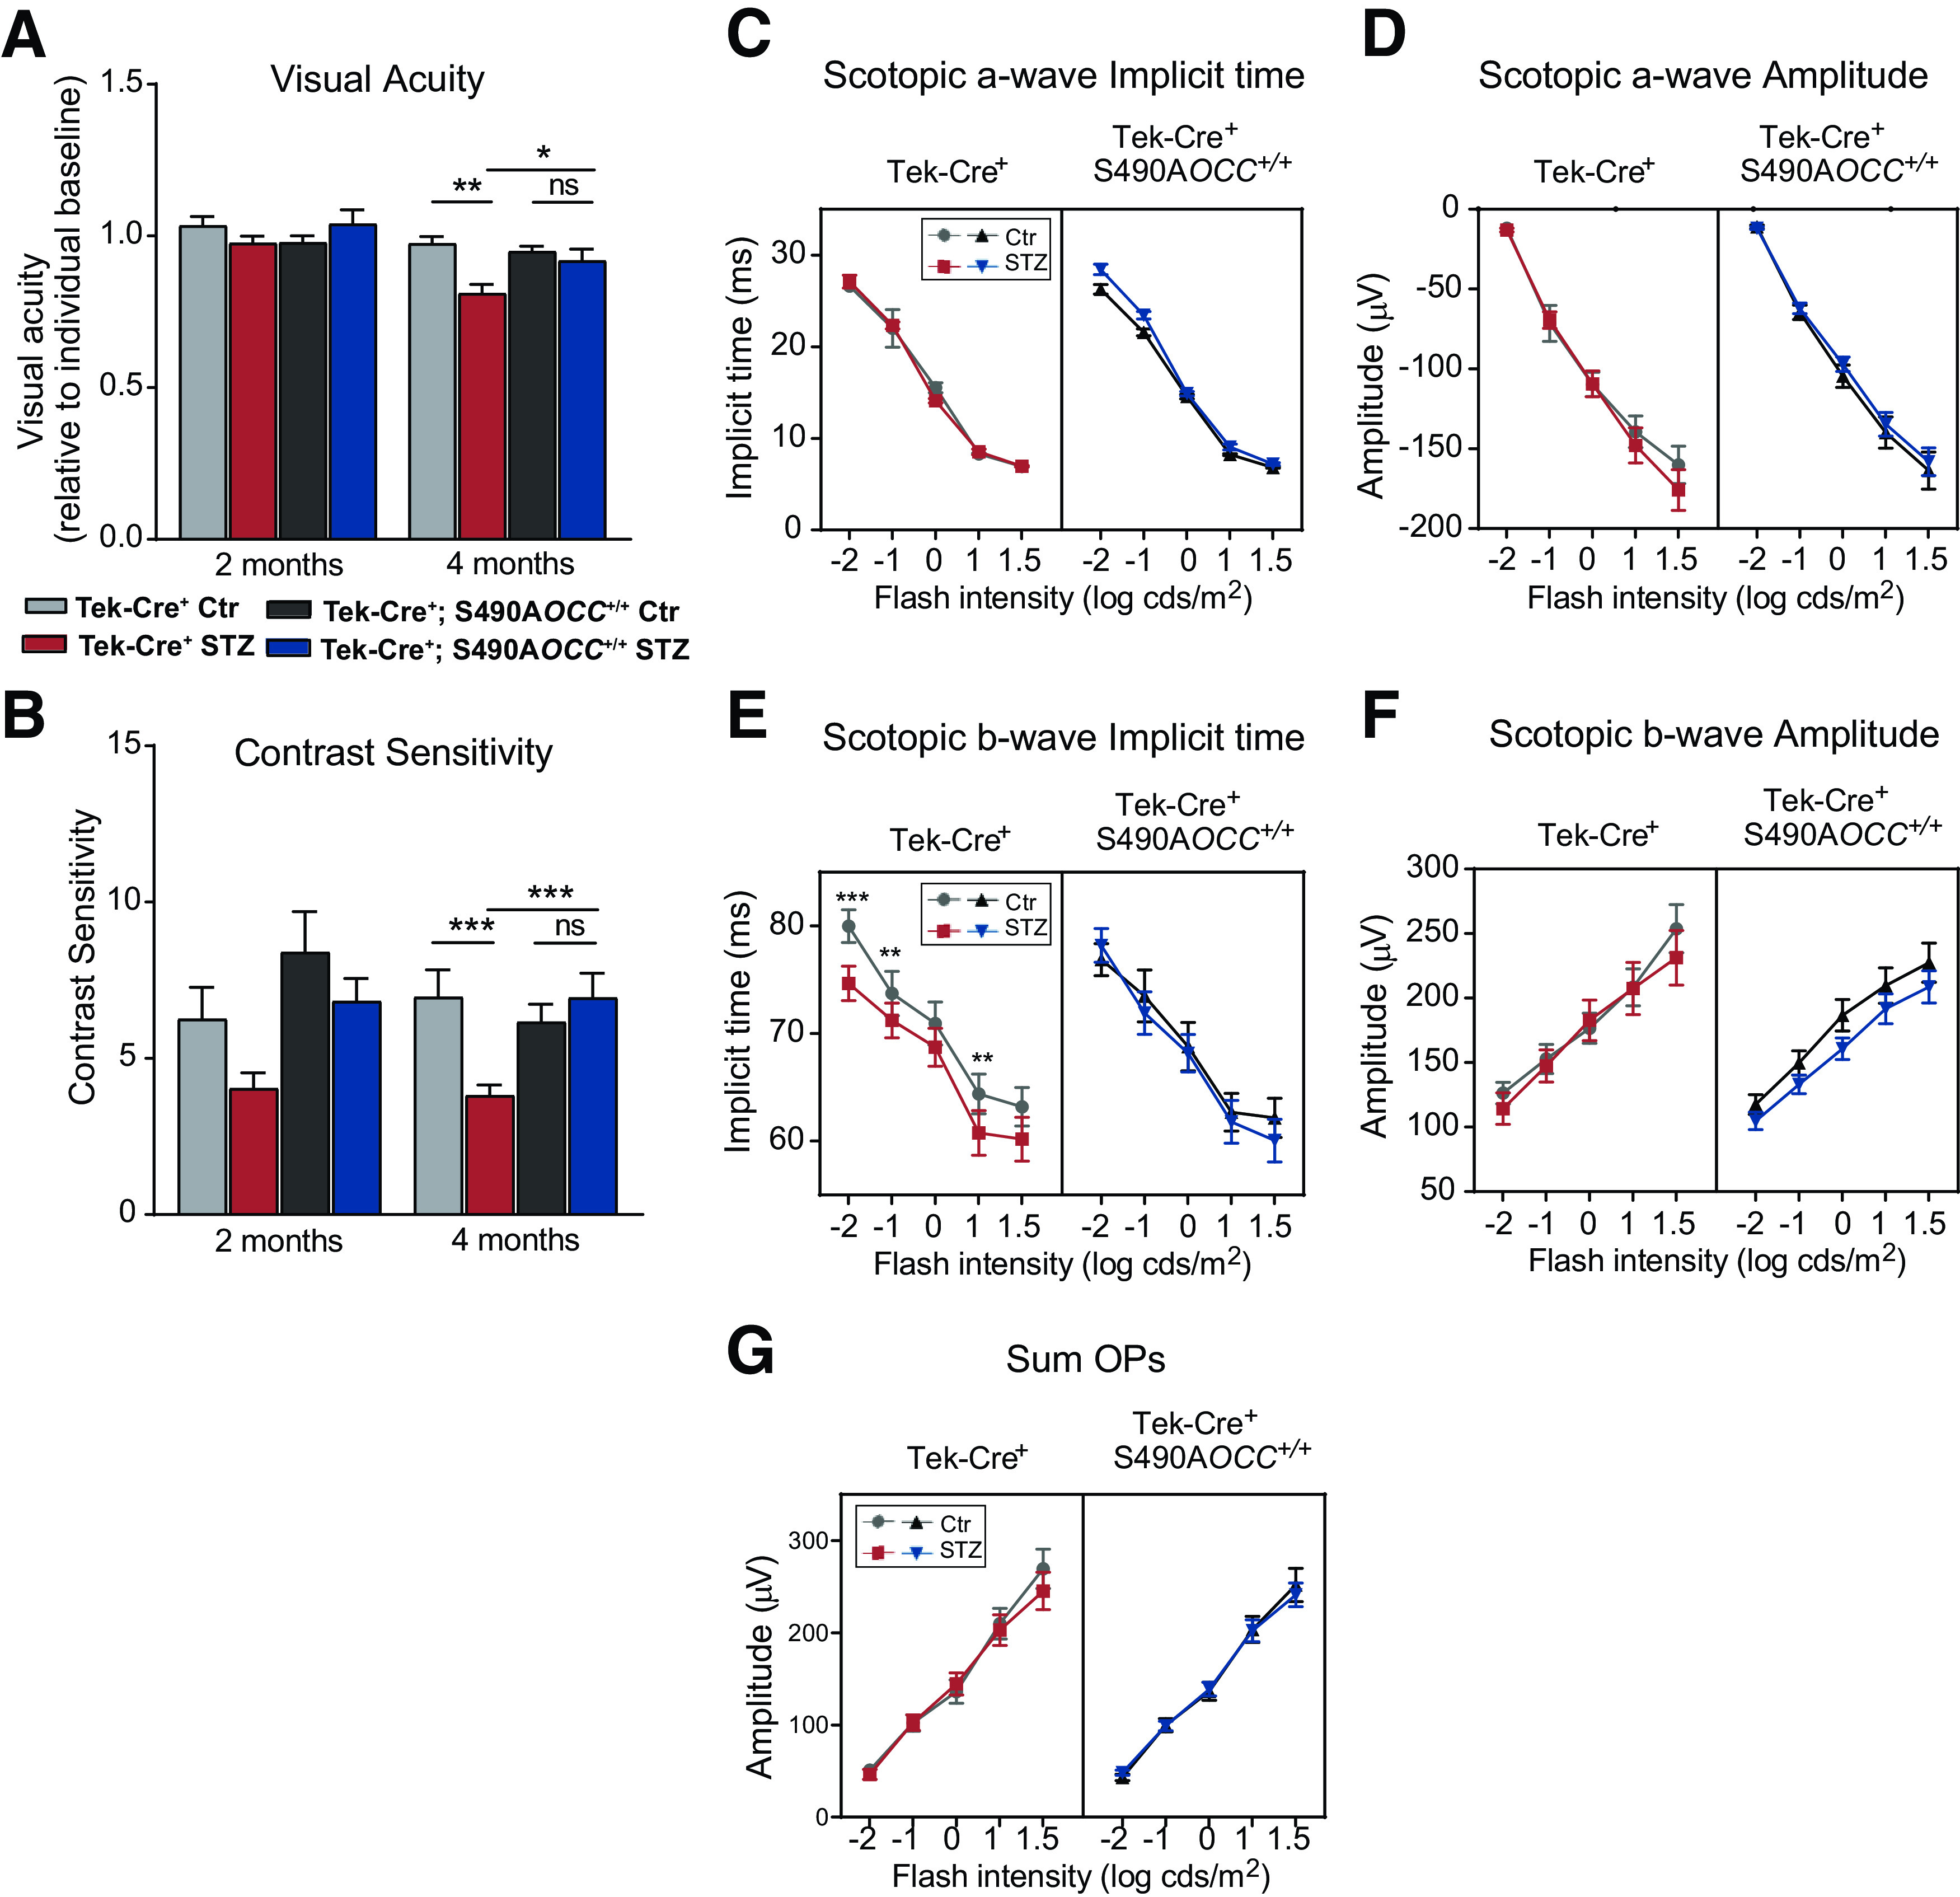
Diabetic retinopathy is one of the leading causes of vision loss and blindness. Extensive preclinical and clinical evidence exists for both vascular and neuronal pathology. However, the relationship of these changes in the neurovascular unit and impact on vision remains to be determined. Here, we investigate the role of tight junction protein occludin phosphorylation at S490 in modulating barrier properties and its impact on visual function. Conditional vascular expression of the phosphorylation-resistant Ser490 to Ala (S490A) form of occludin preserved tight junction organization and reduced vascular endothelial growth factor (VEGF)-induced permeability and edema formation after intraocular injection. In the retinas of streptozotocin-induced diabetic mice, endothelial-specific expression of the S490A form of occludin completely prevented diabetes-induced permeability to labeled dextran and inhibited leukostasis. Importantly, vascular-specific expression of the occludin mutant completely blocked the diabetes-induced decrease in visual acuity and contrast sensitivity. Together, these results reveal that occludin acts to regulate barrier properties downstream of VEGF in a phosphorylation-dependent manner and that loss of inner blood-retinal barrier integrity induced by diabetes contributes to vision loss.


Figures

Figure 1
Figure 1
Occludin S490 phosphorylation contributes to VEGF-induced retinal permeability in mice. Mice were given an intravitreal injection of 200 ng VEGF in one eye and vehicle in the other. Retinas were collected at different times after VEGF injection to assess occludin S490 phosphorylation by Western blot (A), or BRB permeability to 70-kDa dextran in cross sections (B) (n = 6–8). AU, arbitrary units; TR, tetramethylrhodamine. Tek-Cre+ and Tek-Cre+; S490AOCC+/+ mice were given an intravitreal injection of 200 ng VEGF in one eye and vehicle in the other and retinal vascular permeability to FITC-BSA (C), and 70-kDa dextran (D) was determined after 36 h of VEGF intravitreal injection by extracting the extravasated dye into the tissue. Data were normalized to the vehicle injected eye of each mouse. E: Representative images of 70-kDa RITC-dextran fluorescence in whole-mounted retinas, showing vascular leakage sites induced by VEGF (n = 3). Scale bar: 1 mm. Vascular permeability to gadolinium (742 Da) was determined by dynamic contrast-enhanced MRI 36 h after VEGF (100 ng). F: Representative coronal images showing extravasated gadolinium in color scale and magnification of highlighted regions of VEGF-injected eyes. G: Signal was quantified and normalized to the vehicle injected eye of each mouse. a.u., arbitrary units. H: Representative images of claudin-5 staining in the superficial and deep capillary plexus in retina flat mounts, 36 h after VEGF injection (n = 3–4). Scale bar: 50 μm. Masked scoring of claudin-5 (I), occludin (J), and ZO-1 (K) border staining, ranking in five categories of loss, of at least four pictures per retina. Data are represented as mean ± SEM. *P < 0.05, **P < 0.01, ***P < 0.001 by two-tailed Student t test (C, D, and G), one-way ANOVA, followed by the Dunnett (A and B) or the Sidak post hoc test (IK). See also Supplementary Figs. 1 and 2.
Figure 2
Figure 2
Blocking occludin S490 phosphorylation prevents VEGF-induced permeability and edema formation. PDGFiCre+; Occfl/fl; WtOCC+/+ and PDGFiCre+; Occfl/fl; S490AOCC+/+ mice were given an intravitreal injection of 200 ng VEGF in one eye and vehicle in the other, and after 36 h, retinal vascular permeability to FITC-BSA (A) and 70-kDa dextran (B) was determined by extracting the extravasated dye into the tissue. TR, tetramethylrhodamine. Data were normalized to the vehicle-injected eye of each mouse. VEGF-induced retinal edema formation was determined by measuring retinal thickness by OCT (C), and the percentage change from baseline was calculated (D). Data are represented as mean ± SEM. *P < 0.05, **P < 0.01, ***P < 0.001 by two-tailed Student t test (A and B) or one-way ANOVA, followed by Sidak post hoc test (D). See also Supplementary Fig. 3.
Figure 3
Figure 3
Blocking occludin phosphorylation at S490 prevents diabetes-induced BRB permeability and leukostasis. Diabetes was induced by STZ injection in Tek-Cre+ and Tek-Cre+; S490AOCC+/+ mice. A: After 4 months, retinal vascular permeability to 70-kDa dextran (red) was determined in retinal cross sections counterstained with Hoechst (blue) for nuclei visualization. Scale bar: 50 μm. Ctr, control; GCL, ganglion cell layer; IPL, inner plexiform layer; ONL, outer nuclear layer. B: Quantification of the intensity of extravasated dye to the inner plexiform and outer nuclear layers. AU, arbitrary units; TR, tetramethylrhodamine. C: Representative confocal images from the superficial capillary plexus of retinas stained with vessel marker isolectin B4 (IB4) (gray), leukocyte marker CD45 (red), and microglia/macrophage marker Iba1 (green). Scale bar: 50 μm. The number of CD45+ (D) and Iba1+ (E) cells were counted in the whole retina from stitched images. Ctrl, control. Data are represented as mean ± SEM. *P < 0.05, ***P < 0.001 by one-way ANOVA, followed by the Sidak post hoc test. See also Supplementary Figs. 4 and 5.
Figure 4
Figure 4
Blocking occludin S490A phosphorylation does not prevent neuronal cell death induced by diabetes. In vivo OCT was used to measure total (A), inner (inner nuclear layer through nerve fiber layer) (B), and outer (photoreceptor layer through outer plexiform layer) (C) retinal thickness was at 2 and 4 months after diabetes induction (n = 14–24). D: Representative OCT from Tek-Cre+ and Tek-Cre+; S490AOCC+/+ mice after 4 months of diabetes induction. E: Representative images showing TUNEL+ cells (purple, arrows) and nuclear counterstaining with Hoechst (blue) in retinal sections. Scale bar: 50 μm. F: Retinal cell death was determined by the number of TUNEL+ cells per retinal mm2 after 4 months of diabetes induction. Ctr, control GCL, ganglion cell layer; INL, inner nuclear layer; ONL, outer nuclear layer. Data are represented as mean ± SEM. *P < 0.05, **P < 0.01, ***P < 0.001 by one-way ANOVA, followed by the Sidak post hoc test. See also Supplementary Fig. 6.
Figure 5
Figure 5
Expressing S490A occludin mutant prevents diabetes-induced decrease in visual function. Diabetes was induced by STZ injection in Tek-Cre+ and Tek-Cre+; S490AOCC+/+ mice. Visual function was assessed with an OptoMotry by measuring the optokinetic response after 2 and 4 months of diabetes induction. A: Visual acuity was measured as the spatial frequency thresholds of the grating at 100% contrast until animals no longer tracked (n = 13–22). Ctr, control. B: Contrast sensitivity was determined as the minimum contrast that generates tracking (n = 18–36). At 4 months after diabetes induction, scotopic ERG responses were recorded at increasing stimulus intensities. Implicit time and amplitude of a-wave (C and D) and b-wave (E and F) were calculated by the software. G: Oscillatory potentials were isolated and summed (n = 22–50). cds, candelas. Data are represented as mean ± SEM. *P < 0.05, **P < 0.01, ***P < 0.001 by one-way ANOVA, followed by the Sidak post hoc test. See also Supplementary Fig. 6.

References

    1. Simó R, Stitt AW, Gardner TW. Neurodegeneration in diabetic retinopathy: does it really matter? Diabetologia 2018;61:1902–1912 - PMC - PubMed
    1. Barber AJ, Lieth E, Khin SA, Antonetti DA, Buchanan AG, Gardner TW. Neural apoptosis in the retina during experimental and human diabetes. Early onset and effect of insulin. J Clin Invest 1998;102:783–791 - PMC - PubMed
    1. Abcouwer SF, Gardner TW. Diabetic retinopathy: loss of neuroretinal adaptation to the diabetic metabolic environment. Ann N Y Acad Sci 2014;1311:174–190 - PMC - PubMed
    1. Duh EJ, Sun JK, Stitt AW. Diabetic retinopathy: current understanding, mechanisms, and treatment strategies. JCI Insight 2017;2:e93751 - PMC - PubMed
    1. Simó R, Sundstrom JM, Antonetti DA. Ocular Anti-VEGF therapy for diabetic retinopathy: the role of VEGF in the pathogenesis of diabetic retinopathy. Diabetes Care 2014;37:893–899 - PubMed

Publication types