

Sequence-Function Relationships in Phage-Encoded Bacterial Cell Wall Lytic Enzymes and Their Implications for Phage-Derived Product Design
- PMID: 33883227
- PMCID: PMC8223927
- DOI: 10.1128/JVI.00321-21
Sequence-Function Relationships in Phage-Encoded Bacterial Cell Wall Lytic Enzymes and Their Implications for Phage-Derived Product Design
Abstract
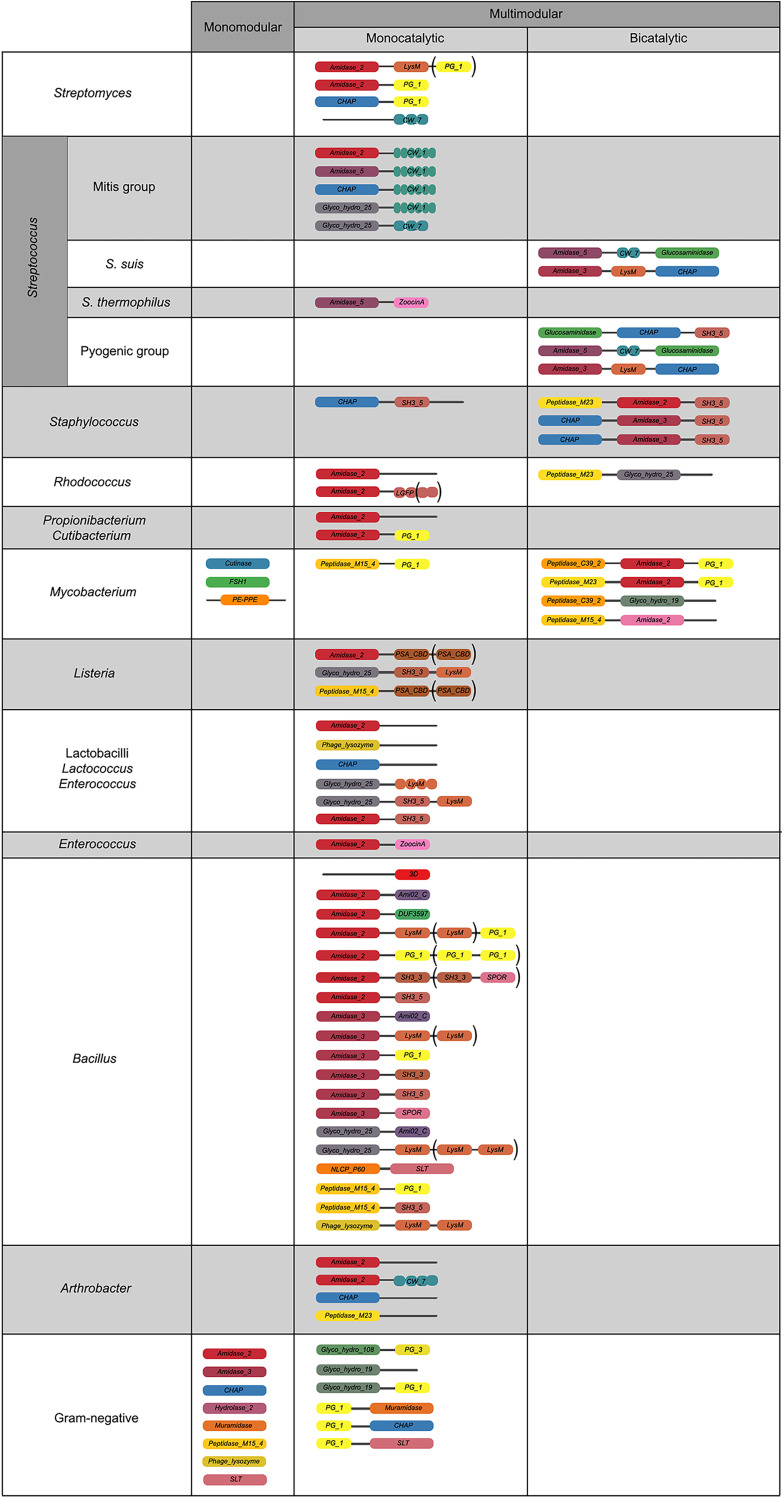
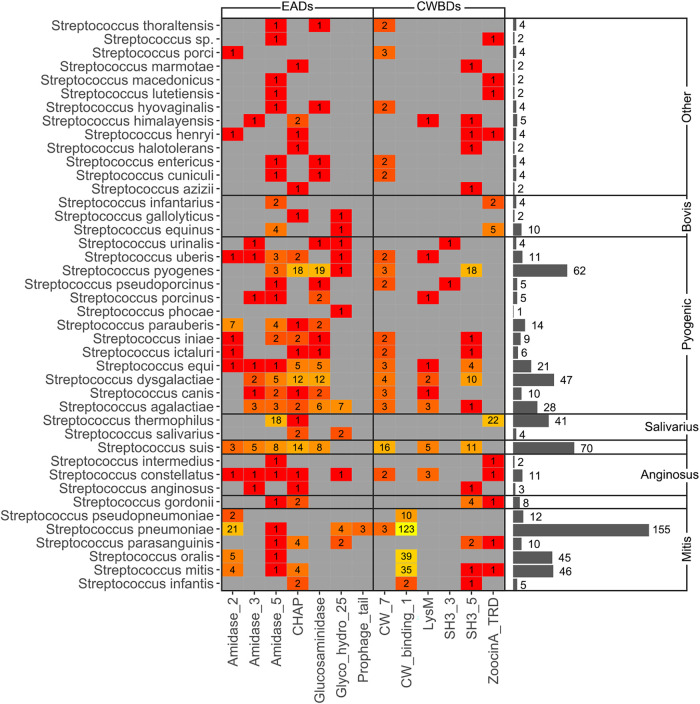
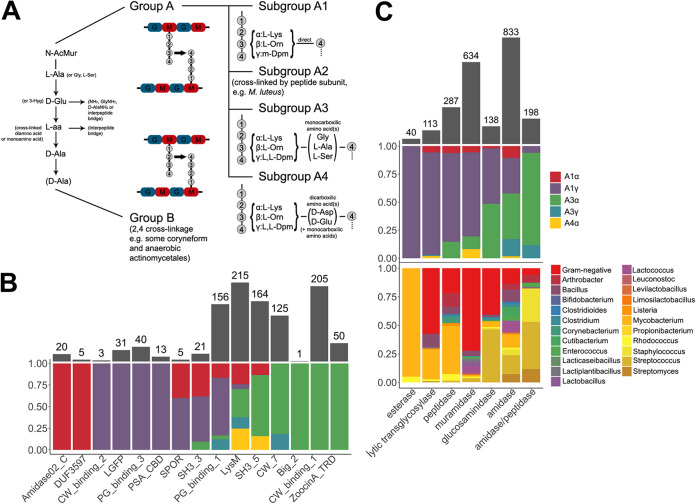
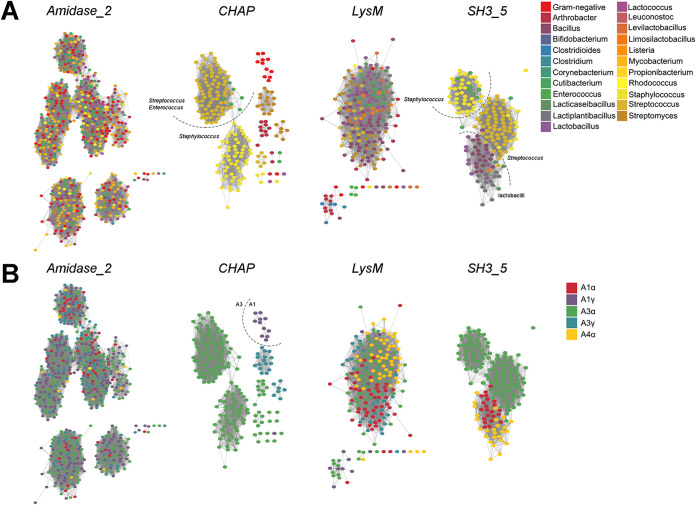
Phage (endo)lysins are thought to be a viable alternative to usual antibiotic chemotherapy to fight resistant bacterial infections. However, a comprehensive view of lysins' structure and properties regarding their function, with an applied focus, is somewhat lacking. Current literature suggests that specific features typical of lysins from phages infecting Gram-negative bacteria (G-) (higher net charge and amphipathic helices) are responsible for improved interaction with the G- envelope. Such antimicrobial peptide (AMP)-like elements are also of interest for antimicrobial molecule design. Thus, this study aims to provide an updated view on the primary structural landscape of phage lysins to clarify the evolutionary importance of several sequence-predicted properties, particularly for the interaction with the G- surface. A database of 2,182 lysin sequences was compiled, containing relevant information such as domain architectures, data on the phages' host bacteria, and sequence-predicted physicochemical properties. Based on such classifiers, an investigation of the differential appearance of certain features was conducted. This analysis revealed different lysin architectural variants that are preferably found in phages infecting certain bacterial hosts. In particular, some physicochemical properties (higher net charge, hydrophobicity, hydrophobic moment, and aliphatic index) were associated with G- phage lysins, appearing specifically at their C-terminal end. Information on the remarkable genetic specialization of lysins regarding the features of the bacterial hosts is provided, specifically supporting the nowadays-common hypothesis that lysins from G- usually contain AMP-like regions. IMPORTANCE Phage-encoded lytic enzymes, also called lysins, are one of the most promising alternatives to common antibiotics. The potential of lysins as novel antimicrobials to tackle antibiotic-resistant bacteria not only arises from features such as a lower chance to provoke resistance but also from their versatility as synthetic biology parts. Functional modules derived from lysins are currently being used for the design of novel antimicrobials with desired properties. This study provides a view of the lysin diversity landscape by examining a set of phage lysin genes. We have uncovered the fundamental differences between the lysins from phages that infect bacteria with different superficial architectures and, thus, the reach of their specialization regarding cell wall structures. These results provide clarity and evidence to sustain some of the common hypotheses in current literature, as well as making available an updated and characterized database of lysins sequences for further developments.
Keywords: antimicrobial agents; bacteriophage therapy; bacteriophages; bioinformatics; endolysins; genomics.
Figures
Similar articles
-
Novel recombinant endolysin ointment with broad antimicrobial activity against methicillin-resistant Staphylococcus aureus isolated from wounds and burns.Arch Microbiol. 2023 Mar 4;205(4):104. doi: 10.1007/s00203-023-03434-x. Arch Microbiol. 2023. PMID: 36869962
-
A Novel Staphylococcus Podophage Encodes a Unique Lysin with Unusual Modular Design.mSphere. 2017 Mar 22;2(2):e00040-17. doi: 10.1128/mSphere.00040-17. eCollection 2017 Mar-Apr. mSphere. 2017. PMID: 28357414 Free PMC article.
-
Bacteriophages, phage endolysins and antimicrobial peptides - the possibilities for their common use to combat infections and in the design of new drugs.Ann Agric Environ Med. 2019 Jun 17;26(2):203-209. doi: 10.26444/aaem/105390. Epub 2019 Apr 11. Ann Agric Environ Med. 2019. PMID: 31232046 Review.
-
Investigating novel Streptomyces bacteriophage endolysins as potential antimicrobial agents.Microbiol Spectr. 2025 Jan 7;13(1):e0117024. doi: 10.1128/spectrum.01170-24. Epub 2024 Nov 21. Microbiol Spectr. 2025. PMID: 39570052 Free PMC article.
-
Bacteriophage-derived endolysins to target gram-negative bacteria.Int J Pharm. 2020 Nov 15;589:119833. doi: 10.1016/j.ijpharm.2020.119833. Epub 2020 Aug 30. Int J Pharm. 2020. PMID: 32877733 Review.
Cited by
-
Synergistic Enzybiotic Effect of a Bacteriophage Endolysin and an Engineered Glucose Oxidase Against Listeria.Biomolecules. 2024 Dec 28;15(1):24. doi: 10.3390/biom15010024. Biomolecules. 2024. PMID: 39858419 Free PMC article.
-
Improvement of the Antibacterial Activity of Phage Lysin-Derived Peptide P87 through Maximization of Physicochemical Properties and Assessment of Its Therapeutic Potential.Antibiotics (Basel). 2022 Oct 21;11(10):1448. doi: 10.3390/antibiotics11101448. Antibiotics (Basel). 2022. PMID: 36290106 Free PMC article.
-
Phage endolysins are adapted to specific hosts and are evolutionarily dynamic.PLoS Biol. 2022 Aug 1;20(8):e3001740. doi: 10.1371/journal.pbio.3001740. eCollection 2022 Aug. PLoS Biol. 2022. PMID: 35913996 Free PMC article.
-
Design, Screening, and Characterization of Engineered Phage Endolysins with Extracellular Antibacterial Activity against Gram-Negative Bacteria.Appl Environ Microbiol. 2023 Jul 26;89(7):e0058123. doi: 10.1128/aem.00581-23. Epub 2023 Jun 20. Appl Environ Microbiol. 2023. PMID: 37338346 Free PMC article.
-
Lysins as a powerful alternative to combat Bacillus anthracis.Appl Microbiol Biotechnol. 2024 Jun 8;108(1):366. doi: 10.1007/s00253-024-13194-3. Appl Microbiol Biotechnol. 2024. PMID: 38850320 Free PMC article. Review.
References
-
- European Antimicrobial Resistance Surveillance Network. 2019. Surveillance of antimicrobial resistance in Europe 2018.
-
- Centers for Disease Control and Prevention. 2019. Antibiotic resistance threats in the United States 2019.
Publication types
MeSH terms
Substances
LinkOut - more resources
Full Text Sources
Other Literature Sources
Medical
