. 2021 Apr;9(4):e001955.
doi: 10.1136/jitc-2020-001955.

Targeting resistance to radiation-immunotherapy in cold HNSCCs by modulating the Treg-dendritic cell axis

Affiliations

Targeting resistance to radiation-immunotherapy in cold HNSCCs by modulating the Treg-dendritic cell axis

Michael W Knitz et al. J Immunother Cancer. 2021 Apr.

Abstract

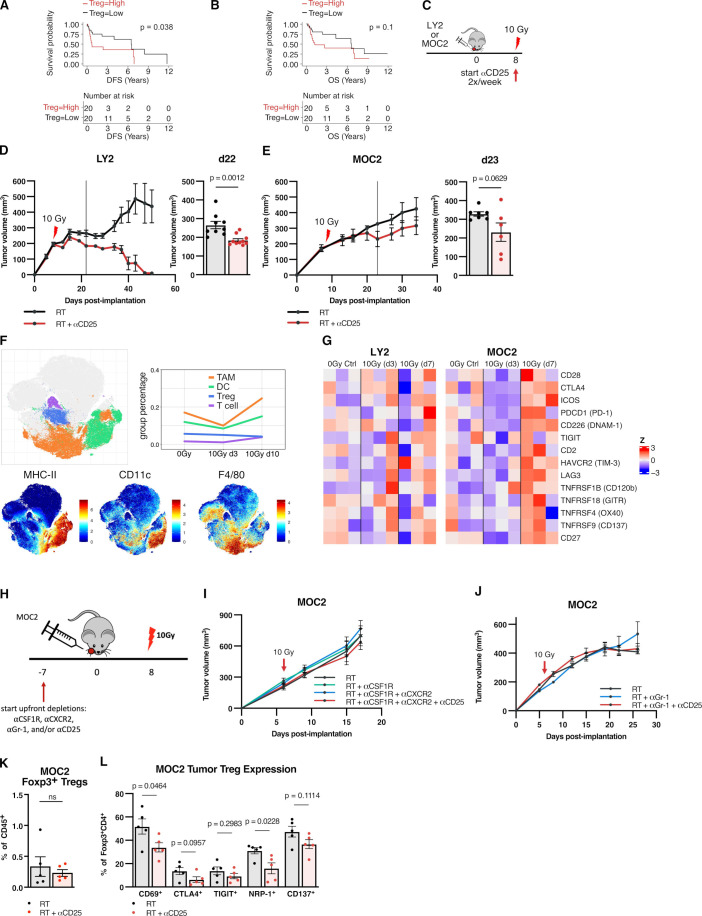
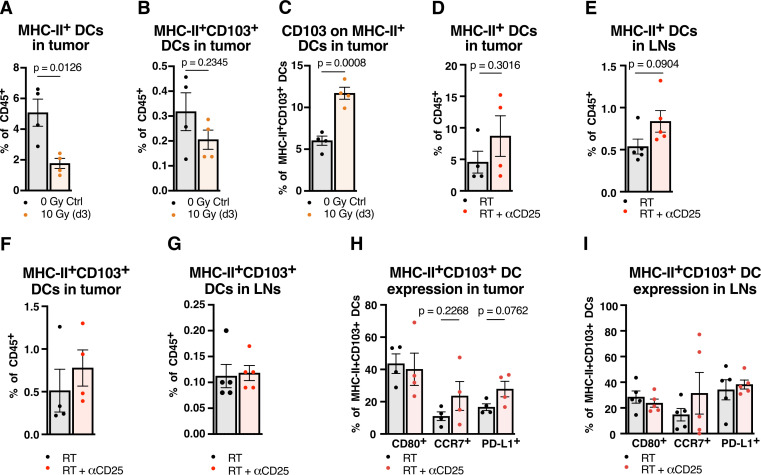
Background: Numerous trials combining radiation therapy (RT) and immunotherapy in head and neck squamous cell carcinoma (HNSCC) are failing. Using preclinical immune cold models of HNSCC resistant to RT-immune checkpoint inhibitors, we investigate therapeutic approaches of overcoming such resistance by examining the differential microenvironmental response to RT.

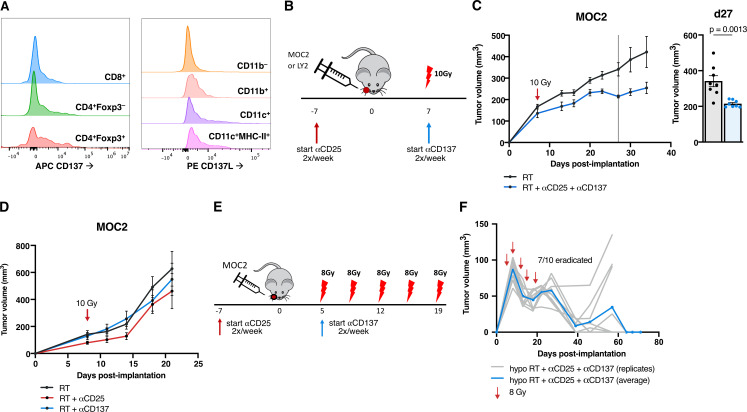
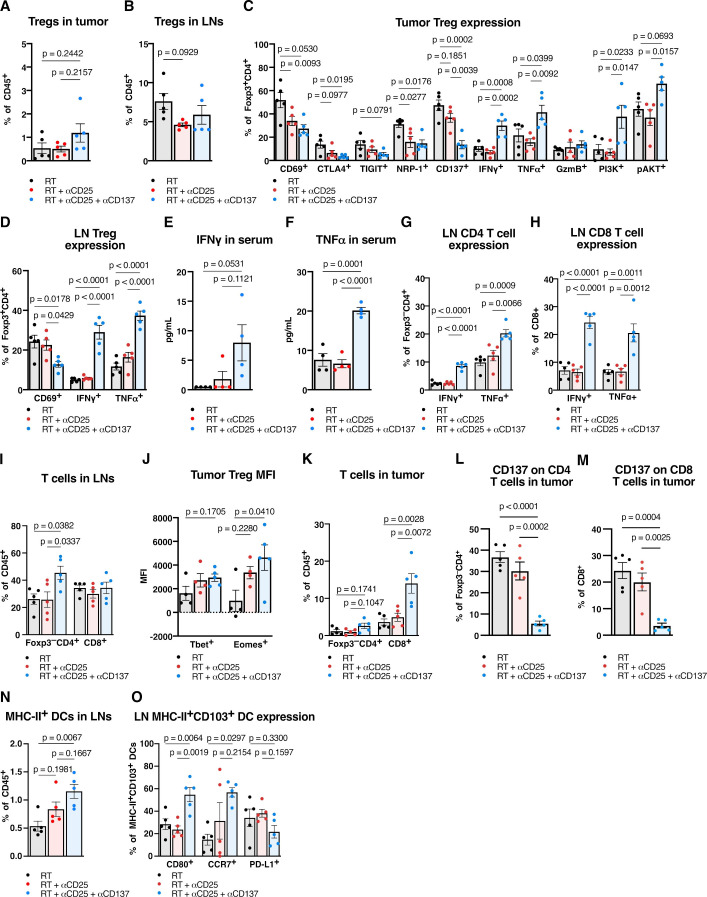
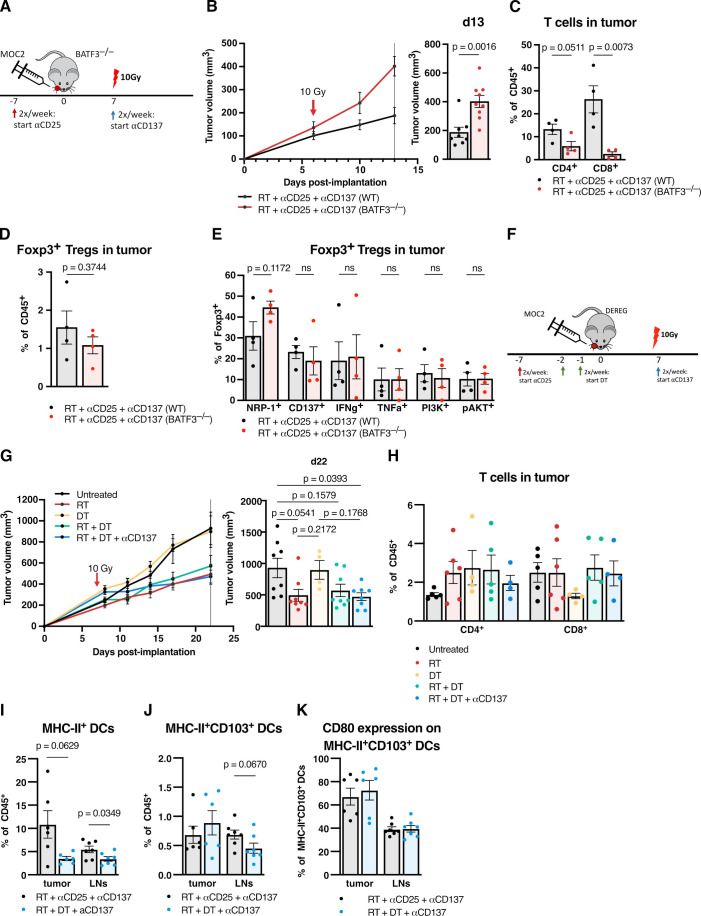
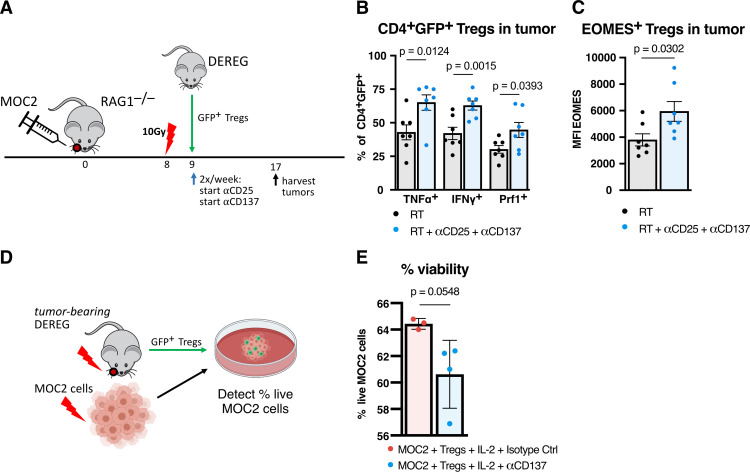
Methods: We subjected two HPV-negative orthotopic mouse models of HNSCC to combination RT, regulatory T cells (Treg) depletion, and/or CD137 agonism. Tumor growth was measured and intratumorous and lymph node immune populations were compared among treatment groups. Human gene sets, genetically engineered mouse models DEREG and BATF3-/-, flow and time-of-flight cytometry, RNA-Seq, Treg adoptive transfer studies, and in vitro experiments were used to further evaluate the role of dendritic cells (DCs) and Tregs in these treatments.

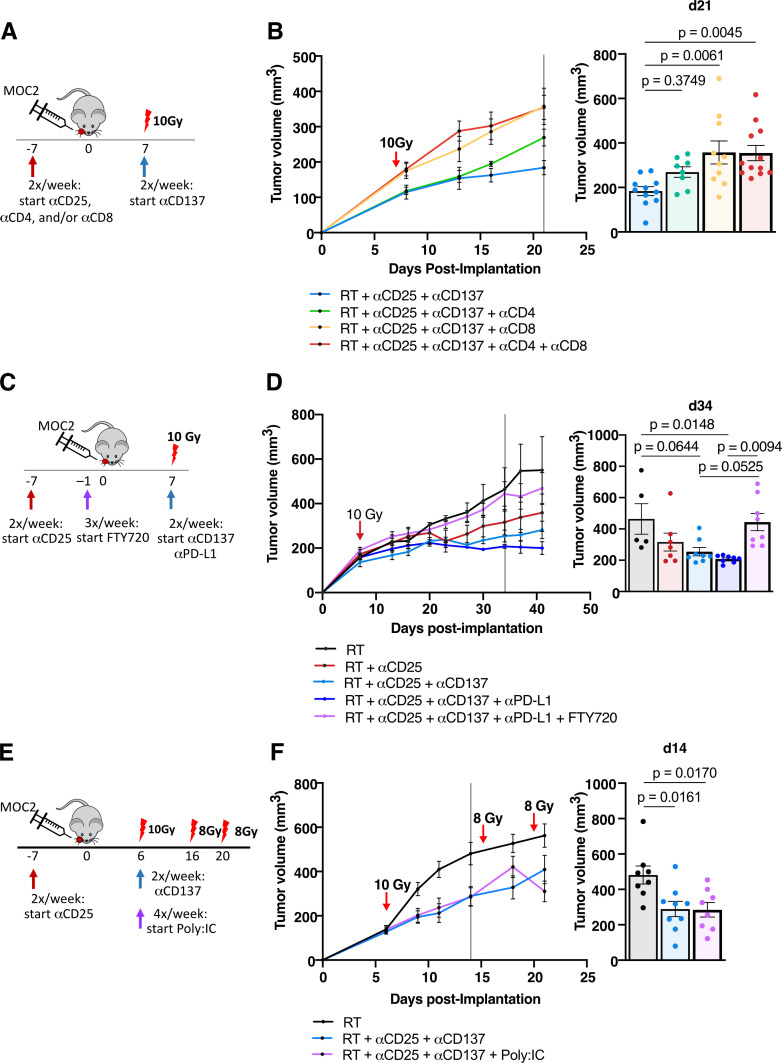
Results: In MOC2 orthotopic tumors, we find no therapeutic benefit to targeting classically defined immunosuppressive myeloids, which increase with RT. In these radioresistant tumors, supplementing combination RT and Treg depletion with anti-CD137 agonism stimulates CD103+ DC activation in tumor-draining lymph nodes as characterized by increases in CD80+ and CCR7+ DCs, resulting in a CD8 T cell-dependent response. Simultaneously, Tregs are reprogrammed to an effector phenotype demonstrated by increases in interferonγ+, tumor necrosis factorα+, PI3K+, pAKT+ and Eomes+ populations as well as decreases in CTLA4+ and NRP-1+ populations. Tumor eradication is observed when RT is increased to an 8 Gy x 5 hypofractionated regimen and combined with anti-CD25+ anti-CD137 treatment. In a human gene set from oral squamous cell carcinoma tumors, high Treg number is associated with earlier recurrence.

Conclusions: Regulating Treg functionality and DC activation status within the lymph node is critical for generating a T cell effector response in these highly radioresistant tumors. These findings underscore the plasticity of Tregs and represent a new therapeutic opportunity for reprogramming the tumor microenvironment in HNSCCs resistant to conventional radioimmunotherapy approaches.

Keywords: costimulatory and inhibitory t-cell receptors; dendritic cells; head and neck neoplasms; radioimmunotherapy; t-lymphocytes.


Conflict of interest statement

Competing interests: No, there are no competing interests.

Figures

Figure 1
Figure 1
High Tregs correlates with poor outcomes in oral cavity cancer, but response to Treg targeted therapy in preclinical models varies by tumor type and does not respond to myeloid depletion strategies. (A) Disease-free survival of 40 human OSCC patients, split into two cohorts Treg high (n=20) vs Treg low (n=20) based on combined median splits of normalized levels of FOXP3, IL-2RA and TGFB1 transcript expression. (B) Overall survival of human OSCC patients, Treg high (n=20) vs Treg low (n=20). (C) Experimental procedure for RT +anti-CD25 treatment in LY2 and MOC2 tumor models. (D) Tumor growth curves for mice treated with RT (n=9) vs RT +anti-CD25 (n=10) in LY2 tumor model and replicate values 22 days postimplantation (p=0.0012, unpaired two-tailed t-test). (E) Tumor growth curves for mice treated with RT (n=9) vs RT +anti-CD25 (n=10) in MOC2 tumor model and replicate values 23 days postimplantation (p=0.0629 by unpaired two-tailed t-test). (F) t-SNE plots from CyTOF analysis of MOC2 tumors harvested 3 and 10 days post-RT compared with 0 Gy controls depicting expression of total singlet CD45+ cells; expression plot of MHC-II, CD11c, and F4/80; line chart for average proportion of TAM, DC, Treg and T cell populations (n=3 mice/group). (G) Heatmap of gene expression Z-scores of genes encoding costimulation and coinhibition markers from LY2 and MOC2 tumors harvested three or 7 days post-RT compared with 0 Gy controls (n=3 mice/group). (H) Experimental procedure for RT, anti-CSF1R, anti-CXCR2, anti-Gr-1 and/or anti-CD25 treatment in MOC2 tumor model. (I) Tumor growth curves for mice treated with RT, anti-CSF1R, anti-CXCR2, anti-Gr-1 and/or anti-CD25 in MOC2 tumor model (n=8 mice/group). (J) Tumor growth curves for mice treated with RT, anti-Gr-1 and/or anti-CD25 in MOC2 tumor model (n=8 mice/group). (K) Proportion of CD45+CD3+CD4+Foxp3+ cells in MOC2 tumors harvested 13 days post-RT with RT +/–anti-CD25 treatment (n=5 mice/group). (L) Proportion of CD45+CD3+CD4+Foxp3+ cells in MOC2 tumors harvested 13 days post-RT with RT +/–anti-CD25 treatment expressing indicated markers (n=5 mice/group, unpaired two-tailed t-test). CSF1R, colony-stimulating factor 1 receptor; CyTOF, cytometry by time-of-flight; DC, dendritic cell; IL-2, interleukin 2; RT, radiation therapy; TAM, tumor-associated macrophage; TGFB1, transforming growth factor-β 1; Treg, regulatory T cell; t-SNE, t-distributed stochastic neighbor embedding.
Figure 2
Figure 2
Neither RT nor RT and Treg depletion therapy is sufficient to enhance antigen presentation in myeloid-driven tumors (A) proportion of CD45+F4/80Ly-6GCD11c+MHC-II+ DCs from MOC2 tumors harvested 3 days post-RT compared with 0 Gy controls (n=4 mice/group, p=0.0126, unpaired two-tailed t-test). (B) Proportion of CD45+F4/80Ly-6GCD11c+MHC-II+CD103+ DCs from MOC2 tumors harvested 3 days post-RT compared with 0 Gy controls (n=4 mice/group, p=0.2345, unpaired two-tailed t-test). (C) Proportion of CD45+F4/80Ly-6GCD11c+MHC-II+CD103+ DCs from MOC2 tumors harvested 3 days post-RT compared with 0 Gy controls (n=4 mice/group, p=0.0008, unpaired two-tailed T test). (D) Proportion of CD45+F4/80Ly-6GCD11c+MHC-II+ DCs in MOC2 tumors harvested 9 days post-RT with RT +/–anti-CD25 treatment (n=4 mice/group, p=0.3016, unpaired two-tailed t-test). (E) Proportion of CD45+F4/80Ly-6GCD11c+MHC-II+ DCs in MOC2 tumor draining lymph nodes harvested 9 days post-RT with RT +/–anti-CD25 treatment (n=5 mice/group, p=0.0904, unpaired two-tailed t-test). (F) Proportion of CD45+F4/80Ly-6GCD11c+MHC-II+CD103+ DCs in MOC2 tumors harvested 9 days post-RT with RT +/–anti-CD25 treatment (n=4 mice/group). (G) Proportion of CD45+F4/80Ly-6GCD11c+MHC-II+CD103+ DCs in MOC2 tumor draining lymph nodes harvested 9 days post-RT with RT +/–anti-CD25 treatment (n=5 mice/group). (H) Proportion of CD45+F4/80Ly-6GCD11c+MHC-II+CD103+ DCs expressing CD80, CCR7 or PD-L1 in MOC2 tumors harvested 9 days post-RT with RT +/–anti-CD25 treatment (n=4 mice/group, unpaired two-tailed t-test). (I) Proportion of CD45+F4/80Ly-6GCD11c+MHC-II+CD103+ DCs expressing CD80, CCR7 or PD-L1 in MOC2 tumor draining lymph nodes harvested 9 days post-RT with RT +/–anti-CD25 treatment (n=5 mice/group). DCs, dendritic cells; LNs, lymph nodes; RT, radiation therapy.
Figure 3
Figure 3
Adding DC agonists to tumors resistant to Treg targeted therapy with RT reduces growth (A) histograms depicting CD137 expression in CD45+CD3+CD4+CD8+ T cells, CD45+CD3+CD4+Foxp3 T cells and CD45+CD3+CD4+Foxp3- Tregs and CD137L expression in CD45+CD11b cells, CD45+CD11b+ cells, CD45+F4/80Ly-6GCD11c+ cells and CD45+F4/80Ly-6GCD11c+MHC-II+ cells in MOC2 tumors harvested 9 days post-RT with only RT alone treatment. Each population is normalized to the same number of cells per histogram. (B) Experimental procedure for RT, anti-CD25 and anti-CD137 treatment in the MOC2 tumor model. (C) Tumor growth curves for mice treated with RT or RT+anti-CD25+anti-CD137 in the MOC2 tumor model and replicate values for all mice alive on day 27 postimplantation (n=8 mice/group, p=0.0013, unpaired two-tailed t-test). (D) Tumor growth curves for mice treated with RT, RT+anti-CD25 or RT+anti-CD137 in the MOC2 tumor model (n=8 mice/group). (E) Experimental procedure for hypofractionated RT, anti-CD25 and anti-CD137 treatment in the MOC2 tumor model. (F) Tumor growth curves for mice treated with hypofractionated RT+anti-CD25+anti-CD137 in the MOC2 tumor model in C57BL/6 mice (n=10 mice). DC, dendritic cell; RT, radiation therapy.
Figure 4
Figure 4
Adding DC agonists reprograms Tregs, induces a CD4 and CD8 T cell -specific immunity, and enhances DC antigen presenting function in the draining lymph nodes (DLN). (A) Proportion of CD45+CD3+CD4+Foxp3+ Tregs in MOC2 tumors harvested 9 days post-RT with RT, anti-CD25 and/or anti-CD137 treatment (n=5 mice/group, one-way ANOVA with Tukey test). (B) Proportion of CD45+CD3+CD4+Foxp3+ Tregs in MOC2 tumor DLNs harvested 9 days post-RT with RT, anti-CD25, and/or anti-CD137 treatment (n=5 mice/group, one-way ANOVA with Tukey test). (C) Proportion of CD45+CD3+CD4+Foxp3+ Tregs expressing CD69, CTLA4, TIGIT, NRP-1, CD137, IFNγ, TNFα, granzyme B, PI3K, or pAkt in MOC2 tumors harvested 9 days post-RT with RT, anti-CD25 and/or anti-CD137 treatment (n=5 mice/group, one-way ANOVA with Tukey test). (D) Proportion of CD45+CD3+CD4+Foxp3+ Tregs expressing CD69, IFNγ or TNFα in MOC2 tumor DLNs harvested 9 days post-RT with RT, anti-CD25 and/or anti-CD137 treatment (n=5 mice/group, one-way ANOVA with Tukey test). (E) Concentration of IFNγ from serum harvested 9 days post-RT with RT, anti-CD25, and/or anti-CD137 treatment (n=4 mice/group, one-way ANOVA with Tukey test). (F) Concentration of TNFα from serum harvested 9 days post-RT with RT, anti-CD25 and/or anti-CD137 treatment (n=4 mice/group, one-way ANOVA with Tukey test). (G) Proportion of CD45+CD3+CD4+Foxp3 T cells expressing IFNγ or TNFα in MOC2 tumor DLNs harvested 9 days post-RT with RT, anti-CD25, and/or anti-CD137 treatment (n=5 mice/group, one-way ANOVA with Tukey test). (H) Proportion of CD45+CD3+CD8+ T cells expressing IFNγ or TNFα in MOC2 tumor DLNs harvested 9 days post-RT with RT, anti-CD25, and/or anti-CD137 treatment (n=5 mice/group, one-way ANOVA with Tukey test). (I) Proportion of CD45+CD3+CD4+Foxp3 T cells and CD45+CD3+CD8+ T cells in MOC2 tumor DLNs harvested 9 days post-RT with RT, anti-CD25, and/or anti-CD137 treatment (n=5 mice/group, one-way ANOVA with Tukey test). (J) Mean fluorescence intensity of Tbet and Eomesodermin in CD45+CD3+CD4+Foxp3+ Tregs in MOC2 tumors harvested 9 days post-RT with RT, anti-CD25 and/or anti-CD137 treatment (n=5 mice/group, one-way ANOVA with Tukey test). (K) Proportion of CD45+CD3+CD4+Foxp3 T cells and CD45+CD3+CD8+ T cells in MOC2 tumors harvested 9 days post-RT with RT, anti-CD25 and/or anti-CD137 treatment (n=5 mice/group, one-way ANOVA with Tukey test). (L) Proportion of CD45+CD3+CD4+Foxp3 T cells expressing CD137 in MOC2 tumors harvested 9 days post-RT with RT, anti-CD25, and/or anti-CD137 treatment (n=5 mice/group, one-way ANOVA with Tukey test). (M) Proportion of CD45+CD3+CD8+ T cells expressing CD137 in MOC2 tumors harvested 9 days post-RT with RT, anti-CD25 and/or anti-CD137 treatment (n=5 mice/group, one-way ANOVA with Tukey test). (N) Proportion of CD45+F4/80Ly-6GCD11c+MHC-II+ DCs in MOC2 tumor DLNs harvested 9 days post-RT with RT, anti-CD25, and/or anti-CD137 treatment (n=5 mice/group, one-way ANOVA with Tukey test). (O) Proportion of CD45+F4/80Ly-6GCD11c+MHC-II+CD103+ DCs expressing CD80, CCR7, or PD-L1 in MOC2 tumor DLNs harvested 9 days post-RT with RT, anti-CD25, and/or anti-CD137 treatment (n=5 mice/group, one-way ANOVA with Tukey test). ANOVA, analysis of variance; DC, dendritic cell; IFNγ, interferon γ, RT, radiation therapy; TNF, tumor necrosis factor; Treg, regulatory T cell; pAKT, phosphorylated Protein kinase B.
Figure 5
Figure 5
Tumor growth delay effect with the addition of DC agonist is dependent on CD8 T cells, T cells’ ability to egress from the lymph nodes, but is not enhanced with the addition of TLR agonist (A) experimental procedure for RT, anti-CD25, anti-CD137, anti-CD4, and anti-CD8 treatment in the MOC2 tumor model. (B) Tumor growth curves for mice treated with RT+anti-CD25+anti-CD137 alone or with anti-CD4, anti-CD8 or anti-CD4+anti-CD8 in the MOC2 tumor model and replicate values for all mice alive on day 21 postimplantation (n=13 mice/group on day 0, one-way ANOVA with Tukey test). (C) Experimental procedure for RT, anti-CD25, anti-CD137, anti-PD-L1, and FTY720 treatment in the MOC2 tumor model. (D) Tumor growth curves for mice treated with RT, RT+anti-CD25, RT+anti-CD25+anti-CD137, RT+anti-CD25+anti-CD137+anti-PD-L1 or RT+anti-CD25+anti-CD137+anti-PD-L1+FTY720 in the MOC2 tumor model and replicate values for all mice alive on day 34 post-implantation (n=8 mice/group on day 0, one-way ANOVA with Tukey test). (E) Experimental procedure for RT, anti-CD25, anti-CD137, and Poly:IC treatment in the MOC2 tumor model. (F) Tumor growth curves for mice treated with RT, RT+anti-CD25+anti-CD137, or RT+anti-CD25+anti-CD137+Poly:IC in the MOC2 tumor model. Tumor volumes bar chart for all mice alive on day 14 post-implantation (n=9 mice/group on day 0, one-way ANOVA with Tukey test). ANOVA, analysis of variance; RT, radiation therapy; TLR, toll-like receptor.
Figure 6
Figure 6
Both DCs and Tregs are required for functional DC agonism with anti-CD137 (A) experimental procedure for RT, anti-CD25 and anti-CD137 treatment in the MOC2 tumor model using BATF3–/– mice and wildtype controls. (B) Tumor growth curves for mice treated with RT +anti-CD25+anti-CD137 in BATF3–/– mice versus wildtype controls in the MOC2 tumor model and replicate values for all mice alive on day 13 postimplantation (n=9 mice/group on day 0, one-way ANOVA with Tukey test). (C) Proportion of CD45+CD3+CD4+Foxp3 T cells or CD45+CD3+CD8+ T cells in MOC2 tumors from BATF3–/– mice versus wild-type controls 15 days post-RT with RT +anti-CD25+anti-CD137 treatment (n=4 mice/group, two-tailed unpaired t-test). (D) Proportion of CD45+CD3+CD4+Foxp3+ Tregs in MOC2 tumors from BATF3–/– mice versus wild-type controls 15 days post-RT with RT +anti-CD25+anti-CD137 treatment (n=4 mice/group, two-tailed unpaired t-test). (E) Proportion of CD45+CD3+CD4+Foxp3+ Tregs in MOC2 tumors from BATF3–/– mice versus wild-type controls expressing NRP-1, CD137, IFNγ, TNFα, PI3K or pAkt 15 days post-RT with RT +anti-CD25+anti-CD137 treatment (n=4 mice/group, two-tailed unpaired t-test). (F) Experimental procedure for RT, anti-CD25, anti-CD137 and dT treatment in the MOC2 tumor model using DEREG mice. (G) Tumor growth curves for mice treated with RT, DT, RT +DT, or RT +DT + anti-CD137 versus untreated controls in the MOC2 tumor model in DEREG mice and replicate values for all mice alive on day 22 postimplantation. (n=8 mice/group on day 0, one-way ANOVA with Tukey test). (H) Proportion of CD45+CD3+CD4+Foxp3 T cells or CD45+CD3+CD8+ T cells in MOC2 tumors from DEREG mice harvested 20 days post-RT with RT (n=5), dT (n=4), RT +DT (n=5) or RT +DT + anti-CD137 (n=4) treatments vs untreated controls (n=5). (I) Proportion of CD45+CD11c+MHC-II+ DCs in MOC2 tumors or tumor draining lymph nodes (LN) from DEREG mice harvested 8 days post-RT with RT +anti-CD25+anti-CD137 or RT +DT + anti-CD137 treatment (n=6 mice/group, two-tailed unpaired t-test). (J) Proportion of CD45+CD11c+MHC-II+CD103+ DCs in MOC2 tumors or tumor draining LNs from DEREG mice harvested 8 days post-RT with RT +anti-CD25+anti-CD137 or RT +DT + anti-CD137 treatment (n=6 mice/group, two-tailed unpaired t-test). (K) Proportion of CD45+CD11c+MHC-II+CD103+CD80+ DCs in MOC2 tumors or tumor draining LNs from DEREG mice harvested 8 days post-RT with RT +anti-CD25+anti-CD137 or RT +DT + anti-CD137 treatment (n=6 mice/group, two-tailed unpaired T test). ANOVA, analysis of variance; DC, dendritic cell; IFNγ, interferon γ; ns, not significant; RT, radiation therapy; TNFα, tumor necrosis factor α; Treg, regulatory T cell.
Figure 7
Figure 7
RT +anti-CD25+anti-CD137 is sufficient to reprogram Tregs into cytokine-producing cytolytic effectors. (A) Experimental procedure for adoptive transfer by tail vein injection of GFP+ Tregs from non-tumor-bearing DEREG mice into MOC2 tumor-bearing RAG1–/– mice followed by RT+anti-CD25+anti-CD137 treatment and harvesting of tumors for flow cytometric analysis. (B) Proportion of CD45+CD4+Foxp3+GFP+ Tregs expressing TNFα, IFNγ, or Perforin in MOC2 tumors from RAG1–/– mice following adoptive transfer of Tregs from DEREG mice and treatment of RT+anti-CD25+anti-CD137 harvested 9 days post-RT versus RT alone controls (n=7 mice/group, two-tailed unpaired T test). (C) Mean fluorescence intensity of Eomesodermin in CD45+CD4+Foxp3+GFP+ Tregs in MOC2 tumors from RAG1–/– mice following adoptive transfer of Tregs from DEREG mice and treatment of RT+anti-CD25+anti-CD137 harvested 9 days post-RT versus RT alone controls (n=7 mice/group, two-tailed unpaired t test). (D) Experimental procedure for Treg cytolytic assay using GFP+ Tregs harvested from tumor-bearing DEREG mice harvested 8 days post-RT with 10 Gy and MOC2 cells irradiated with 10 Gy 72 hours prior and stained with cell Tracker red. Cells were cultured in conditioned media from irradiated MOC2 cells with an 2:1 effector to target ratio for 4 hours at 37°C prior to detection of live cells by live/dead aqua viability dye. (E) Proportion of live MOC2 cells after incubation with Tregs harvested from tumor-bearing DEREG mice treated with IL-2 and anti-CD137 (n=4) compared with IL-2 and matching isotype control antibody (n=3). Each point represents technical replicates (p=0.0548, two-tailed unpaired t test). IFNγ, interferon γ; IL-2, interleukin 2; RT, radiation therapy; TNFα, tumor necrosis factor α; Treg, regulatory T cell.

Similar articles

Cited by

References

    1. Mandal R, Şenbabaoğlu Y, Desrichard A, et al. . The head and neck cancer immune landscape and its immunotherapeutic implications. JCI Insight 2016;1:e89829. 10.1172/jci.insight.89829 - DOI - PMC - PubMed
    1. Diéras VC, Han HS, Kaufman B, et al. . Phase III study of veliparib with carboplatin and paclitaxel in HER2-negative advanced/metastatic gBRCA-associated breast cancer. Annals of Oncology 2019;30:v857–8. 10.1093/annonc/mdz394.008 - DOI
    1. Psyrri A, 910O – Cohen EE, Ferris RL . Primary results of the phase III JAVELIN head & neck 100 trial: Avelumab plus chemoradiotherapy (CRT) followed by avelumab maintenance vs CRT in patients with locally advanced squamous cell carcinoma of the head and neck (LA SCCHN). ESMO Virtual Congress 2020.
    1. Barker HE, Paget JTE, Khan AA, et al. . The tumour microenvironment after radiotherapy: mechanisms of resistance and recurrence. Nat Rev Cancer 2015;15:409–25. 10.1038/nrc3958 - DOI - PMC - PubMed
    1. Oweida A, Lennon S, Calame D, et al. . Ionizing radiation sensitizes tumors to PD-L1 immune checkpoint blockade in orthotopic murine head and neck squamous cell carcinoma. Oncoimmunology 2017;6:e1356153. 10.1080/2162402X.2017.1356153 - DOI - PMC - PubMed

Publication types

MeSH terms

Substances