. 2021 Apr;9(4):e002137.
doi: 10.1136/jitc-2020-002137.

Amino acids and RagD potentiate mTORC1 activation in CD8+ T cells to confer antitumor immunity

Affiliations

Amino acids and RagD potentiate mTORC1 activation in CD8+ T cells to confer antitumor immunity

Yiwen Zhang et al. J Immunother Cancer. 2021 Apr.

Abstract

Background: In the tumor microenvironment, tumor cells are able to suppress antitumor immunity by competing for essential nutrients, including amino acids. However, whether amino acid depletion modulates the activity of CD8+ tumor-infiltrating lymphocytes (TILs) is unclear.

Method: In this study, we evaluated the roles of amino acids and the Rag complex in regulating mammalian target of rapamycin complex 1 (mTORC1) signaling in CD8+ TILs.

Results: We discovered that the Rag complex, particularly RagD, was crucial for CD8+ T-cell antitumor immunity. RagD expression was positively correlated with the antitumor response of CD8+ TILs in both murine syngeneic tumor xenografts and clinical human colon cancer samples. On RagD deficiency, CD8+ T cells were rendered more dysfunctional, as demonstrated by attenuation of mTORC1 signaling and reductions in proliferation and cytokine secretion. Amino acids maintained RagD-mediated mTORC1 translocation to the lysosome, thereby achieving maximal mTORC1 activity in CD8+ T cells. Moreover, the limited T-cell access to leucine (LEU), overshadowed by tumor cell amino acid consumption, led to impaired RagD-dependent mTORC1 activity. Finally, combined with antiprogrammed cell death protein 1 antibody, LEU supplementation improved T-cell immunity in MC38 tumor-bearing mice in vivo.

Conclusion: Our results revealed that robust signaling of amino acids by RagD and downstream mTORC1 signaling were crucial for T-cell receptor-initiated antitumor immunity. The characterization the role of RagD and LEU in nutrient mTORC1 signaling in TILs might suggest potential therapeutic strategies based on the manipulation of RagD and its upstream pathway.

Keywords: CD8-positive T-lymphocytes; lymphocyte activation; lymphocytes; metabolic networks and pathways; tumor microenvironment; tumor-infiltrating.


Conflict of interest statement

Competing interests: None declared.

Figures

Figure 1
Figure 1
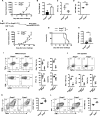
RagD are required for CD8+ tumor-infiltrating lymphocyte (TIL) functions in tumor microenvironment (TME). (A) OT-I CD8+ T cells were sorted and activated with plate bounded anti-CD3 and anti-CD28, followed by gene editing with short hairpin RNA (shRNA) targeting Rraga, Rragb, Rragc and Rragd. CD8+ T cells were transferred into CD45.1 mice bearing B16-OVA tumor. The intracellular cytokine staining for interferon (IFN)-γ on CD8+ TILs, on restimulation of phorbol myristate acetate (PMA) and ionomycin for 4 hours. The quantification of IFN-γ+CD8+ TILs (n=3). (B–C) Human CD8+ TILs isolated from patient’s tumor and para-tumor with colon cancer (n=7) and liver cancer (n=4). The RagD mean fluorescence intensity (MFI) was analyzed by flow cytometry. (D) Flow cytometry analysis for the correlation between RagD expression with CD39+CD103+ or CD39-CD103- on CD8+ TILs from the patient with colon cancer (n=7). (E–F) Flow cytometry analysis for the correlation between frequencies of IFN-γ+ with RagD expression in CD8+ TILs from the patient with colon cancer (n=4). (F)The intracellular cytokine staining for IFN-γ on CD8+ TILs, on restimulation of PMA and ionomycin for 4 hours. Representative flow cytometry plots of RagD expression (E), IFN-γ expression (F), RagDlow (blue), RagDhigh (red), unstimulated control (gray). (G) Flow cytometry analysis for the correlation between RagD expression with KLRG1+CD39+ or TIM3+CD39+ in H-2Db Adpgk Neoepitope Tetramer+ CD8+ TILs from mice MC38 tumor (n=5). Data are shown as mean±SD (error bars). Student’s t-test was used. *P<0.05; **p<0.01; ***p<0.001.
Figure 2
Figure 2
RagD-deficient CD8+ T cells show dysfunctional phenotypes. (A–D) MC38 mice tumor model on Rragd+/+Cd4cre (Rragd+/+) or Rragdfl/flCd4cre (Rragd−/−) mice. MC38 tumor growth kinetics (n=5) (A), tumor weights at end point (n=5) (B), quantification of interferon (IFN)-γ+ in CD8+ tumor-infiltrating lymphocytes (TILs) on restimulation of Adpgk peptides (n=3) (C), quantification of PD1+TIM3+ in CD8+ TILs (n=3) (D). (E–L) Rragdfl/flCd4cre OT-I (Rragd−/−) CD8+ T cells or Rragd+/+Cd4cre OT-I (Rragd+/+) CD8+ T cells were transferred into Rag1−/− mice bearing MC38-OVA tumor. (E) Graphic of tumor model. (F) MC38-OVA tumor growth kinetics (n=10). (G) Mice survival (n=10). (H) Tumor weights of MC38-OVA tumor at 14 days after adoptive transfer (n=15). (I–J) At 14 days after adoptive transfer, intracellular cytokine staining for IFN-γ, tumor necrosis factor (TNF)-α and granzyme B (GZMB) on restimulation of phorbol myristate acetate (PMA) and ionomycin for 4 hours, or OVA257-264 for 6 hours (n=5). (K) At 14 days after adoptive transfer, quantification of CD39+TIM3+ in CD8+ TILs (n=7). (L) At 14 days after adoptive transfer, quantification of PD1+TIM3+ in CD8+ TILs (n=4). Data are shown as mean±SD (error bars) (B–D, G–L). Data are shown as mean±SEM (error bars) (A, F). Student’s t-test was used. **P<0.01; ***p<0.001.
Figure 3
Figure 3
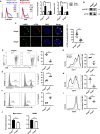
RagD deficiency inhibits the mammalian target of rapamycin complex 1 (mTORC1) activity of CD8+ T cells. (A–B) CD8+ tumor-infiltrating lymphocytes (TILs) from Rragd+/+Cd4cre (Rragd+/+) or Rragdfl/flCd4cre (Rragd−/−) mice bearing MC38 tumor. Gene set enrichment analysis (GSEA) identified upregulated and downregulated Hallmark pathways. (C) Rragdfl/flCd4cre OT-I (Rragd−/−) CD8+ T cells or Rragd+/+Cd4cre OT-I (Rragd+/+) CD8+ T cells were transferred into Rag1−/− mice bearing MC38-OVA tumor. Expression of p-S6 or p-4E-BP1 on CD8+ TILs were stained and analyzed by flow cytometry (n=7). (D–J) Rragdfl/flCd4cre OT-I (Rragd−/−) CD8+ T cells or Rragd+/+Cd4cre OT-I CD45.1.2 (Rragd+/+) CD8+ T cells were mixed and co-transferred at 1:1 ratio into the same Rag1−/− host bearing MC38-OVA tumor. (D) Graphic of tumor model. (E) The proportion of CD45.1 and CD45.1.2 cells in CD8+ T cells pretransfer. (F–G) Mice were analyzed at 14 days after adoptive transfer, the quantification of relative of CD45.1 and CD45.1.2 percentages in CD8+ T cells in the TILs (n=15) and spleen (n=5). (H) The mean fluorescence intensity (MFI) of CD69 on CD8+ TILs (n=5). (I) The quantification of frequencies and MFI of Ki67+ cells in CD8+ TILs (n=5). (J) The quantification of AnnexinV+ cells in CD8+ TILs (n=5). Data are shown as mean±SD (error bars). Student’s t-test was used. *P<0.05; **p<0.01; ***p<0.001.
Figure 4
Figure 4
RagD deficiency restricted T-cell receptor (TCR)-induced mammalian target of rapamycin complex 1 (mTORC1) activity in CD8+ T cells. (A) Naïve CD8+ T cells from Rragdfl/flCd4cre (Rragd−/−) or Rragd+/+Cd4cre (Rragd+/+) spleen, stimulated with plate bounded anti-CD3 and anti-CD28 crosslinking. The expression of p-S6 or p-4E-BP1 were analyzed by flow cytometry, normalized to 0 min (n=5). (B) Immunoblot analysis of p-4E-BP1 levels in Rragdfl/flCd4cre (Rragd−/−) or Rragd+/+Cd4cre (Rragd+/+) CD8+ T cells stimulated with plate bounded anti-CD3 and anti-CD28 overnight (n=5). (C) Immunofluorescence staining of mTOR and lysosomal-associated membrane protein 1 (LAMP1) in naïve CD8+ T cells from Rragdfl/flCd4cre (Rragd−/−) or Rragd+/+Cd4cre (Rragd+/+) spleen stimulated with plate bounded anti-CD3 and anti-CD28 overnight (n=5). Scale bars, 5 μm. (D–J) Naïve CD8+ T cells from Rragdfl/flCd4cre (Rragd−/−) or Rragd+/+Cd4cre (Rragd+/+) spleen were sorted and stimulated with plate bounded anti-CD3 and anti-CD28 for 48 hours (n=5). (D) The quantification of Ki67+ cells in CD8+ T cells. (E) The quantification of AnnexinV+ cells in CD8+ T cells. (F) The quantification of Caspase3+ cells in CD8+ T cells. (G–I) The mean fluorescence intensity (MFI) of CD71, CD44 and CD69 on CD8+ T cells. (J) Quantification of MitoTracker and tetramethylrhodamine (TMRM) in CD8+ T cells. Data are shown as mean±SD (error bars). Student’s t-test was used. *P<0.05; **p<0.01; ***p<0.001.
Figure 5
Figure 5
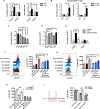
Tumor cells limited T-cell access to leucine (LEU) and impaired mammalian target of rapamycin complex 1 (mTORC1) activity. (A–B) Expression of p-S6 or p-4E-BP1 in naïve CD8+ T cells from Rragdfl/flCd4cre (Rragd−/−) or Rragd+/+Cd4cre (Rragd+/+) spleen (A), and healthy human donor (B), pretreated with or without amino acids, followed by anti-CD3 and anti-CD28 crosslinking in the presence or absence of amino acids (n=5). (C) CD8+ tumor-infiltrating lymphocytes (TILs) from MC38 tumor were stimulated with anti-CD3 and anti-CD28 in amino acid-deficient (AA−), amino acid-sufficient (AA+) or different single amino acid-deficient medium in vitro, p-4E-BP1 on CD8+ TILs was stained and analyzed by flow cytometry (n=5). (D) Naïve CD8+ T cells rested in AA− for 90 min and then stimulated in LEU, arginine (ARG) or alanine (ALA) medium for 30 min. p-4E-BP1 on CD8+ T cells was stained and analyzed by flow cytometry (n=5). (E) Naïve CD8+ T cells rested in AA− for 90 min and then stimulated in LEU medium for 30 min, in the presence or absence of RagD inhibitor Bi-Li-0186 (10 μM). p-4E-BP1 on CD8+ T cells was stained and analyzed by flow cytometry (n=5). (F–G) Effect of tumor cell culture supernatants on mTORC1 activity of CD8+ T cells. CD8+ T cells were rested with supernatants (sup) from cultured MC38 (F) or B16F10 (G) cells with varying concentrations of LEU, AA− or completed amino acid-sufficient fresh medium for 90 min and then stimulated with plate-bounded anti-CD3 and anti-CD28 for 30 min under the indicated conditions. p-4E-BP1 on CD8+ T cells was stained and analyzed by flow cytometry (n=5). (H) CD8+ T cells from Rragdfl/flCd4cre (Rragd−/−) or Rragd+/+Cd4cre (Rragd+/+) spleen were rested with sup from cultured MC38 with or without LEU (100 μM) for 90 min, followed by anti-CD3 and anti-CD28 stimulation for 30 min under the indicated conditions. p-4E-BP1 on CD8+ T cells were stained and analyzed by flow cytometry (n=3). (I) MC38 tumor cells and CD8+ T cells were cultured at different ratios for 48 hours in a Transwell system with 20 μM or 100 μM LEU. CD8+ T cells stimulated with anti-CD3 and anti-CD28 for 30 min, p-4E-BP1 on CD8+ T cells was stained and analyzed by flow cytometry (n=3). Data are shown as mean±SD (error bars). Student’s t-test was used. *P<0.05; **p<0.01; ***p<0.001.
Figure 6
Figure 6
Leucine (LEU) sustained CD8+ tumor-infiltrating lymphocytes (TILs) immunity in vivo. (A) The mean fluorescence intensity (MFI) of CD98 on tetramer+CD8+ T cells from TILs or spleen, or on tumor cells in wild-type (WT) mice bearing MC38 tumor (n=6). (B) Human CD8+ TILs isolated from tumor and para-tumor with patient with colon cancer. The CD98 MFI was analyzed by flow cytometry (n=4). (C) Slc3a2 transcripts in tumors and paired adjacent normal tissue samples for several types of tumor from The Cancer Genome Atlas (TCGA). BLCA, bladder urothelial carcinoma; COAD, colon adenocarcinoma; KICH, kidney chromophobe; LUAD, lung adenocarcinoma; LUSC, lung squamous cell carcinoma. (D) Effect of supernatants (sup) from short hairpin RNA (shRNA)-Slc3a2-treated MC38 on mammalian target of rapamycin complex 1 (mTORC1) activity of CD8+ T cells. CD8+ T cells from Rragdfl/flCd4cre (Rragd−/−) or Rragd+/+Cd4cre (Rragd+/+) spleen were rested with sup for 90 min, followed by anti-CD3 and anti-CD28 stimulation for 30 min under the indicated conditions. p-4E-BP1 were stained and analyzed by flow cytometry (n=3). (E) Quantification of CD44 and CD62L expression on splenic CD8+ T cells of Rragdfl/flCd4cre (Rragd−/−) or Rragd+/+Cd4cre (Rragd+/+) fed complete L-amino acids (control), or leucine-deficient (LEU-diet) (n=3). (F) OT-I CD8+ T cells were transferred into the Rag1−/− host bearing MC38-OVA tumor, LEU (70 mg/kg) or PBS was given by intratumor. MC38-OVA tumor growth kinetics (n=6). (G–I) Effect of combination of LEU (70 mg/kg) and antiprogrammed cell death protein 1 (αPD-1) treatment on WT mice bearing MC38 tumor. (G) MC38 tumor growth kinetics (n=6). (H) Intracellular cytokine staining for interferon (IFN)-γ and tumor necrosis factor (TNF)-α, on restimulation of phorbol myristate acetate (PMA) and ionomycin for 4 hours, or Adpgk peptides for 6 hours. The quantification of TNF-α+CD8+ TILs, IFN-γ+CD8+ TILs. Data are shown as mean±SD (error bars) (A–E, H–I). Data are shown as mean±SEM (error bars) (F, G). Representative plots, Student’s t-test were used. *P<0.05; **p<0.01; ***p<0.001.

Similar articles

Cited by

References

    1. Zou W, Wolchok JD, Chen L. Pd-L1 (B7-H1) and PD-1 pathway blockade for cancer therapy: mechanisms, response biomarkers, and combinations. Sci Transl Med 2016;8:rv324. 10.1126/scitranslmed.aad7118 - DOI - PMC - PubMed
    1. He X, Xu C. Immune checkpoint signaling and cancer immunotherapy. Cell Res 2020;30:660–9. 10.1038/s41422-020-0343-4 - DOI - PMC - PubMed
    1. McLane LM, Abdel-Hakeem MS, Wherry EJ. CD8 T cell exhaustion during chronic viral infection and cancer. Annu Rev Immunol 2019;37:457–95. 10.1146/annurev-immunol-041015-055318 - DOI - PubMed
    1. Hashimoto M, Kamphorst AO, Im SJ, et al. . CD8 T cell exhaustion in chronic infection and cancer: opportunities for interventions. Annu Rev Med 2018;69:301–18. 10.1146/annurev-med-012017-043208 - DOI - PubMed
    1. Wherry EJ, Kurachi M. Molecular and cellular insights into T cell exhaustion. Nat Rev Immunol 2015;15:486–99. 10.1038/nri3862 - DOI - PMC - PubMed

Publication types

MeSH terms