. 2021 Apr 21;6(2):e00224-21.
doi: 10.1128/mSphere.00224-21.

Single-Dilution COVID-19 Antibody Test with Qualitative and Quantitative Readouts

Affiliations

Single-Dilution COVID-19 Antibody Test with Qualitative and Quantitative Readouts

Robert H Bortz 3rd et al. mSphere. .

Abstract

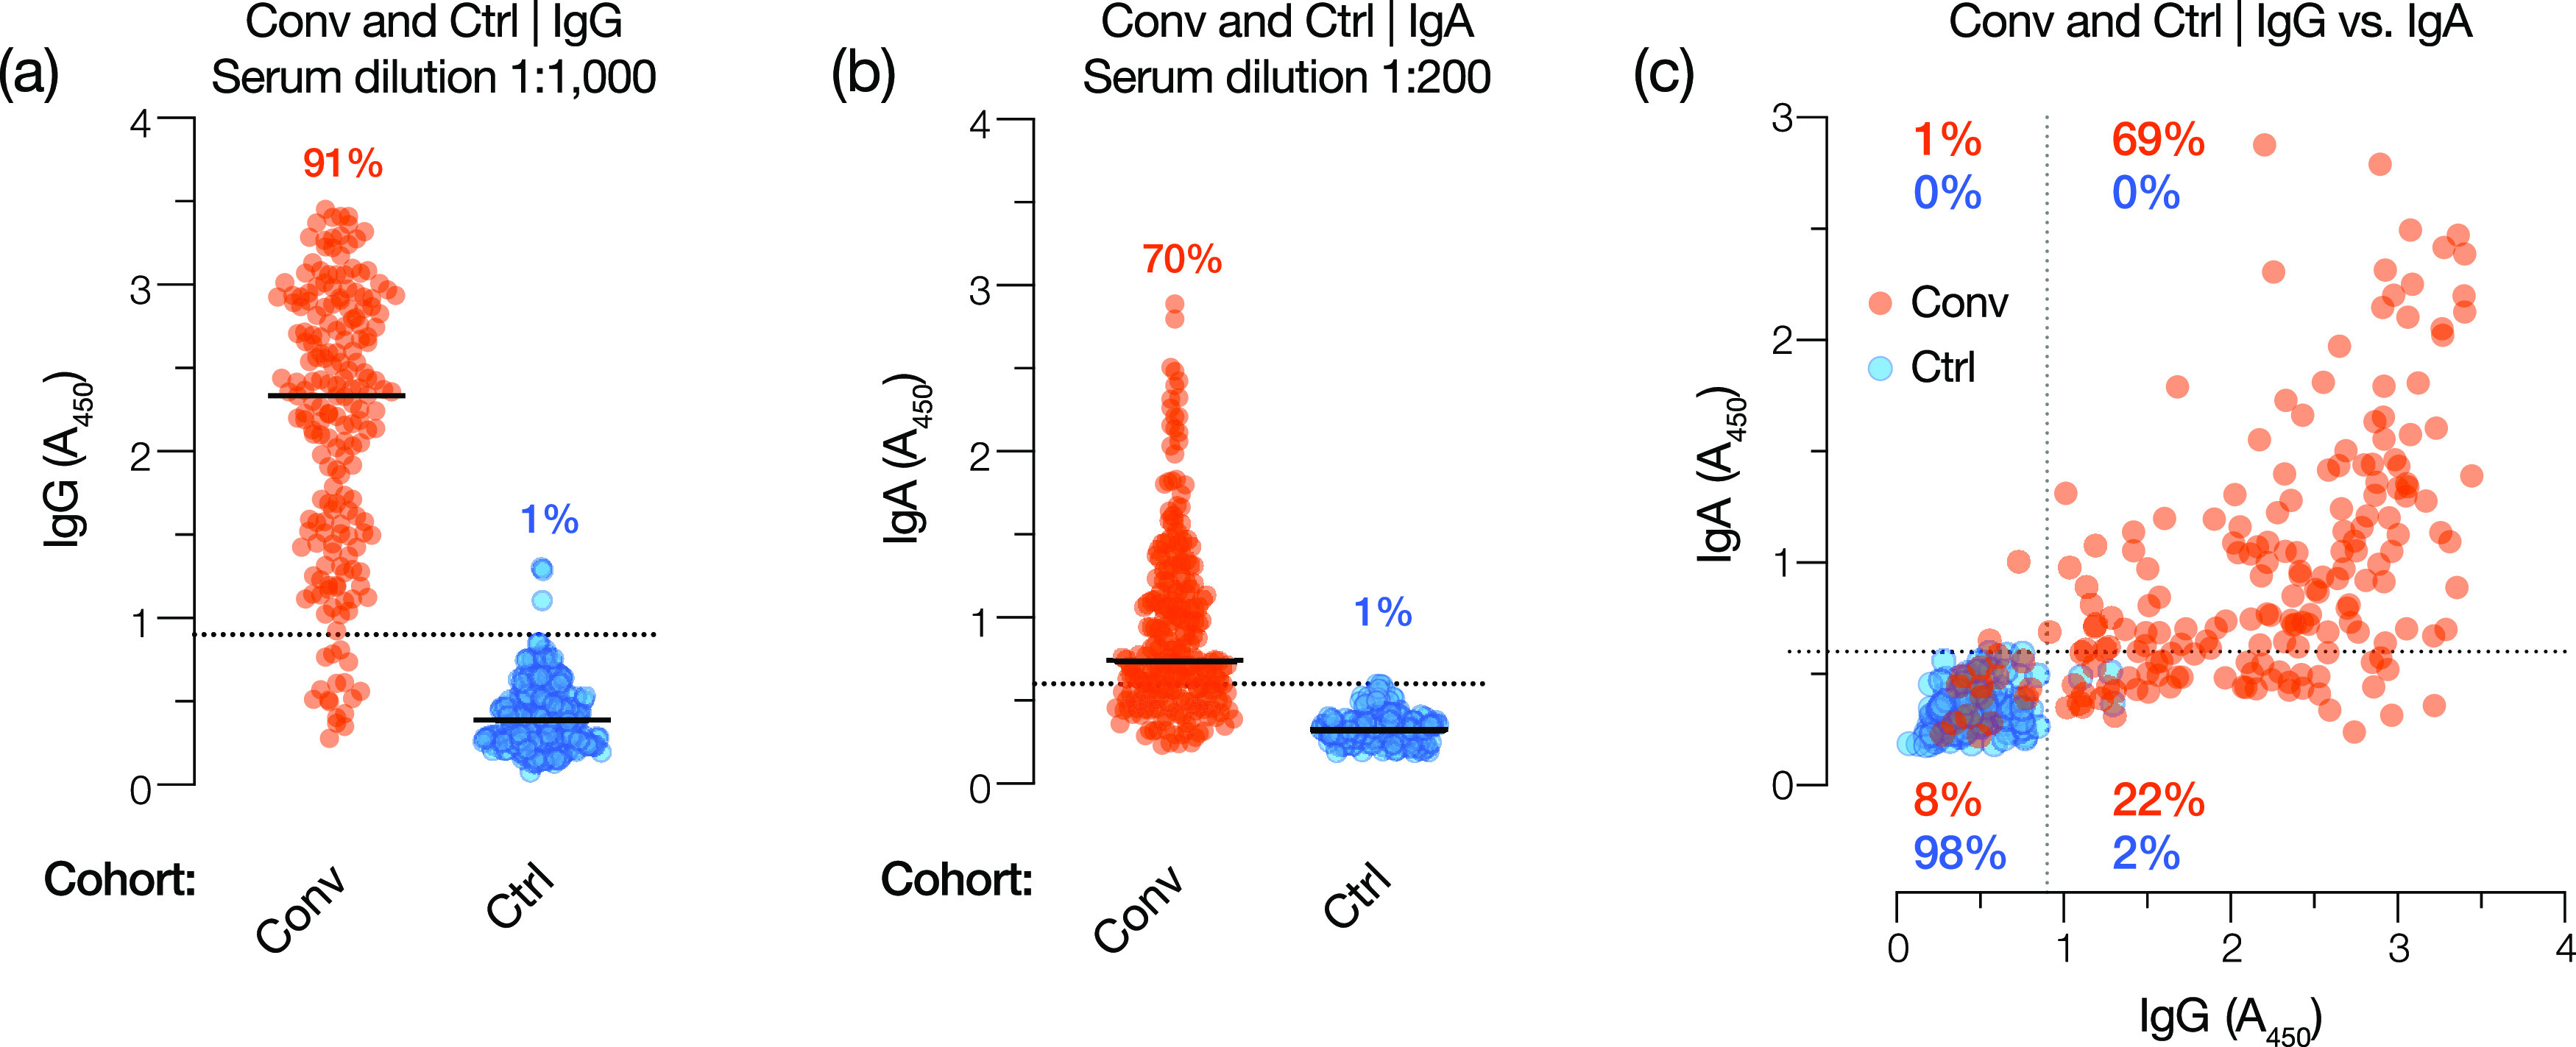
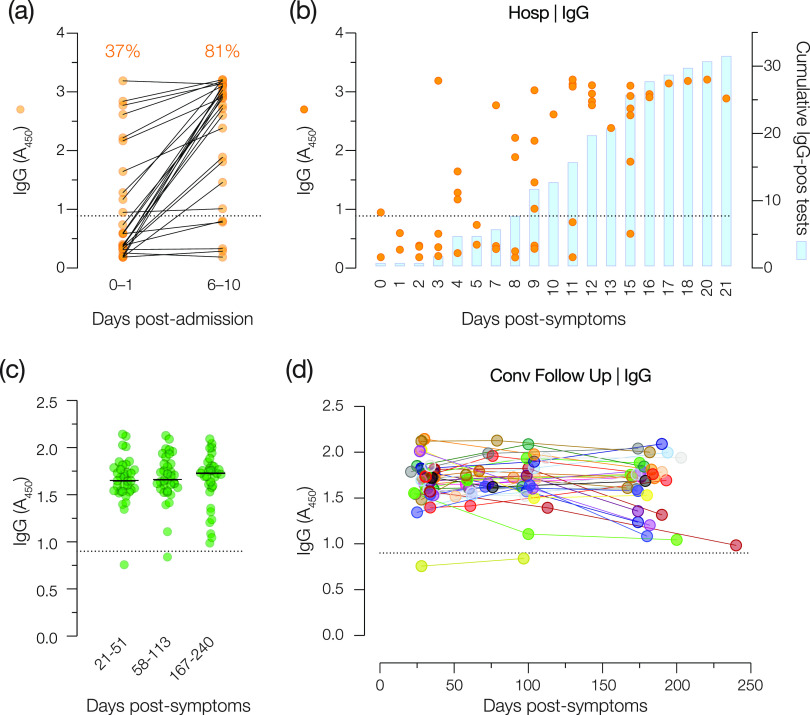
The coronavirus disease 2019 (COVID-19) global pandemic caused by severe acute respiratory syndrome coronavirus 2 (SARS-CoV-2) continues to place an immense burden on societies and health care systems. A key component of COVID-19 control efforts is serological testing to determine the community prevalence of SARS-CoV-2 exposure and quantify individual immune responses to prior SARS-CoV-2 infection or vaccination. Here, we describe a laboratory-developed antibody test that uses readily available research-grade reagents to detect SARS-CoV-2 exposure in patient blood samples with high sensitivity and specificity. We further show that this sensitive test affords the estimation of viral spike-specific IgG titers from a single sample measurement, thereby providing a simple and scalable method to measure the strength of an individual's immune response. The accuracy, adaptability, and cost-effectiveness of this test make it an excellent option for clinical deployment in the ongoing COVID-19 pandemic.IMPORTANCE Serological surveillance has become an important public health tool during the COVID-19 pandemic. Detection of protective antibodies and seroconversion after SARS-CoV-2 infection or vaccination can help guide patient care plans and public health policies. Serology tests can detect antibodies against past infections; consequently, they can help overcome the shortcomings of molecular tests, which can detect only active infections. This is important, especially when considering that many COVID-19 patients are asymptomatic. In this study, we describe an enzyme-linked immunosorbent assay (ELISA)-based qualitative and quantitative serology test developed to measure IgG and IgA antibodies against the SARS-CoV-2 spike glycoprotein. The test can be deployed using commonly available laboratory reagents and equipment and displays high specificity and sensitivity. Furthermore, we demonstrate that IgG titers in patient samples can be estimated from a single measurement, enabling the assay's use in high-throughput clinical environments.

Keywords: COVID-19; IgA; IgG; SARS-CoV-2; laboratory diagnostic test; quantitative test; serology; spike protein.


Figures

FIG 1
FIG 1
ELISA to detect and measure SARS-CoV-2 spike-specific IgG and IgA in COVID-19 convalescent-phase sera. Serially diluted convalescent-phase patient sera (colored circles) and a negative-control serum sample (gray diamonds and dotted lines) were added to recombinant SARS-CoV-2 spike protein-coated ELISA plates. (a and b) Captured IgG (a) and IgA (b) were detected using Ig class-specific secondary antibody-HRP conjugates. Absorbance (A450) values were fitted to a sigmoidal curve. (c and d) Samples were reanalyzed at three dilutions that best characterized the extent of the antibody reactivity for IgG (c) and IgA (d). Averages ± standard deviations (SD) are shown (n = 4 from two independent experiments). SD values smaller than the height of the symbols are not shown.
FIG 2
FIG 2
Spike-specific IgG reactivity in convalescent and control cohorts and receiver operating characteristic (ROC) analysis to select a single serum dilution and diagnostic threshold for the IgG test. (a and b) Spike-specific IgG responses at the indicated serum dilutions were determined for convalescent (Conv) (n = 197) and control (Ctrl) (n = 216) cohorts. (c) Interassay reproducibility of independent IgG assays at a serum dilution of 1:1,000 was assessed by linear regression analysis. (d) ROC analyses for the IgG test at serum dilutions of 1:100, 1:1,000, and 1:10,000 with the corresponding areas under the curve (AUC) for the 1:1,000 dilution. The filled circle indicates the point on the ROC curve that corresponds to the selected diagnostic threshold. (e) The sum of assay sensitivity and specificity for each candidate diagnostic threshold for a serum dilution of 1:1,000 was extracted from the ROC curve for the IgG test. The dotted line indicates the selected threshold (A450 of 0.90).
FIG 3
FIG 3
Spike-specific IgA reactivity in convalescent and control cohorts and ROC analysis to select a single serum dilution and diagnostic threshold for the IgA test. (a and b) Spike-specific IgA responses at the indicated serum dilutions were determined for convalescent (Conv) (n = 197) and control (Ctrl) (n = 216) cohorts. (c) Interassay reproducibility of independent IgA assays at a serum dilution of 1:200 was assessed by linear regression analysis. (d) ROC analyses for the IgA test at serum dilutions of 1:40, 1:200, and 1:1,000 with the corresponding AUCs for the 1:200 dilution. The filled circle indicates the point on the ROC curve that corresponds to the selected diagnostic threshold. (e) The sum of assay sensitivity and specificity for each candidate diagnostic threshold for a serum dilution of 1:200 was extracted from the ROC curve for the IgG test. The dotted line indicates the selected threshold (A450 of 0.60).
FIG 4
FIG 4
IgG and IgA test performance in Conv and Ctrl cohorts using the selected serum dilution and diagnostic threshold. (a and b) Spike-specific IgG and IgA reactivity for Conv (orange circles) and Ctrl (blue circles) cohorts at the selected test dilutions (1:1,000 and 1:200 serum dilutions, respectively). Diagnostic thresholds for IgG and IgA tests are shown as dotted lines (A450 values of 0.90 and 0.60, respectively). Percentages reflect the proportions of positive samples in each cohort (A450 above the threshold). (c) Comparison of the IgG and IgA reactivities of each sample in the Conv and Ctrl cohorts. The respective diagnostic thresholds are indicated as dotted lines. Percentages reflect the proportions of Ctrl and Conv samples in each quadrant.
FIG 5
FIG 5
IgG test performance in an evaluation cohort. IgG reactivities in serum collected from hospitalized SARS-CoV-2-positive patients 14 to 21 days after symptom onset (+Eval) (n = 50) and serum collected from individuals prior to 2020 (−Eval) (n = 50) are shown. Data are from a single experiment (n = 2). Serum samples from COVID-19-negative patients with RT-qPCR-confirmed exposure to one or more commonly circulating human coronaviruses (hCoVs) were also analyzed for SARS-CoV-2 spike-specific IgG reactivity (hCoV Eval) (n = 22). Data from at least 2 independent experiments (n = 4 to 8) are shown for this cohort. Percentages reflect the proportions of positive samples in each cohort (A450 above the threshold indicated by the dotted line).
FIG 6
FIG 6
Longitudinal analysis of spike-specific IgG reactivity early in infection and up to 6 months after symptom onset. (a) Serum samples from patients at two time points following hospital admission were analyzed for spike-specific IgG. Percentages of positive samples are shown above each time point. (b) Individual patient samples (circles) and cumulative positive results (blue bars) graphed as a function of days after symptom onset. Data from two independent experiments (n = 4) are shown. (c and d) Serum samples collected from Conv cohort patients at two subsequent time points (∼100 and ∼180 days after symptom onset) were examined for spike-specific IgG reactivity. (c) Patient samples clustered by time of collection (days after symptom onset). (d) Longitudinal trends for individual patients. Data are from a single representative experiment (n = 2). The diagnostic threshold for IgG is depicted as a dotted line in each graph (A450 = 0.90).
FIG 7
FIG 7
The IgG test affords quantitative assessment of serum IgG from a single measurement. (a) Relationship between the log-transformed readout value (A450 at a 1:1,000 serum dilution) in the IgG antibody test and the endpoint IgG titer (determined from full ELISA curves) for each serum sample in the Conv cohort. Data were fit to a sigmoidal function through nonlinear regression analysis. (b) A 10-fold cross-validation method was used to evaluate the predictive utility of this model. For each serum sample, the experimentally determined endpoint IgG titer was compared to that predicted from a single measurement with the antibody test using linear regression analysis. Shaded blue areas represent the 95% confidence intervals for the curve fits.

Update of

References

    1. Dong E, Du H, Gardner L. 2020. An interactive Web-based dashboard to track COVID-19 in real time. Lancet Infect Dis 20:533–534. doi: 10.1016/S1473-3099(20)30120-1. - DOI - PMC - PubMed
    1. Johns Hopkins University. 23 February 2021, accession date. Johns Hopkins University of Medicine coronavirus resource center. Johns Hopkins University, Baltimore, MD. https://coronavirus.jhu.edu/.
    1. Shereen MA, Khan S, Kazmi A, Bashir N, Siddique R. 2020. COVID-19 infection: origin, transmission, and characteristics of human coronaviruses. J Adv Res 24:91–98. doi: 10.1016/j.jare.2020.03.005. - DOI - PMC - PubMed
    1. Cui J, Li F, Shi Z-L. 2019. Origin and evolution of pathogenic coronaviruses. Nat Rev Microbiol 17:181–192. doi: 10.1038/s41579-018-0118-9. - DOI - PMC - PubMed
    1. Wiersinga WJ, Rhodes A, Cheng AC, Peacock SJ, Prescott HC. 2020. Pathophysiology, transmission, diagnosis, and treatment of coronavirus disease 2019 (COVID-19): a review. JAMA 324:782–793. doi: 10.1001/jama.2020.12839. - DOI - PubMed

Publication types

MeSH terms

LinkOut - more resources