. 2021 Apr 21;12(1):2357.
doi: 10.1038/s41467-021-22444-1.

A comprehensive characterization of the cell-free transcriptome reveals tissue- and subtype-specific biomarkers for cancer detection

Affiliations

A comprehensive characterization of the cell-free transcriptome reveals tissue- and subtype-specific biomarkers for cancer detection

Matthew H Larson et al. Nat Commun. .

Erratum in

Abstract

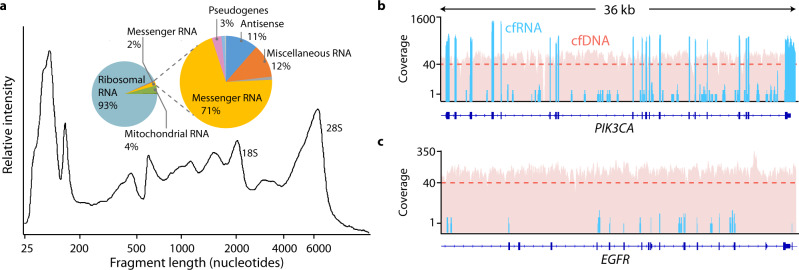
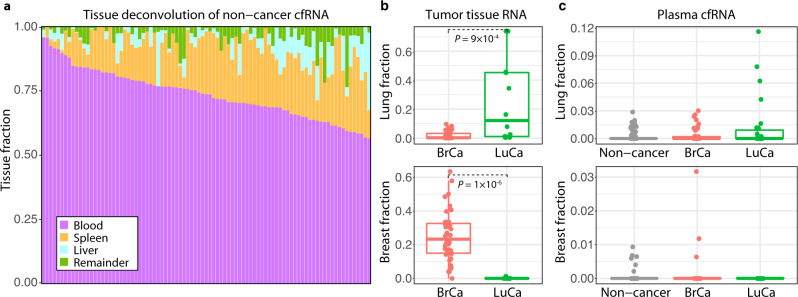
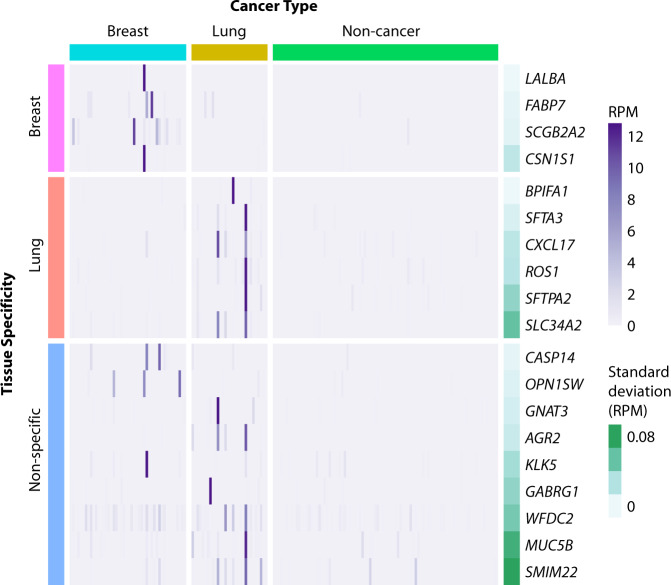
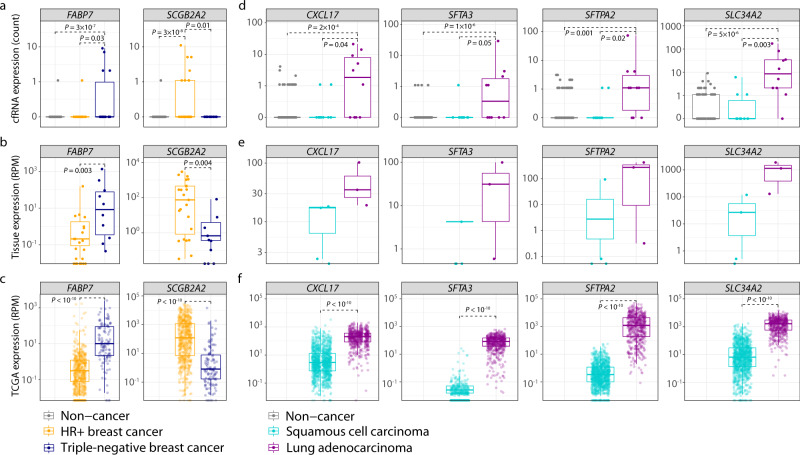
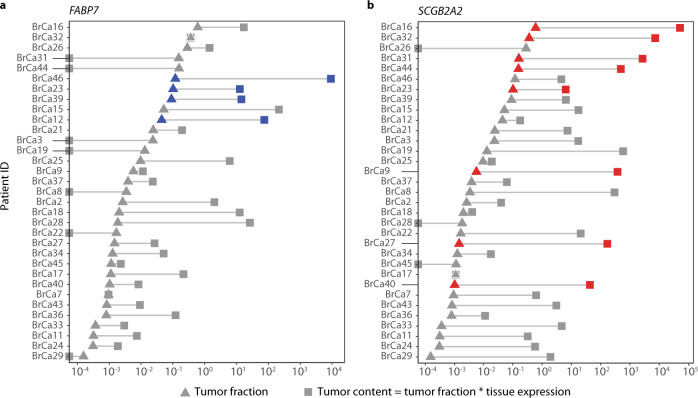
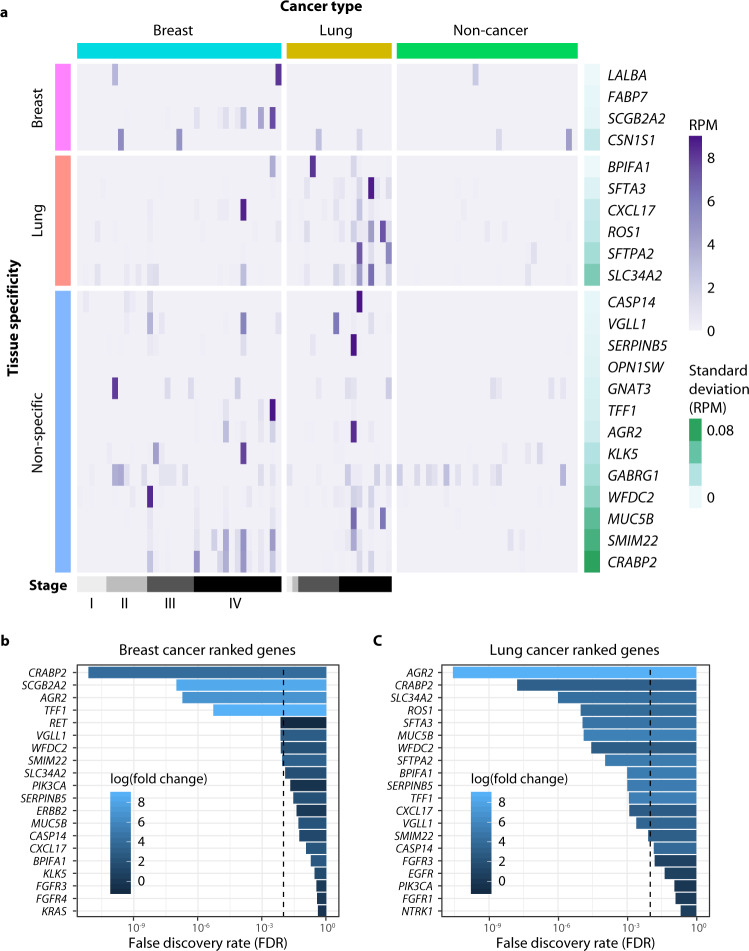
Cell-free RNA (cfRNA) is a promising analyte for cancer detection. However, a comprehensive assessment of cfRNA in individuals with and without cancer has not been conducted. We perform the first transcriptome-wide characterization of cfRNA in cancer (stage III breast [n = 46], lung [n = 30]) and non-cancer (n = 89) participants from the Circulating Cell-free Genome Atlas (NCT02889978). Of 57,820 annotated genes, 39,564 (68%) are not detected in cfRNA from non-cancer individuals. Within these low-noise regions, we identify tissue- and cancer-specific genes, defined as "dark channel biomarker" (DCB) genes, that are recurrently detected in individuals with cancer. DCB levels in plasma correlate with tumor shedding rate and RNA expression in matched tissue, suggesting that DCBs with high expression in tumor tissue could enhance cancer detection in patients with low levels of circulating tumor DNA. Overall, cfRNA provides a unique opportunity to detect cancer, predict the tumor tissue of origin, and determine the cancer subtype.


Conflict of interest statement

M.H.L., R.E.M., S.M.S., M.P., Y.Z., V.D. and A.J. are employees of GRAIL, Inc. with equity in the company. W.P., H.J.K., P.K. and A.M.A. are former employees of GRAIL, Inc. with equity in the company.

Figures

Fig. 1
Fig. 1. Analytical characterization of cell-free RNA.
a Fragment Analyzer (Agilent) trace of cfRNA fragment lengths in a non-cancer sample following deoxyribonuclease (DNase) digestion. Inset: Relative proportion of different RNA types found by whole-transcriptome sequencing in a representative non-cancer sample prior to abundant transcript depletion. Sequencing coverage across a 36 kb region of b PIK3CA, a high-abundance cell-free RNA gene, and c EGFR, a low-abundance cell-free RNA gene, from a representative patient sample. Blue bars represent coverage for a whole-transcriptome cfRNA sample with 584 M paired-end reads, and red bars represent coverage for a whole-genome cfDNA sample from the same patient with 871 M paired-end reads. The dashed line represents median cfDNA coverage.
Fig. 2
Fig. 2. Tissue deconvolution of RNA from plasma and tissue samples.
a Tissue deconvolution for cell-free RNA (cfRNA) from 89 non-cancer plasma participants. Each stacked bar represents a single participant. b Lung and breast fraction distribution in RNA from matched tumor tissue obtained from 40 breast cancer (BrCa) and 11 lung cancer (LuCa) patients. P values from the two-sided Wilcoxon rank-sum method indicate significance levels for differences in tissue-specific fractions across sample groups. c Lung and breast fraction distribution in plasma-derived cfRNA from different sample groups (46 BrCa, 28 LuCa, 89 non-cancer). Boxplots indicate the 25% (lower hinge), 50% (horizontal line), and 75% quantiles (upper hinge) of the tissue fraction distribution, with whiskers that indicate observations outside the hinge ± 1.5 x interquartile range (IQR). Outliers (beyond 1.5 × IQR) are plotted individually.
Fig. 3
Fig. 3. Dark channel biomarker (DCB) expression in cell-free RNA from breast, lung, and non-cancer plasma samples.
Samples are shown in columns and DCB genes in rows. Cancer type is indicated above the heatmap, and the tissue specificity of each DCB, as annotated in the Human Protein Atlas (version 18.1), is indicated on the left side of the heatmap. Gene expression values in reads per million (RPM) are represented by the purple gradient and are scaled for visualization purposes. Darkness in non-cancer plasma samples is illustrated by the standard deviation of RPM (green gradient bar) as shown on the right side of the heatmap.
Fig. 4
Fig. 4. Dark channel biomarker (DCB) genes exhibit cancer and subtype-specific expression in cfRNA and tumor tissue.
Expression (strict counts) of breast cancer-specific DCBs in a cfRNA of breast cancer (n = 24 HR+, n = 14 triple negative) and non-cancer participants (n = 89), and in b matched breast tumor biopsies (n = 23 HR+, n = 10 triple-negative). c Expression (RPM) of RNA in breast tumor tissue (n = 575 HR+, n = 115 triple-negative) from The Cancer Genome Atlas (TCGA). Expression (strict counts) of lung cancer-specific DCBs in d cfRNA of lung cancer (n = 10 adenocarcinoma, 10 squamous cell carcinoma) and non-cancer participants (n = 89), and in e matched lung tumor biopsies (n = 4 squamous cell carcinoma, n = 3 adenocarcinoma). f Expression (RPM) of RNA in lung tumor tissue (n = 1102 squamous cell carcinoma, n = 533 adenocarcinoma) from TCGA. P values from the two-sided Wilcoxon rank-sum method indicate significance levels for differential expression between cancer subtypes. Boxplots indicate the 25% (lower hinge), 50% (horizontal line), and 75% quantiles (upper hinge), with whiskers that indicate observations outside the hinge ± 1.5 × interquartile range (IQR). Outliers (beyond 1.5 × IQR) are plotted individually.
Fig. 5
Fig. 5. The impact of tumor fraction and tumor content on the detectability of dark channel biomarker genes in cell-free RNA.
Patient IDs plotted as a function of tumor fraction (triangles) and tumor content (squares) for a FABP7 and b SCGB2A2. Patient IDs are ranked in descending order based on patient-specific tumor fractions and are ordered identically in both panels. Blue and red symbols represent samples for which either FABP7 or SCGB2A2 was detected in plasma, respectively.
Fig. 6
Fig. 6. Detection of dark channel biomarker (DCB) genes in cell-free RNA of an independent validation cohort.
a Samples are shown in columns and DCB genes in rows. Cancer type is indicated above the heatmap, and tissue specificity of each DCB, as annotated in the Human Protein Atlas (version 18.1), is indicated on the left side of the heatmap. Gene expression values in reads per million (RPM) are represented by the purple gradient and are scaled for visualization purposes. Darkness in non-cancer plasma samples is illustrated by the standard deviation of RPM (green gradient bar) as shown on the right side of the heatmap. False discovery rates (FDR) for the top 20 genes ranked by differential expression analysis of the targeted assay are shown for b breast cancers and c lung cancers. FDR was calculated as the Benjamini-Hochberg corrected P value (using a cut-off of 1% to allow for <1 false-positive across 35 genes).

References

    1. Newman AM, et al. An ultrasensitive method for quantitating circulating tumor DNA with broad patient coverage. Nat. Med. 2014;20:548–554. - PMC - PubMed
    1. Shen SY, et al. Sensitive tumour detection and classification using plasma cell-free DNA methylomes. Nature. 2018;563:579–583. - PubMed
    1. Bettegowda C, et al. Detection of circulating tumor DNA in early- and late-stage human malignancies. Sci. Transl. Med. 2014;6:224ra24. - PMC - PubMed
    1. Chan KCA, et al. Noninvasive detection of cancer-associated genome-wide hypomethylation and copy number aberrations by plasma DNA bisulfite sequencing. Proc. Natl Acad. Sci. USA. 2013;110:18761–18768. - PMC - PubMed
    1. Haque, I. S. & Elemento, O. Challenges in using ctDNA to achieve early detection of cancer. bioRxiv 237578 10.1101/237578. (2017).

Publication types

Associated data