. 2021 Apr 21;11(1):8632.
doi: 10.1038/s41598-021-87974-6.

Prediction of sarcopenia using a battery of circulating biomarkers

Affiliations

Prediction of sarcopenia using a battery of circulating biomarkers

Rizwan Qaisar et al. Sci Rep. .

Abstract

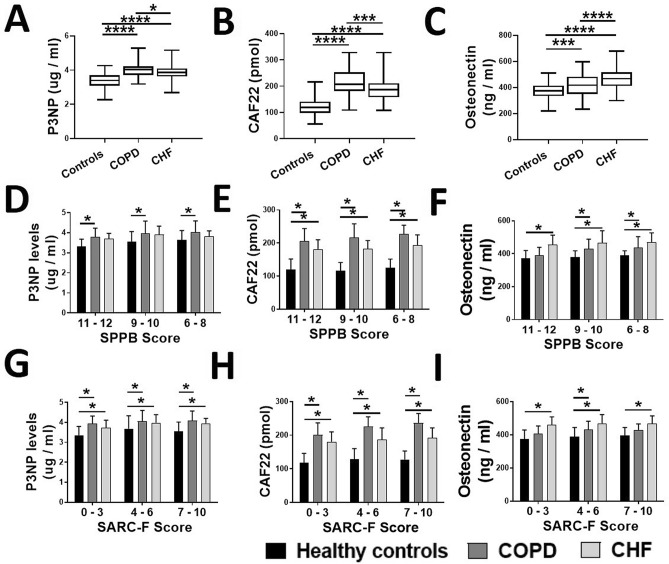
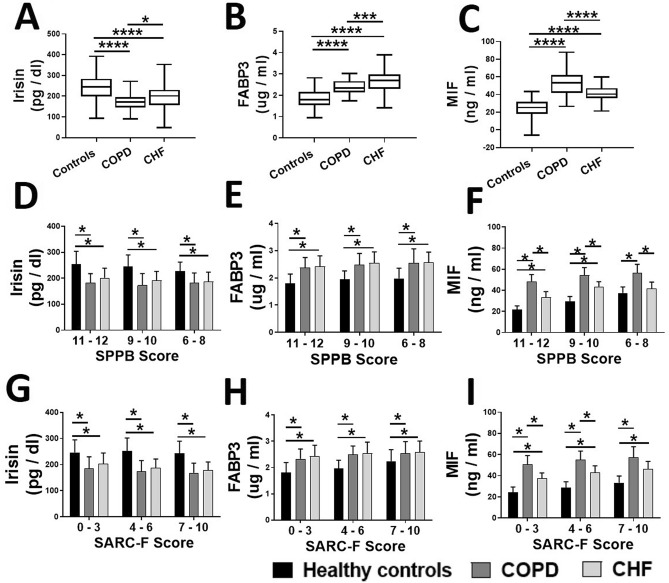
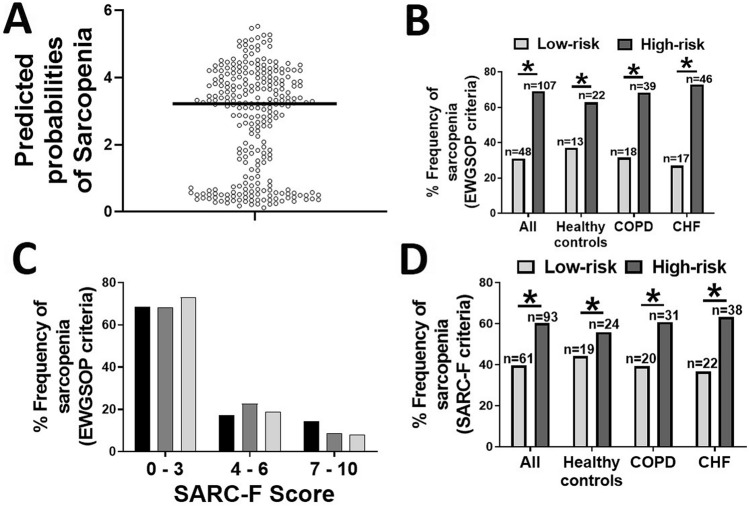
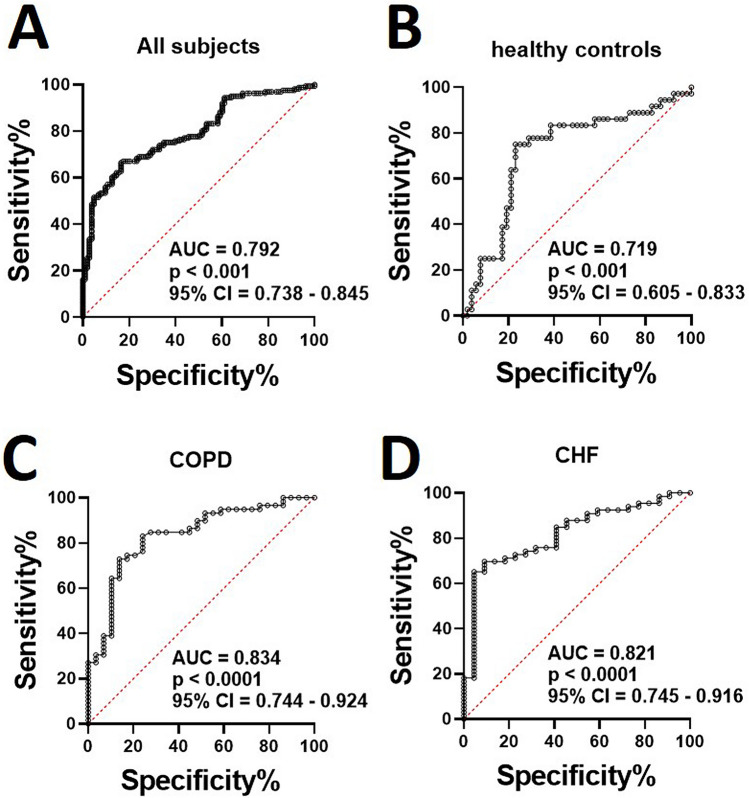
Loss of muscle mass and strength with aging, termed sarcopenia is accelerated in several comorbidities including chronic heart failure (CHF) and chronic obstructive pulmonary diseases (COPD). However, the effective circulating biomarkers to accurately diagnose and assess sarcopenia are not known. We recruited male healthy controls and patients with CHF and COPD (n = 81-87/group), aged 55-74 years. Sarcopenia was clinically identified based on hand-grip strength, appendicular skeletal muscle index and physical capacity as recommended by the European working group for sarcopenia. The serum levels of amino-terminal pro-peptide of type-III procollagen, c-terminal agrin fragment-22, osteonectin, irisin, fatty acid-binding protein-3 and macrophage migration inhibitory factor were significantly different between healthy controls and patients with CHF and COPD. Risk scores for individual biomarkers were calculated by logistic regressions and combined into a cumulative risk score. The median cutoff value of 3.86 was used to divide subjects into high- and low-risk groups for sarcopenia with the area under the curve of 0.793 (95% CI = 0.738-0.845, p < 0.001). A significantly higher incidence of clinical sarcopenia was found in high-risk group. Taken together, the battery of biomarkers can be an effective tool in the early diagnosis and assessment of sarcopenia.


Conflict of interest statement

The authors declare no competing interests.

Figures

Figure 1
Figure 1
Relative proportions of the participants with different SPPB (A) and SARC-F (B) scores in the healthy controls (N = 87) and patients with COPD (N = 86) and CHF (N = 81). Values are expressed in percentages, *p < 0.05.
Figure 2
Figure 2
Comparison of circulating P3NP (A), CAF22 (B) and osteonectin (C) levels in healthy controls (N = 87) and patients with COPD (N = 86) and CHF (N = 81). The biomarkers levels were generally higher in the participants with advanced sarcopenia based on SPPB (D, E, and F) and SARC-F (G, H, and I) scoring. Values are expressed as mean ± SD, one-way analysis of variance. *p < 0.05.
Figure 3
Figure 3
Comparison of circulating irisin (A), FABP3 (B) and MIF (C) levels in healthy controls (N = 87) and patients with COPD (N = 86) and CHF (N = 81). The biomarkers levels were generally higher in the participants with advanced sarcopenia based on SPPB (D, E, and F) and SARC-F (G, H, and I) scoring. Values are expressed as mean ± SD, one-way analysis of variance. *p < 0.05.
Figure 4
Figure 4
Cumulative risk score for all the participants based on six biomarkers (P3NP, CAF22, osteonectin, irisin, FABP3 and MIF). The scatter plot of the participants with the median risk score (cutoff value = 3.86) was applied to divide into high- and low-risk groups (A). The relative proportion of the clinically diagnosed sarcopenic patients in the two risk-groups (B) and participants’ categorization based on SARC-F scores (C) in the three study cohorts. The relative proportion of the sarcopenic patients as defined by SARC-F criteria in the two risk-groups (D) in healthy controls and patients with COPD and CHF. *p < 0.05.
Figure 5
Figure 5
Significance of cumulative risk score for all the participants based on six biomarkers (P3NP, CAF22, osteonectin, irisin, FABP3 and MIF). Receiver operating characteristic (ROC) curves for all the participants (A), healthy controls (B) and the patients with COPD (C) and CHF (D). The area under the curve (AUC) was calculated for each group to determine the significance of the biomarkers panel in diagnosis of sarcopenia.

Similar articles

Cited by

References

    1. Cristea A, et al. Effects of aging and gender on the spatial organization of nuclei in single human skeletal muscle cells. Aging Cell. 2010;9(5):685–697. doi: 10.1111/j.1474-9726.2010.00594.x. - DOI - PubMed
    1. Cruz-Jentoft AJ, et al. Sarcopenia: Revised European consensus on definition and diagnosis. Age Ageing. 2019;48(4):601. doi: 10.1093/ageing/afz046. - DOI - PMC - PubMed
    1. Cruz-Jentoft AJ, et al. Sarcopenia: European consensus on definition and diagnosis: Report of the European Working Group on Sarcopenia in Older People. Age Ageing. 2010;39(4):412–423. doi: 10.1093/ageing/afq034. - DOI - PMC - PubMed
    1. Beaudart C, et al. Health outcomes of sarcopenia: A systematic review and meta-analysis. PLoS ONE. 2017;12(1):e0169548. doi: 10.1371/journal.pone.0169548. - DOI - PMC - PubMed
    1. Yeung SSY, et al. Sarcopenia and its association with falls and fractures in older adults: A systematic review and meta-analysis. J. Cachexia Sarcopenia Muscle. 2019;10(3):485–500. doi: 10.1002/jcsm.12411. - DOI - PMC - PubMed

Publication types

LinkOut - more resources