. 2021 Apr 21;11(1):8675.
doi: 10.1038/s41598-021-88134-6.

EGFR-dependent tyrosine phosphorylation of integrin β4 is not required for downstream signaling events in cancer cell lines

Affiliations

EGFR-dependent tyrosine phosphorylation of integrin β4 is not required for downstream signaling events in cancer cell lines

Lisa Te Molder et al. Sci Rep. .

Abstract

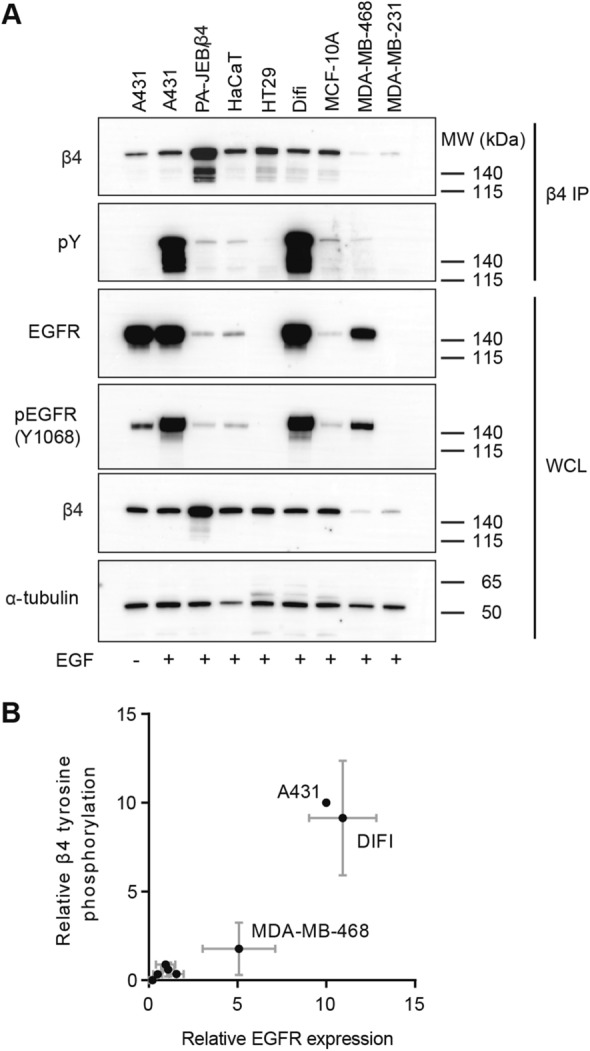
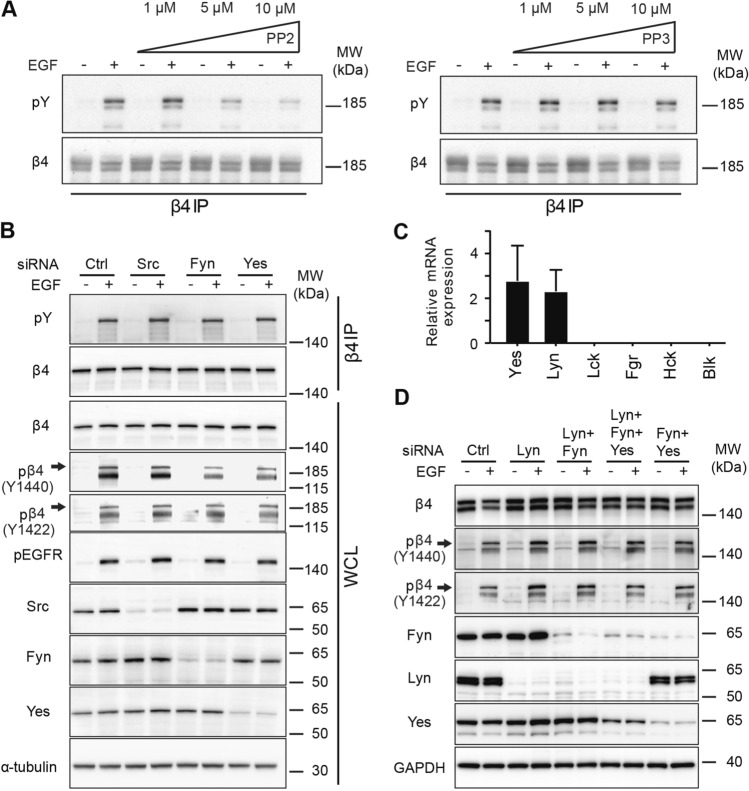
In epithelial cancers, the epidermal growth factor receptor (EGFR) and integrin α6β4 are frequently overexpressed and found to synergistically activate intracellular signaling pathways that promote cell proliferation and migration. In cancer cells, the β4 subunit is phosphorylated at tyrosine residues not normally recognized as kinase substrates; however, the function of these phosphotyrosine residues in cancer cells is a subject of much debate. In EGFR-overexpressing carcinoma cells, we found that the Src family kinase (SFK) inhibitor PP2 reduces β4 tyrosine phosphorylation following the activation of EGFR. However, siRNA mediated knockdown of the SFKs Src, Fyn, Yes and Lyn, individually or in combination, did not affect the EGF-induced phosphorylation of β4. Using phospho-peptide affinity chromatography and mass spectrometry, we found that PLCγ1 binds β4 at the phosphorylated residues Y1422/Y1440, but were unable to verify this interaction in A431 carcinoma cells that overexpress the EGFR. Furthermore, using A431 cells devoid of β4 or reconstituted with phenylalanine specific mutants of β4, the activation of several downstream signaling pathways, including PLCγ/PKC, MAPK and PI3K/Akt, were not substantially affected. We conclude that tyrosine-phosphorylated β4 does not enhance EGFR-mediated signaling in EGFR-overexpressing cells, despite the fact that this integrin subunit is highly tyrosine phosphorylated in these cells.


Conflict of interest statement

The authors declare no competing interests.

Figures

Figure 1
Figure 1
EGF-mediated tyrosine phosphorylation of β4 occurs in EGFR overexpressing cell lines. (A) whole cell lysates (WCL) and β4 immunoprecipitation (IP) samples of multiple transformed and untransformed cell lines, expressing β4 and EGFR at different levels, treated with EGF for 5 min after 20 h of serum starvation, were analyzed by Western blot for total β4 levels, tyrosine phosphorylation of β4, total EGFR levels, tyrosine phosphorylation of EGFR and α-tubulin levels (loading control). (B) The protein and tyrosine abundances were quantified, normalized to the levels of A431 (at 10), and visualized in a graph. β4 tyrosine phosphorylation (IP) is normalized to total β4 levels (IP) on the Y-axis, and total EGFR levels (WCL) were normalized to α-tubulin levels (WCL) on the X-axis. The graph shows the mean + standard deviation (SD) of 3 independent experiments. Uncropped images of merged chemiluminescent and colorimetric blots obtained with a ChemiDoc imaging system (BioRad) are shown in Suppl. Fig. 1.
Figure 2
Figure 2
β4 phosphorylation occurs abundantly on the β4 CS. (A) Representation of the tyrosines (Y) present and mutated to phenylalanines (F) in the connecting segment (CS) of the various β4 mutants (4Y-F, 2Y14F and 2Y13F) and wild type (WT) β4. (B) EGF-induced β4 tyrosine phosphorylation of β4 tyrosine mutants shown by Western blot analyses of β4 immunoprecipitation (IP) samples of EGF-treated and untreated COS7 cell overexpressing WT or mutant β4 together with the EGFR. Blots were probed for β4 and phospho-tyrosine (pY). (C) Comparable β4 surface levels in A431 cell lines analyzed by FACS. The A431 cell lines analyzed are as follows: WT, expressing endogenous β4; KO, depleted of endogenous β4 by CRISPR-Cas9; Resc, β4 (KO) cells reconstituted with WT β4; 4Y-F, 2Y13F and 2Y14F β4 mutants, β4 (KO) cells reconstituted with mutated β4. (D) Representative Western blot analyses of WCLs of the various A431 cells for phosphorylation of β4 at Y1440 and Y1422 using phosphosite-specific antibodies. Cells were untreated or treated with EGF for 5 min after 20 h serum starvation. (E) Double immunofluorescence staining for β4 and plectin, and β4 and the EGFR in A431 β4 (KO) cells and β4 (KO) cells reconstituted with WT β4, 4Y-F or 2YF14 β4. Scale bars: 10 µm. (F) Representative Western blot analyses of β4 tyrosine phosphorylation and total β4 levels in β4 IP samples obtained from the various A431 cells untreated or treated with EGF for 5 min after 20 h serum starvation. (G) Quantification of β4 tyrosine phosphorylation levels in the various A431 cell lines, per sample normalized to total β4 levels and per experiment to the pY/β4 WT levels. Graphs shows the mean + SD from 3 independent experiments. Uncropped images of western blots, and merged chemiluminescent and colorimetric blots obtained with a ChemiDoc imaging system (BioRad) are shown in Suppl. Fig. 2.
Figure 3
Figure 3
Effects of PP2 and siRNA-mediated knockdown of SFKs on the tyrosine phosphorylation of β4. (A) Western blot analyses of β4 tyrosine phosphorylation and total β4 levels in β4 immunoprecipitation (IP) samples of A431-β4-GFP (expressing both endogenous β4 and β4-GFP) cells untreated or treated for 5 min with EGF, after treatment with 0, 1, 5 or 10 µM PP2 or PP3. (B) Western blot analyses of β4 IP and WCL samples of WT A431 cells transfected with siRNAs for Src, Fyn and Yes and Ctrl siRNAs, untreated or treated for 5 min with EGF. The blots were proped for phospho-tyrosine (pY), total β4, pβ4 (Y1440), pβ4 (Y1422), pEGFR (Y1068), Src, Fyn, Yes and α-tubulin (loading control). (C) Relative mRNA expression of Yes, Lyn, Frk, Lck, Fgr, Hck and Blk SFKs in WT A431 cells analyzed by RT-PCR. Graph shows the mean + SD of 3 independent experiments. (D) Western blot analyses of WCL samples of WT A431 cells transfected with siRNAs for Fyn, Lyn and/or Yes or Ctrl siRNAs, untreated or treated for 5 min with EGF. The blots were probed for β4, pβ4 (Y1440), pβ4 (Y1422), Fyn, Yes, Lyn and GAPDH (loading control). Uncropped images of merged chemiluminescent and colorimetric blots obtained with a ChemiDoc imaging system (BioRad) and the repetition of the experiment in (A) are shown in Suppl. Fig. 3.
Figure 4
Figure 4
β4 tyrosine phosphorylation might provide a docking platform for PLCγ1. (A) A431 cells were lysed and different synthetic phosphorylated (P) and unphosphorylated (–) peptides derived from β4 were used for immunoprecipitation (IP). IPs were separated on gel and stained with Coomassie blue. The arrows indicate the protein band identified by mass spectrometry as PLCγ1. (B) A431 cells were lysed and different phosphorylated (P) and unphosphorylated (–) synthetic peptides derived from β4 were used for IP. IP samples were analyzed by Western blot for Shc and PLCγ1. (C) A431 cells were serum starved and subsequently treated with EGF for 5 min. A431 WCL and β1, β4 and EGFR IP samples were analyzed by WB for phospho tyrosine, Shc and PLCγ1. Molecular weight (MW) markers are indicated. Uncropped images of merged chemiluminescent and colorimetric blots obtained with a ChemiDoc imaging system (BioRad) are shown in Suppl. Fig. 4.
Figure 5
Figure 5
β4 and its tyrosine phosphorylation at the CS does not alter signaling downstream of the EGFR. (A) Western blot analyses of WCLs from various WT and β4 mutant A431 cell lines, untreated or treated for 5 min with EGF after 20 h serum starvation, for pEGFR (Y845 and Y1068), pMAPK, pAKT, pPLCγ1, pPKCα, βII (T638/641), pPKCpan (βII S660), pPKD (S744/748), β4 and α-tubulin (loading control). (B) Western blot analyses of A431 β4 (Resc), β4 (KO) and β4 (4Y-F) cells untreated or treated for different timepoints (0, 10, 20, 30, 60 and 120 min) with EGF after 20 h serum starvation, for β4, pEGFR (Y845 and Y1068), pPLCγ1 (Y783), pPKCpan (βII S660), pAKT (S473), pMAPK (p44/42) and GAPDH (loading control). (C) Western blot analyses of A431, PA-JEB/β4, HaCaT, HT29, Difi, MCF10A, MDA-MB-231 cells, untreated and treated with EGF for 5 min after 20 h serum starvation, β4, pMAPK (p44/42), pAKT (S473), pPLCγ1 (Y783), α-tubulin and GAPDH (loading controls). (D) Western blot analyses of PA-JEB/β4 and HaCaT cells, β4 proficient and deficient, treated with or without EGF for 10 min after 20 h serum starvation, for total β4, pEGFR (Y1068), total EGFR, pMAPK (p44/42), total MAPK, pPLCγ1 (Y783), total pPLCγ1, pPKCpan (βII S660), pPKCα,β II (T638/641), pPKD (S744/748), pAKT(S473) and GAPDH (loading control). Of note, while phosphorylation of PLCγ1 appears reduced in HaCaT β4 KO cells, this reduction was not consistently observed in repeat experiments. Uncropped images of merged chemiluminescent and colorimetric blots obtained with a ChemiDoc imaging system (BioRad) are shown in Suppl. Fig. 5.
Figure 6
Figure 6
Inhibition of A431 cell proliferation by EGF. (A) A431-β4 (KO) cells reconstituted with WT β4 (Resc) grown in DMEM/FCS and serum-starved for 20 h were left untreated or treated with EGF, HGF or PDGF at 50 ng ml−1, or 2% FCS for 10 min. Additionally, A431-β4 (Resc) cells grown in DMEM/FCS were left untreated or treated in the presence of serum with 50 ng ml−1 EGF. Cell lysates were immunoblotted for pβ4 (Y1422), pβ4 (Y1440), total β4, pEGFR (Y845), pEGFR (Y1068), pShc (Y317), pMAPK (p44/42), pAKT (S473), pAKT (T308), pPLCγ (Y783), pPKC βII (S660), pPKD (S744/748) and GAPDH (loading control). Note, that the lower band of β4 (the precursor or a degradation product of β4) runs at the same height as the phosphorylated EGFR. (B) Quantification of Western blot data from (A). (C) Growth inhibition of A431-β4 (KO) and A431-β4 (Resc) cells and the β4 mutant A431 cell lines A431-β4 (2Y14F) and A431-β4 (4Y-F) by EGF. Cells were seeded in triplicate at 5.000 cells per well in a microtiter plate in DMEM/FCS in the presence or absence of 50 ng ml−1 EGF. After adhesion, cell proliferation was assessed by crystal violet staining on four consecutive days. Each point is the mean ± SD from two independent experiments. (D) Western blot analyses of total lysates from A431-β4 (Resc) cells and β4 mutant A431 cells, cultured in DMEM/FCS for 24 h in the presence or absence of 50 ng ml−1 EGF, for β4, total Caspase-3, cleaved Caspase-3 and GAPDH (loading control). Cells treated for 3 h with 1 μM staurosporine served as positive control of apoptosis induction. Uncropped images of merged chemiluminescent and colorimetric blots obtained with a ChemiDoc imaging system (BioRad) are shown in Suppl. Fig. 6.

References

    1. Hanahan D, Weinberg RA. Hallmarks of cancer: the next generation. Cell. 2011;144:646–674. - PubMed
    1. Du Z, Lovly CM. Mechanisms of receptor tyrosine kinase activation in cancer. Mol. Cancer. 2018;17:58. doi: 10.1186/s12943-018-0782-4. - DOI - PMC - PubMed
    1. Hamidi H, Ivaska J. Every step of the way: integrins in cancer progression and metastasis. Nat. Rev. Cancer. 2018;18:533–548. doi: 10.1038/s41568-018-0038-z. - DOI - PMC - PubMed
    1. Kajiji S, Tamura RN, Quaranta V. A novel integrin (alpha E beta 4) from human epithelial cells suggests a fourth family of integrin adhesion receptors. EMBO J. 1989;8:673–680. doi: 10.1002/j.1460-2075.1989.tb03425.x. - DOI - PMC - PubMed
    1. Sonnenberg A, et al. Integrin alpha 6/beta 4 complex is located in hemidesmosomes, suggesting a major role in epidermal cell-basement membrane adhesion. J. Cell Biol. 1991;113:907–917. doi: 10.1083/jcb.113.4.907. - DOI - PMC - PubMed

Publication types