. 2021 Apr 14:16:2833-2847.
doi: 10.2147/IJN.S266398. eCollection 2021.

Cancer Therapy with Nanoparticle-Medicated Intracellular Expression of Peptide CRM1-Inhibitor

Affiliations

Cancer Therapy with Nanoparticle-Medicated Intracellular Expression of Peptide CRM1-Inhibitor

Min Sui et al. Int J Nanomedicine. .

Abstract

Introduction: Peptides can be rationally designed as non-covalent inhibitors for molecularly targeted therapy. However, it remains challenging to efficiently deliver the peptides into the targeted cells, which often severely affects their therapeutic efficiency.

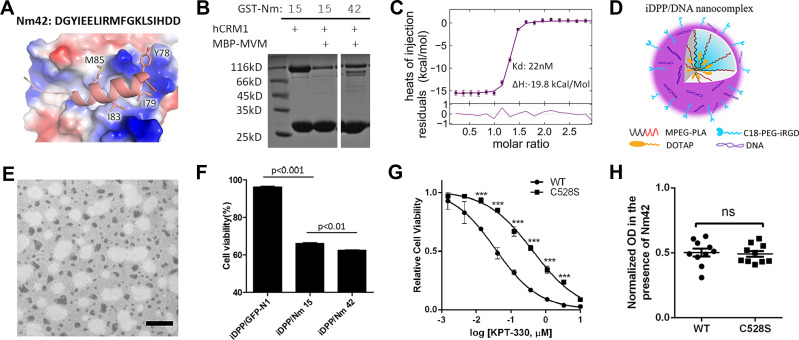
Methods: Herein, we created a novel non-covalent peptide inhibitor against nuclear export factor CRM1 by a structure-guided drug design method and targetedly delivered the peptide into cancer cells by a nanoparticle-mediated gene expression system for use as a cancer therapy.

Results: The nuclear export signal (NES)-optimized CRM1 peptide inhibitor colocalized with CRM1 to the nuclear envelope and inhibited nuclear export in cancer cell lines in vitro. The crystal structures of the inhibitors complexed with CRM1 were solved. In contrast to the covalent inhibitors, the peptides were similarly effective against cells harboring the CRM1 C528S mutation. Moreover, a plasmid encoding the peptides was delivered by a iRGD-modified nanoparticle to efficiently target and transfect the cancer cells in vivo after intravenous administration. The peptides could be selectively expressed in the tumor, resulting in the efficient inhibition of subcutaneous melanoma xenografts without obvious systemic toxicity.

Discussion: This work provides an effective strategy to design peptide-based molecularly targeted therapeutics, which could lead to the development of future targeted therapy.

Keywords: CRM1; DNA nanocomplex; crystal structures; non-covalent inhibitor; protein engineering.


Conflict of interest statement

QS, YL, MS, MG, and MX have applied patents on the designed peptides in this study. The authors report no other conflicts of interest in this work.

Figures

Figure 1
Figure 1
Crystal structure of NS2 NES in complex with CRM1/Ran/RanBP1 and the sequences of designed peptides. (A) The overall structure of NS2 NES in complex with CRM1/Ran/RanBP1. NS2 NES is shown as a ball and sticks representation. (B) Structural comparison of NS2 NES with that of PKI (pink, PDB 3NBY) and hRio reversed (blue, PDB 5DI9). (C) Hydrogen bonds formed between NS2 NES and yCRM1. (D) D80 and E81 contact distances with CRM1. The distances between opposite charges (labeled with dashes) could possibly be optimized by mutating to E80/D81. (E) List of mutations that were designed and discussed in the text. (F) The electrostatic surface potential map of CRM1. N and C terminuses of NS2 NES are surrounded by highly basic (circled) CRM1 surfaces.
Figure 2
Figure 2
Comparing mutants’ affinities to CRM1 by pull-down and ITC experiments. (A) Top: pull-down analysis of different GST-MVM mutants in binding to CRM1 in the presence of competitor MBP-WT (MBP-tagged MVM WT NES). Bottom: quantification of CRM1 binding normalized by GST-NES bands and setting WT as 1. The error bars represent the standard deviation (SD) of three quantifications on the gel shown above. (B and C) ITC analysis of WT and Nm15 binding to CRM1. Error bars represent 68.3% confidence interval of measurements. (D) Affinity (Kd) and enthalpy change (ΔH) of different NES peptides binding to CRM1. Please refer to Figure S2 for isotherms and fitting for Nm2, Nm3, Nm4, Nm12, Nm13, and Nm16.
Figure 3
Figure 3
Crystal structures of MVM mutant peptides binding to CRM1. (AD) the structure of Nm2 (grey), Nm12 (magenta), Nm13 (yellow), and Nm15 (cyan) stick structures with CRM1 shown as a cartoon. WT MVM is superimposed in each figure for comparison. Hydrogen bonds and electrostatic interactions are represented as dash lines. The angle of viewing is slightly adjusted for different figures to show the changes.
Figure 4
Figure 4
Stronger co-localization with CRM1 by Nm15 in 293T and HeLa cells. (A) Colocalization of CRM1 with GFP-N1, GFP-WT, or GFP-Nm15 in 293T cells. Confocal images in the top panel show the localization of endogenous CRM1 and transfected GFP proteins. White and yellow arrows represent transfected and untransfected cells, respectively. Scale bars represent 10 µm. The middle panel shows the GFP (green) and CRM1 (red) intensities of pixels for the co-responding white lines in the top panel. The bottom panel shows the dot plots for Pearson’s correlation coefficient calculated from at least 30 cells for each sample and the one-way ANOVA statistical analysis. Each dot represents a correlation coefficient calculated from one cell as done in the middle panel. *** denotes p<0.001. Error bars represent the standard deviation (SD) of each sample. (B) Immunoprecipitation to analyze cellular CRM1 binding strength. Transfected 293T cell lysates were immunoprecipitated using GFP or IgG antibodies and blotted for CRM1 and GFP. The bottom band is a proteolyzed fragment of full length GFP-Nm15 (the top band). (C and D) Performed the same as in (A and B), except using HeLa cells.
Figure 5
Figure 5
Nuclear export and cell survival inhibition by transfected GFP-Nm15. (A and B) Confocal images on nuclear export cargo (mCherry-NES-MBP-NLS, labeled as NES) transfected HeLa (A) or A549 (B) cells treated by KPT-330 or listed transfections. Bottom panels show the quantification and statistical analysis of nuclear cargo percentages on images collected in the top panels. Error bars represent the standard error of measurements. Scale bars represent 10 µm. (C and D) Cell survival and statistical analysis for HeLa (C) and A549 (D) cells under different transfection treatments. Error bars represent the standard deviation (SD) of each sample. (E and F) Negative correlations between the percent of nuclear cargo (Y-axis) and cell survival (X-axis) in HeLa (E) and A549 (F) cells. Average values from nuclear export (A and B) and cell survival (C and D) experiments were plotted and fitted using non-linear regression (four variables) in Graphpad software.
Figure 6
Figure 6
Design of Nm42 and nano-packaging of the Nm42 plasmid. (A) The sequence and crystal structure of Nm42 (cartoon) in complex with CRM1 (electrostatic surface potential map). The residues that increased hydrophobic interactions with CRM1 are shown as sticks. (B) SDS-PAGE of pull-down performed using Nm15 and Nm42 in the presence of competitor MBP-MVM WT NES (3 µM). (C) ITC analysis of Nm42 binding to CRM1, performed as in Figure 2. Error bars represent the 68.3% confidence interval of measurements. (D) Schematic illustration of iDPP/DNA nanocomplex. C18-PEG-iRGD, tumor-targeting peptide; DOTAP, cationic N-[1-(2, 3-Dioleoyloxy)propyl]-N,N,N-trimethylammonium chloride; mPEG-PLA, block copolymer monomethoxy poly(ethylene glycol)-poly(d,l-lactide). (E) Morphology of iDPP/DNA nanocomplex determined by TEM. Scale bar, 200 nm. (F) Cell viability of B16-F10 cells after treated with different iDPP/DNA nanocomplexes (2 µg DNA). (G) HeLa stable cell lines (CRM1 WT or C528S) in the presence or absence of variable KPT-330 concentrations. Each concentration is performed with 6 repeats and normalized by the average reading of DMSO-treated samples. IC50s are 36 nM and 432 nM for WT and C528S mutant, respectively. Error bars represent the standard error of measurement. *** denotes p < 0.001. (H) Similar potency against WT and C528S HeLa cells by Nm42 plasmid transfection (2 µg). OD readings are normalized by non-transfected samples for both WT and C528S.
Figure 7
Figure 7
Anti-tumor activities and toxicity evaluation of iDPP/Nm42 nanocomplex on B16-F10 tumor in vivo. (A) In vivo imaging of luciferase activity, which indicated that iDPP/DNA nanocomplex possessed high tumor-targeting efficiency in vivo. (B) Tumor volumes (TV) of mice in each group, calculated according to the formula TV=1/2 × length × (width)2 (n = 5, mean ± SD). NS: treated with 5% glucose. EM, empty vector. (C) Weight of xenograft tumors of each treatment group (n = 5, mean ± SD). *p < 0.05 and ***p < 0.001. (D) Mouse body weight during the treatment. (E) No significant pathological changes from H&E staining of vital organ sections. Scale bar, 100 μm.

References

    1. Huang PS, Boyken SE, Baker D. The coming of age of de novo protein design. Nature. 2016;537(7620):320–327. doi:10.1038/nature19946 - DOI - PubMed
    1. Zhang G, Andersen J, Gerona-Navarro G. Peptidomimetics targeting protein-protein interactions for therapeutic development. Protein Pept Lett. 2018;25(12):1076–1089. doi:10.2174/0929866525666181101100842 - DOI - PubMed
    1. Spicer CD, Jumeaux C, Gupta B, Stevens MM. Peptide and protein nanoparticle conjugates: versatile platforms for biomedical applications. Chem Soc Rev. 2018;47(10):3574–3620. - PMC - PubMed
    1. Shin WH, Christoffer CW, Kihara D. In silico structure-based approaches to discover protein-protein interaction-targeting drugs. Methods. 2017;131:22–32. doi:10.1016/j.ymeth.2017.08.006 - DOI - PMC - PubMed
    1. Ossareh-Nazari B, Bachelerie F, Dargemont C. Evidence for a role of CRM1 in signal-mediated nuclear protein export. Science. 1997;278(5335):141–144. doi:10.1126/science.278.5335.141 - DOI - PubMed

MeSH terms

LinkOut - more resources