

Dose-Response Association of Waist-to-Height Ratio Plus BMI and Risk of Depression: Evidence from the NHANES 05-16
- PMID: 33883926
- PMCID: PMC8055360
- DOI: 10.2147/IJGM.S304706
Dose-Response Association of Waist-to-Height Ratio Plus BMI and Risk of Depression: Evidence from the NHANES 05-16
Abstract
Background: Obesity or underweight has been found to be associated with depression, but the relationship remains to be determined so that more precise prevention strategies can be implemented. Body mass index (BMI) and waist-height ratio (WHR) were used as indicators to study the dose-response relationship between depression and obesity or underweight.
Methods: We obtained basic information and disease-related data for 13,975 adults from the National Health and Nutrition Examination Survey (NHANES) 2005-2016 dataset. The depressive status was determined based on the PHQ-9 scale (>4). Logistic regression was used to analyze the association and risk of BMI, WHTR and depressive status. Based on the results of logistic regression, the dose-response relationship between BMI, WHTR and depressive state was analyzed using restricted cubic splines (RCS).
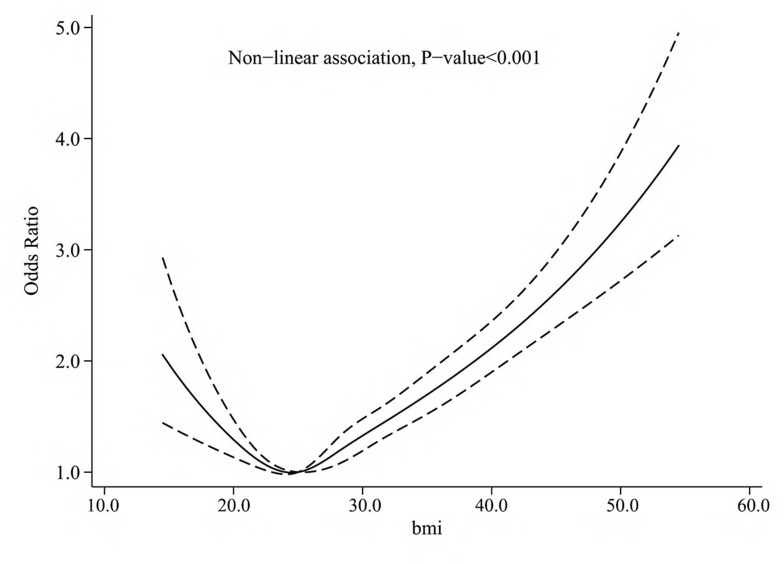
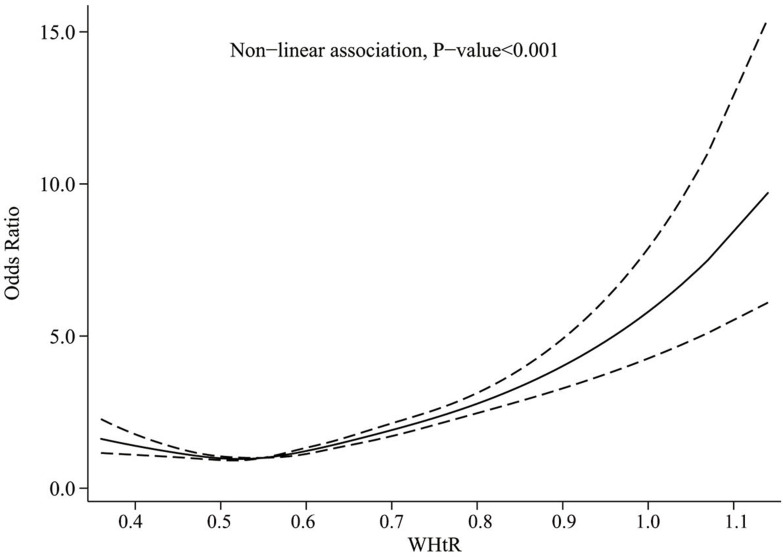
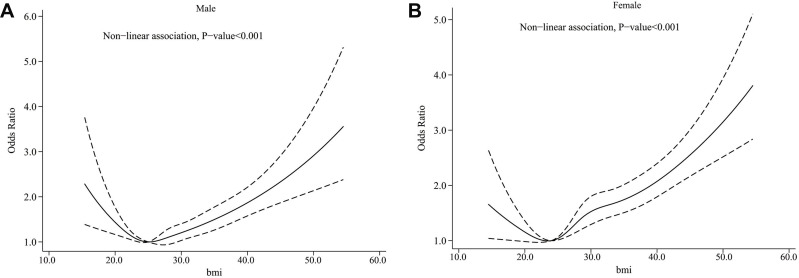
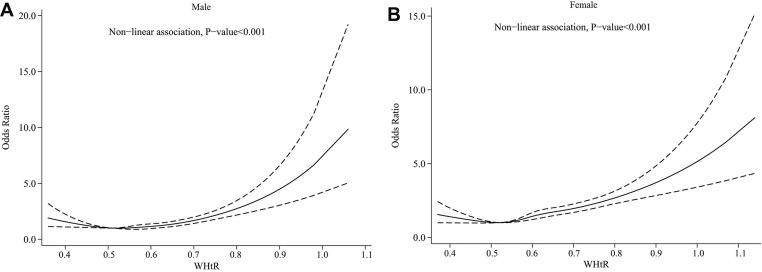
Results: The adjusted model showed that compared with the fourth quartile (Q4) of BMI, the odds ratios (ORs) of depression for Q1, Q2 and Q3 were 0.63 (0.56-0.71), 0.61 (0.54-0.68) and 0.74 (0.66-0.82), and compared with the fourth quartile (Q4) of WHtR, the odds ratios (ORs) of depression for Q1, Q2 and Q3 were 0.55 (0.49-0.62), 0.57 (0.51-0.64) and 0.64 (0.57-0.71), respectively. The restricted cubic spline regression depicted a U-shaped dose-response relationship between continuous changes of obesity indicators and the risk of depression (P1, P2 < 0.001). When the participants' BMI reached approximately 25kg/m2 with the reference value of BMI was 18.5kg/m2, the risk of depression was minimized (OR=0.68, 95% Cl=0.56-0.83). When the WHtR reached approximately 0.52 with the reference value of WHtR was 0.40, the risk of depression was minimized (OR=0.69, 95% Cl=0.54-0.88).
Conclusion: We found a significant U-shape correlation between BMI, WHtR and depression. People with slight overweight have the lowest risk of depression. However, according to the International Obesity standards, the population at these levels of weight may have an obesity-chronic disease risk, and this is not recommended.
Keywords: BMI; depression; dose–response relationship; waist-to-height ratio.
© 2021 Ma et al.
Conflict of interest statement
The authors report no conflicts of interest in this work.
Figures
Similar articles
-
Association between triglyceride glucose index and hyperuricemia: a new evidence from China and the United States.Front Endocrinol (Lausanne). 2024 Jul 1;15:1403858. doi: 10.3389/fendo.2024.1403858. eCollection 2024. Front Endocrinol (Lausanne). 2024. PMID: 39010899 Free PMC article.
-
Cross-Correlations between Scientific Physical Fitness, Body Mass Index Distribution, and Overweight/Obesity Risks among Adults in Taiwan.Medicina (Kaunas). 2022 Nov 27;58(12):1739. doi: 10.3390/medicina58121739. Medicina (Kaunas). 2022. PMID: 36556941 Free PMC article.
-
Relationship between obesity indexes and triglyceride glucose index with gastrointestinal cancer among the US population.Prev Med Rep. 2024 May 17;43:102760. doi: 10.1016/j.pmedr.2024.102760. eCollection 2024 Jul. Prev Med Rep. 2024. PMID: 38818028 Free PMC article.
-
Association between waist-to-height ratio and osteoporosis in the National Health and Nutrition Examination Survey: a cross-sectional study.Front Med (Lausanne). 2024 Dec 18;11:1486611. doi: 10.3389/fmed.2024.1486611. eCollection 2024. Front Med (Lausanne). 2024. PMID: 39744530 Free PMC article.
-
Association between diverse obesity indicators and sleep quality in elderly Chinese people: a National Study.Front Nutr. 2024 Oct 11;11:1459480. doi: 10.3389/fnut.2024.1459480. eCollection 2024. Front Nutr. 2024. PMID: 39464685 Free PMC article.
Cited by
-
Dose-response association of obesity and risk of mental health among tehranian residents: result of a cross-sectional study.BMC Public Health. 2024 May 29;24(1):1444. doi: 10.1186/s12889-024-18670-z. BMC Public Health. 2024. PMID: 38811944 Free PMC article.
-
Predictive factors and risk model for depression in patients with type 2 diabetes mellitus: a comprehensive analysis of comorbidities and clinical indicators.Front Endocrinol (Lausanne). 2025 Mar 5;16:1555142. doi: 10.3389/fendo.2025.1555142. eCollection 2025. Front Endocrinol (Lausanne). 2025. PMID: 40110545 Free PMC article.
-
Association of oxidative balance score with helicobacter pylori infection and mortality in the US population.Int J Med Sci. 2024 May 19;21(7):1344-1352. doi: 10.7150/ijms.95292. eCollection 2024. Int J Med Sci. 2024. PMID: 38818466 Free PMC article.
-
U‑shaped association between relative fat mass (RFM) and stress urinary incontinence: a cross‑sectional study.Eur J Med Res. 2025 Apr 7;30(1):256. doi: 10.1186/s40001-025-02481-y. Eur J Med Res. 2025. PMID: 40197351 Free PMC article.
-
Combined association of chewing capacity and depression with constipation: a cross-sectional study.BMC Gastroenterol. 2025 Jul 14;25(1):517. doi: 10.1186/s12876-025-04123-3. BMC Gastroenterol. 2025. PMID: 40660119 Free PMC article.
References
LinkOut - more resources
Full Text Sources
Other Literature Sources
