. 2020 Dec;1(12):1176-1187.
doi: 10.1038/s43018-020-00126-z. Epub 2020 Oct 26.

Fatty acid metabolism underlies venetoclax resistance in acute myeloid leukemia stem cells

Affiliations

Fatty acid metabolism underlies venetoclax resistance in acute myeloid leukemia stem cells

Brett M Stevens et al. Nat Cancer. 2020 Dec.

Abstract

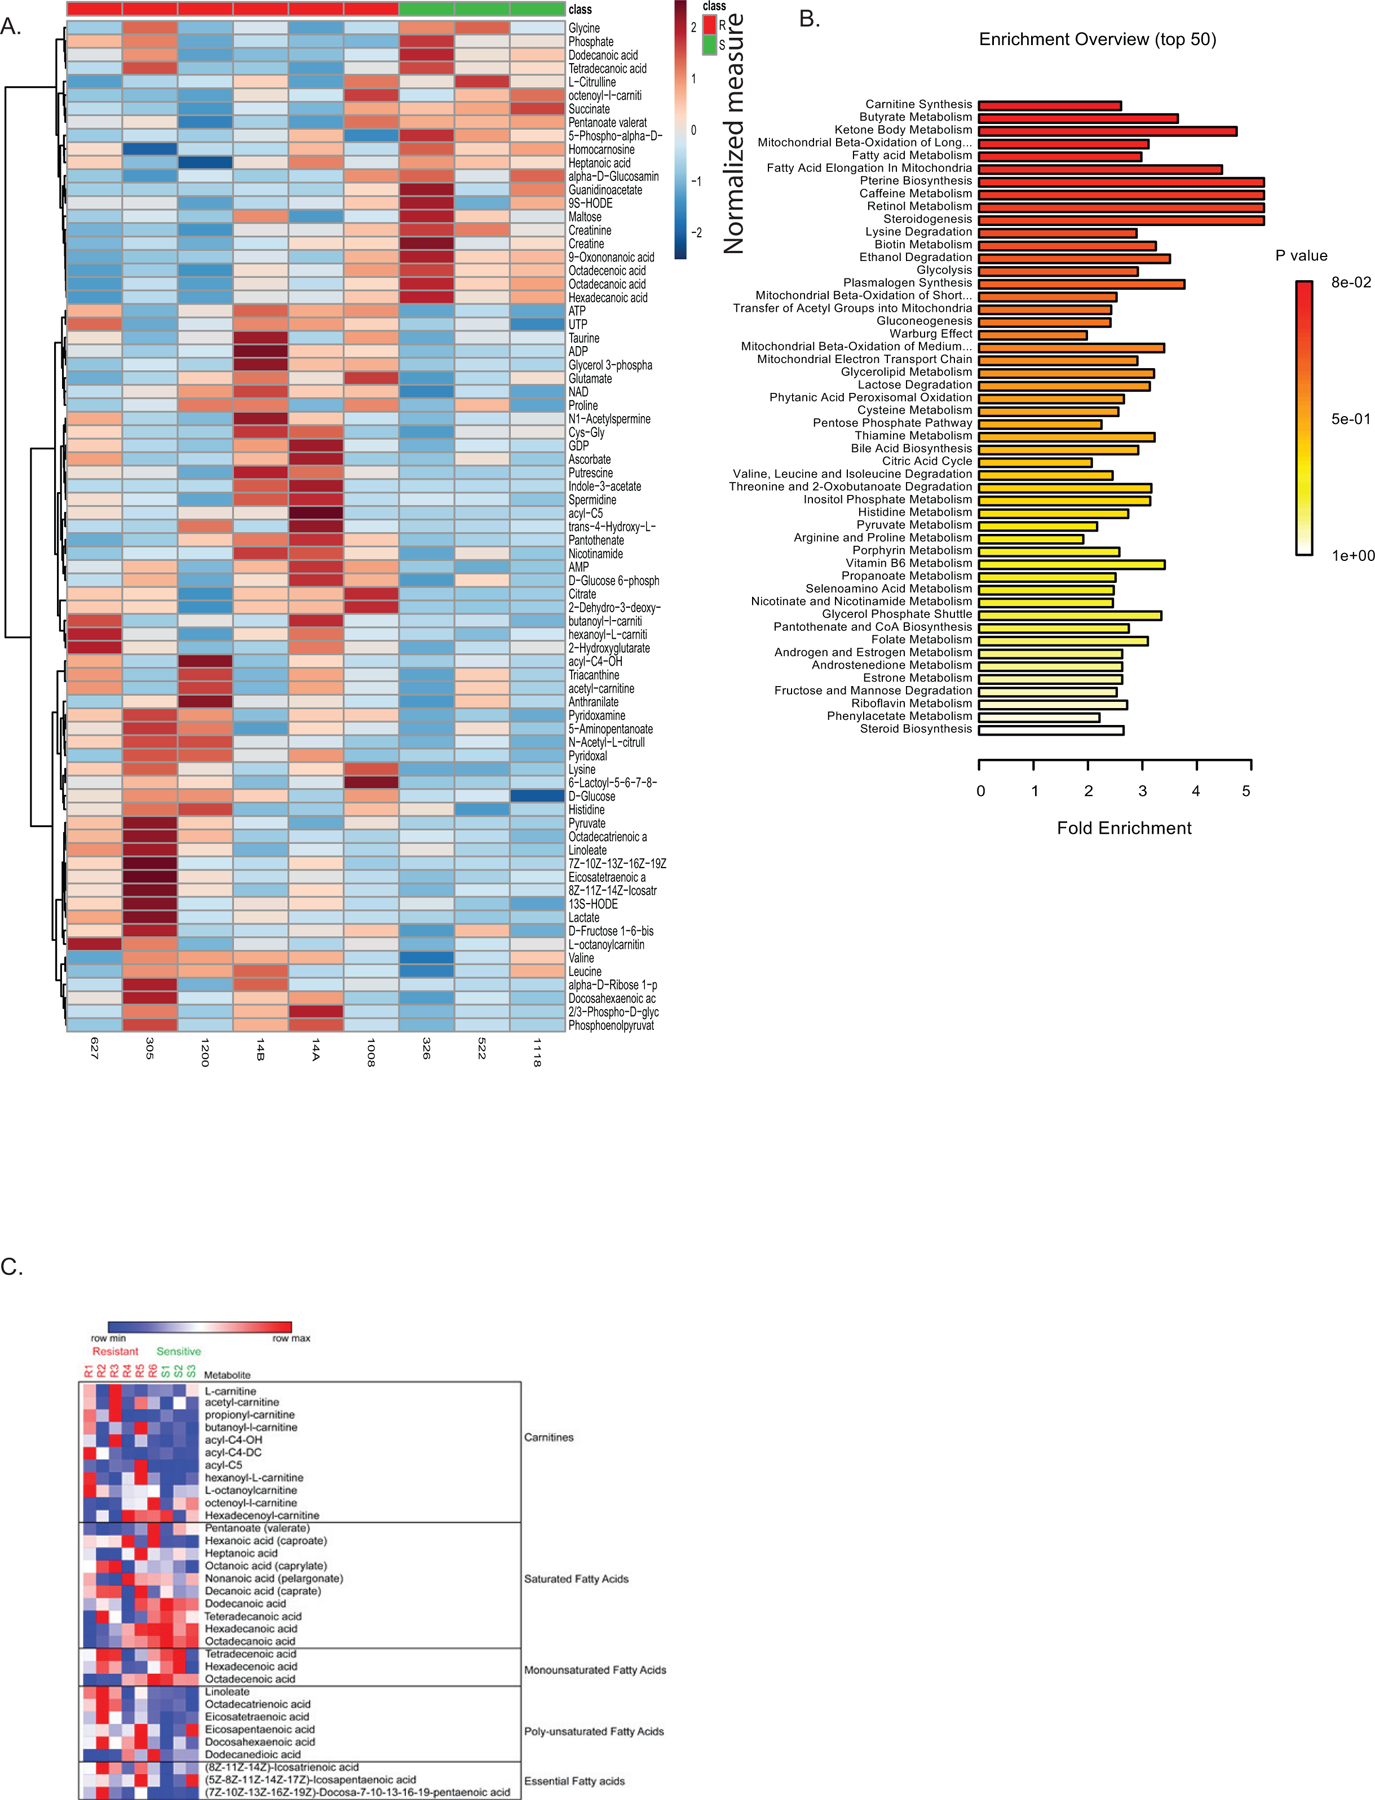
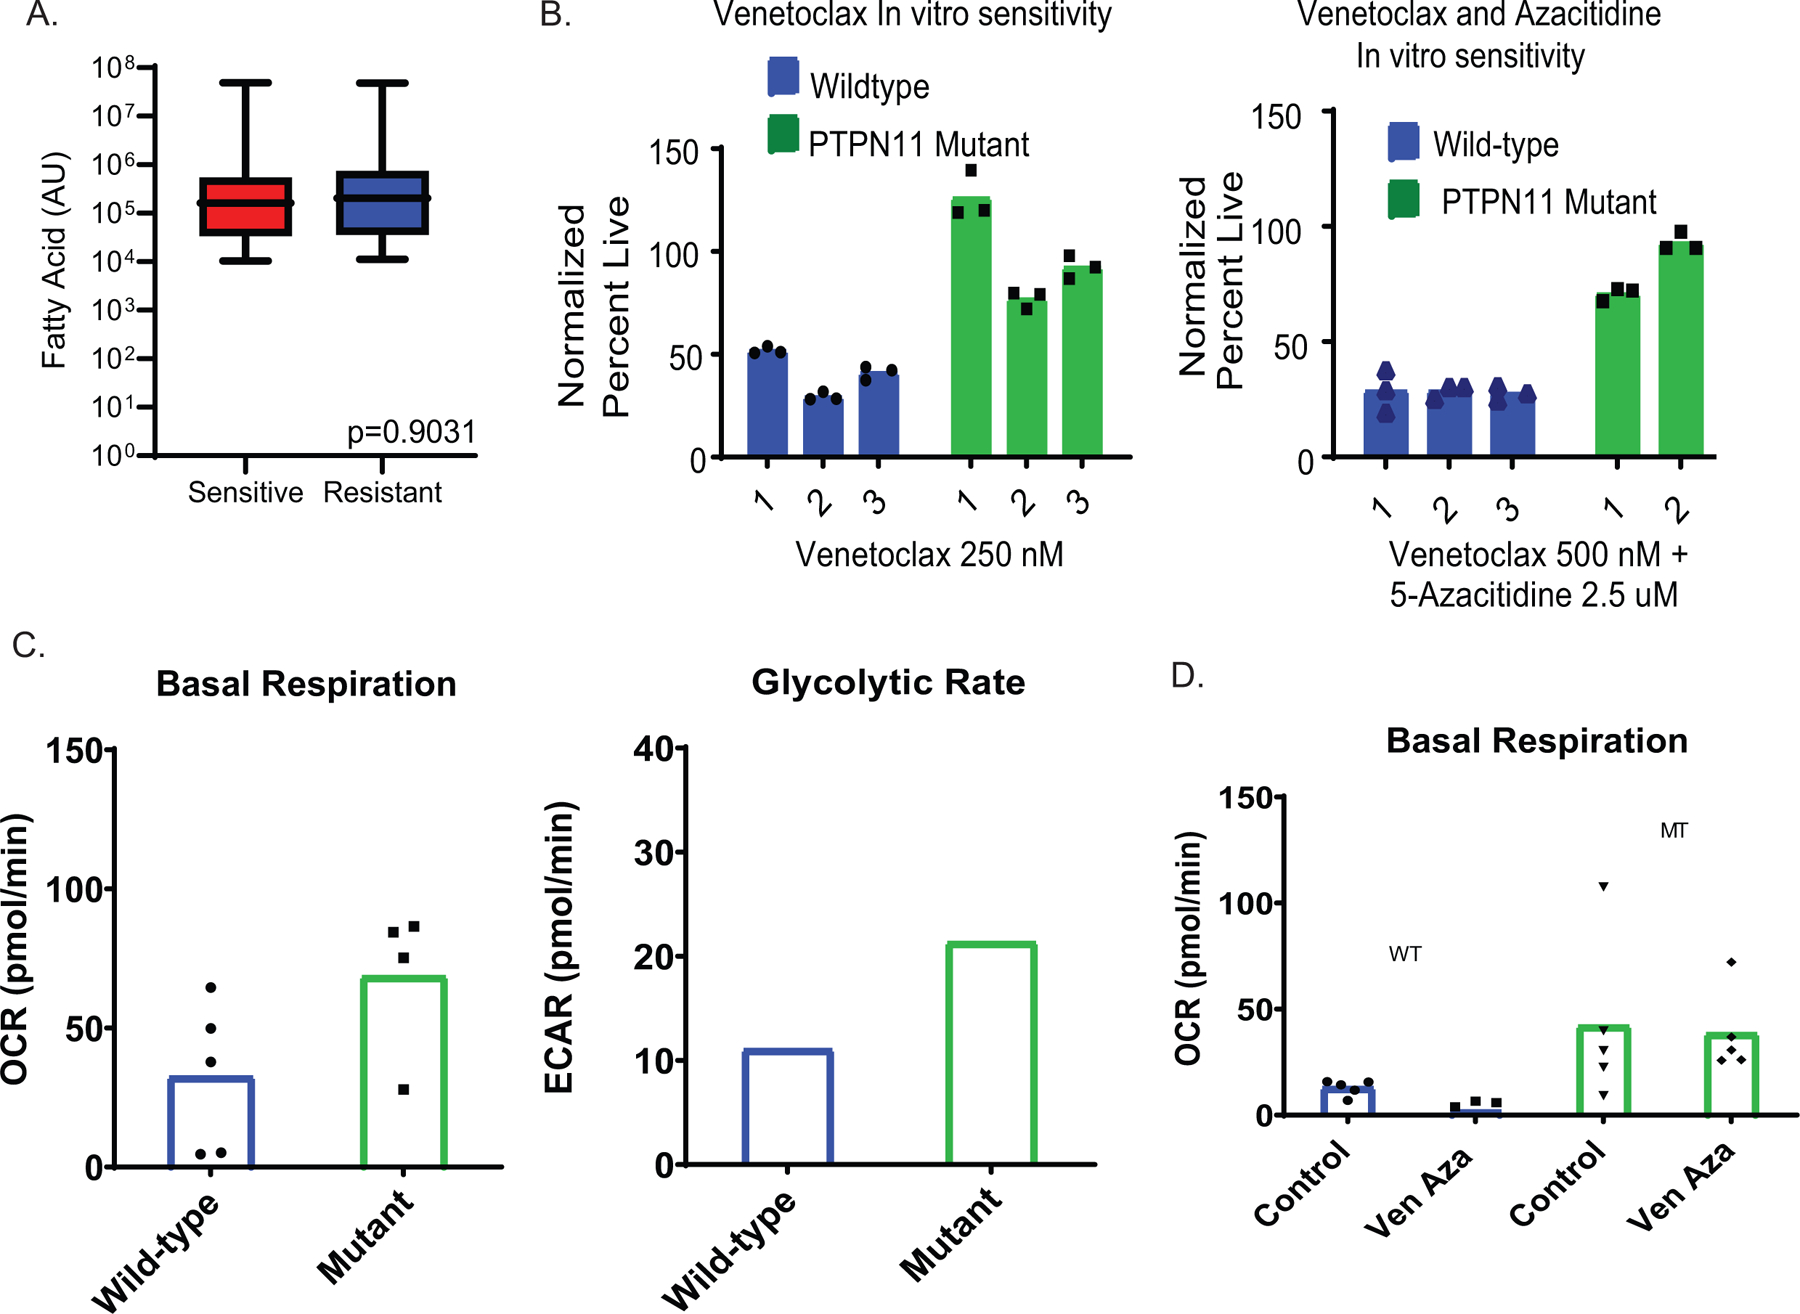
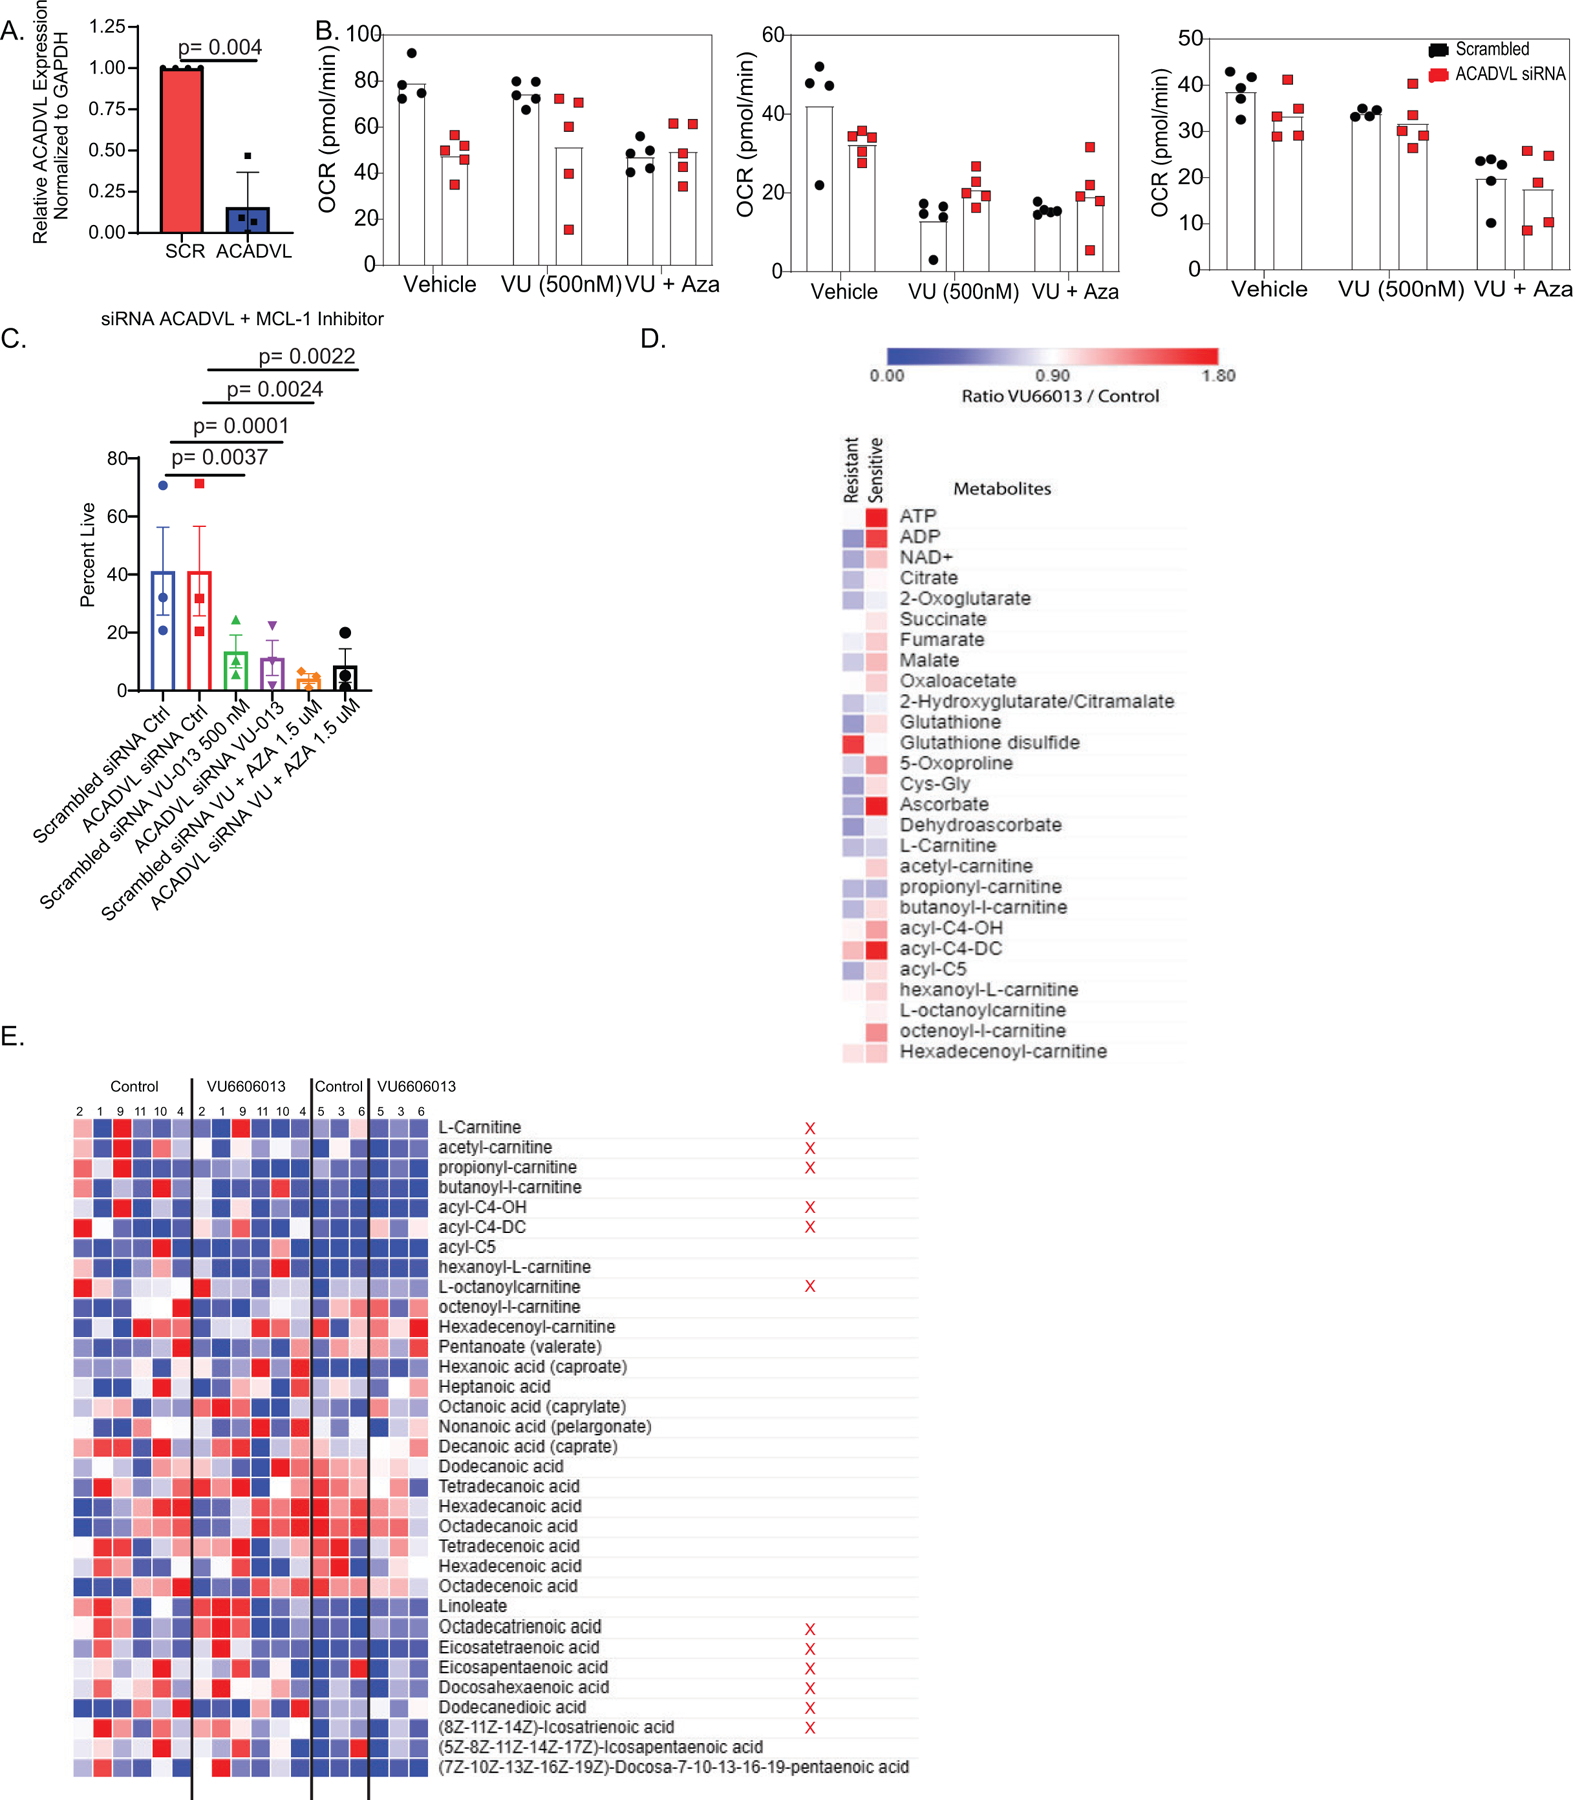
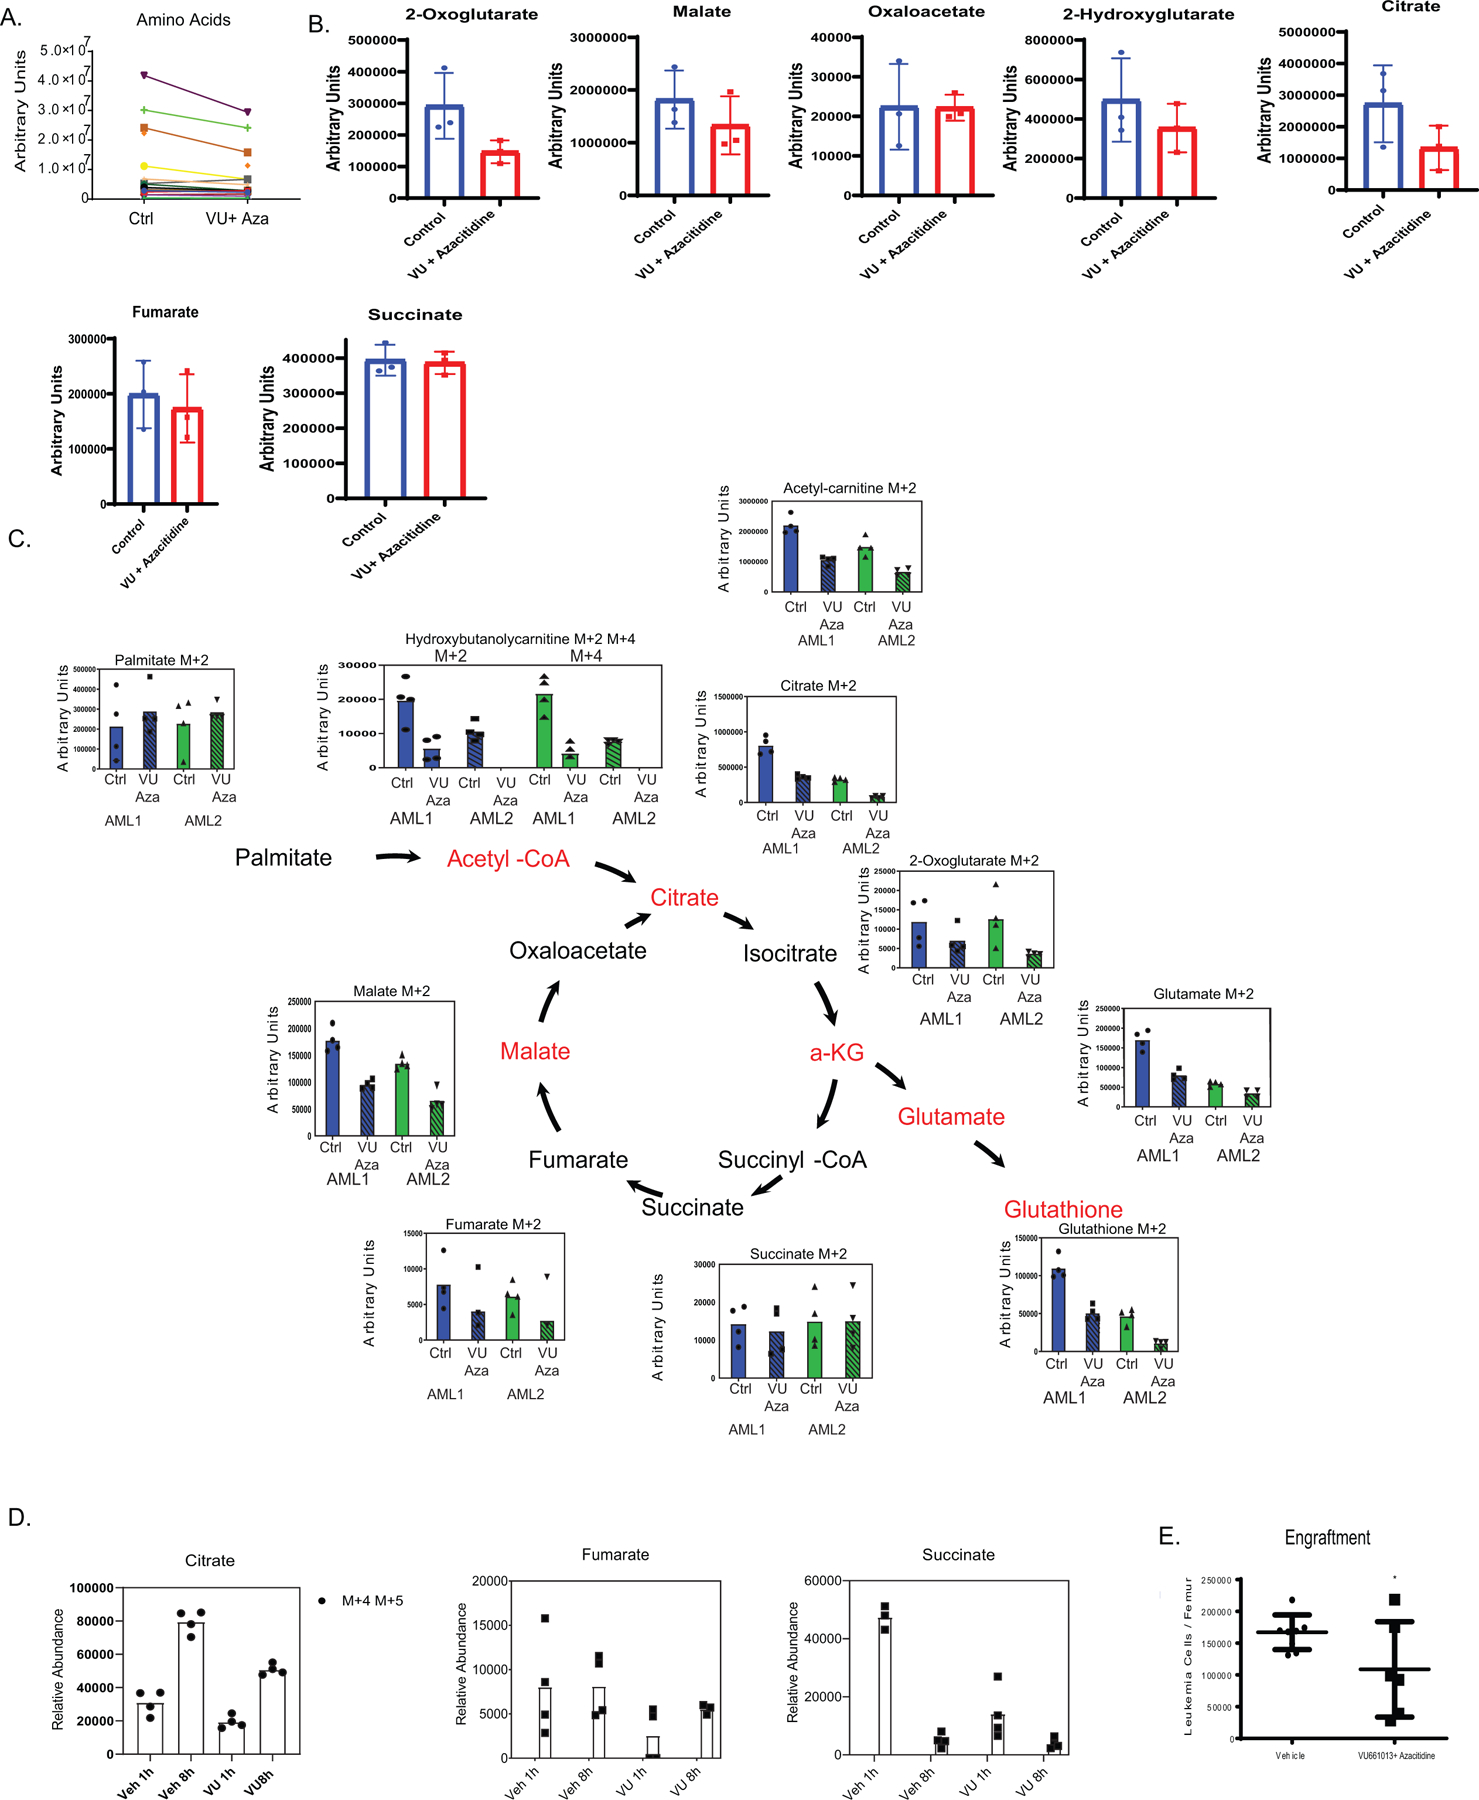
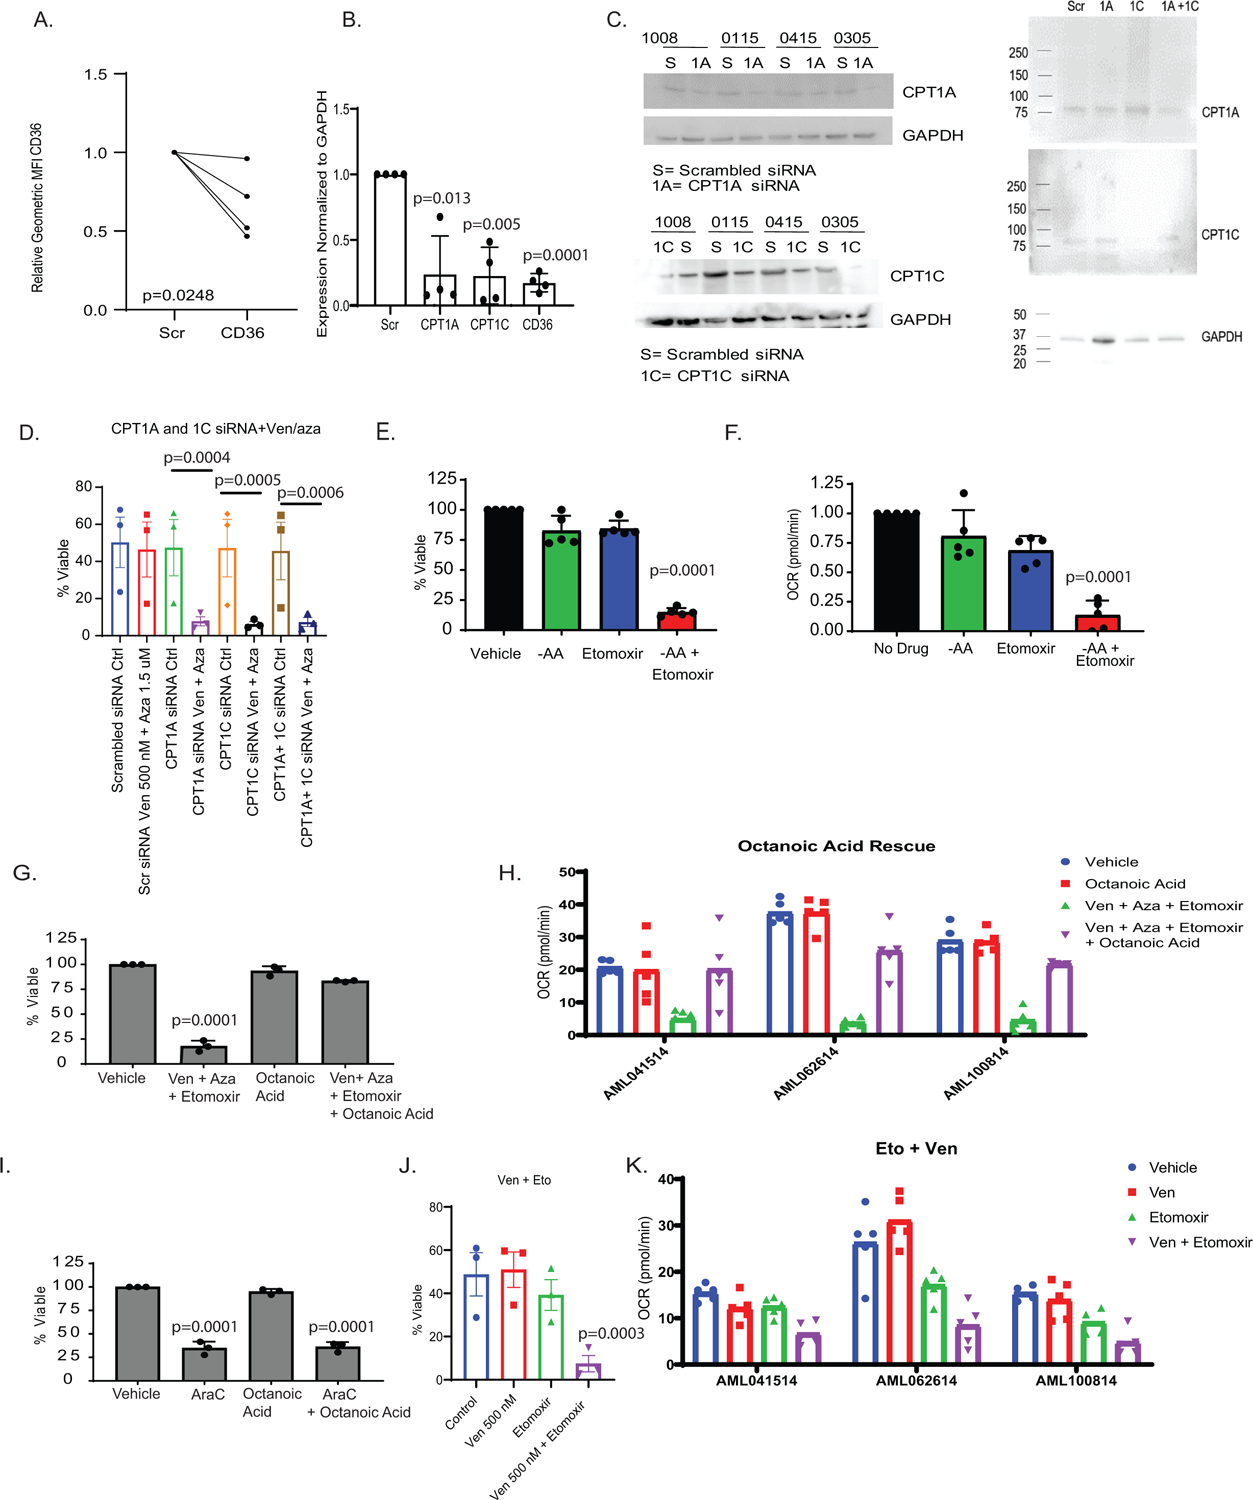
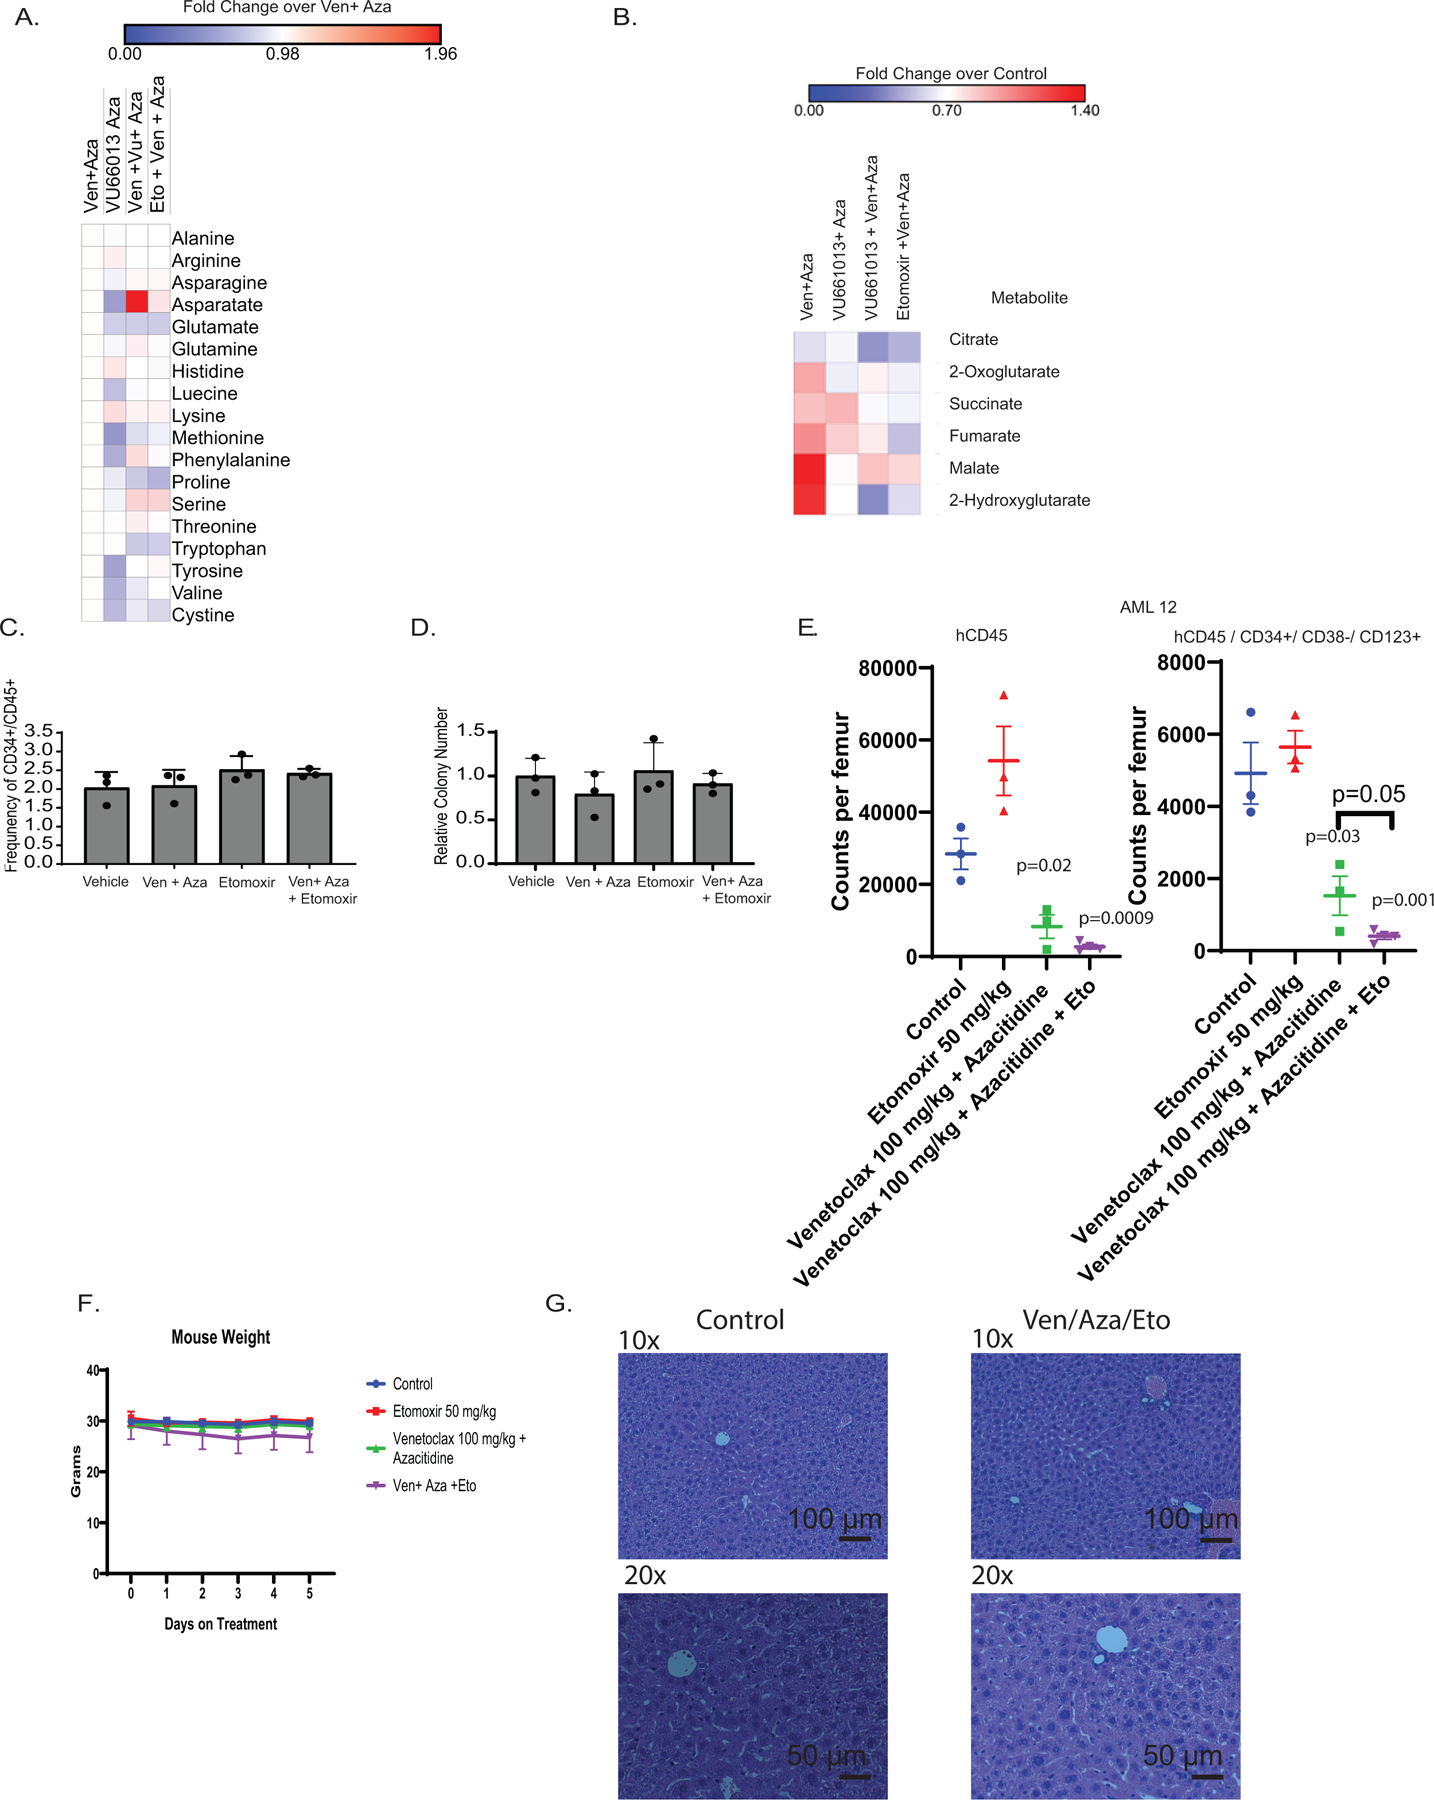
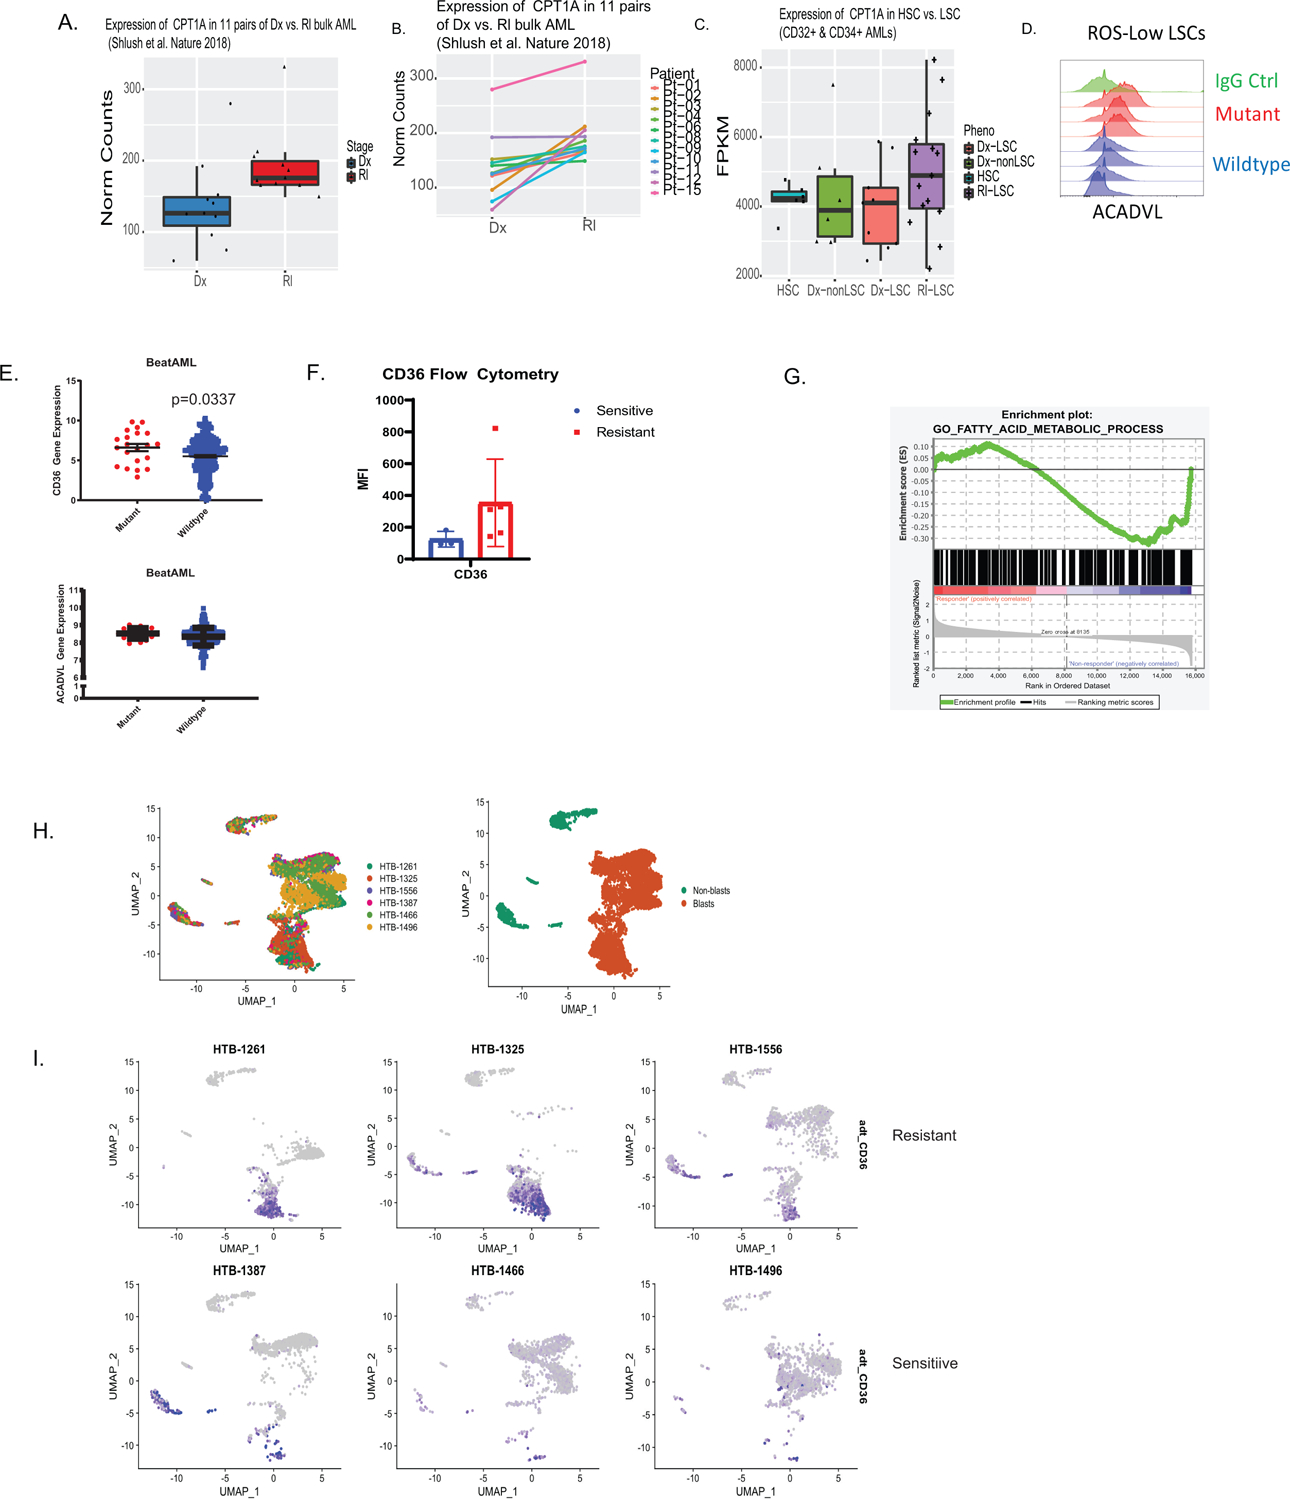
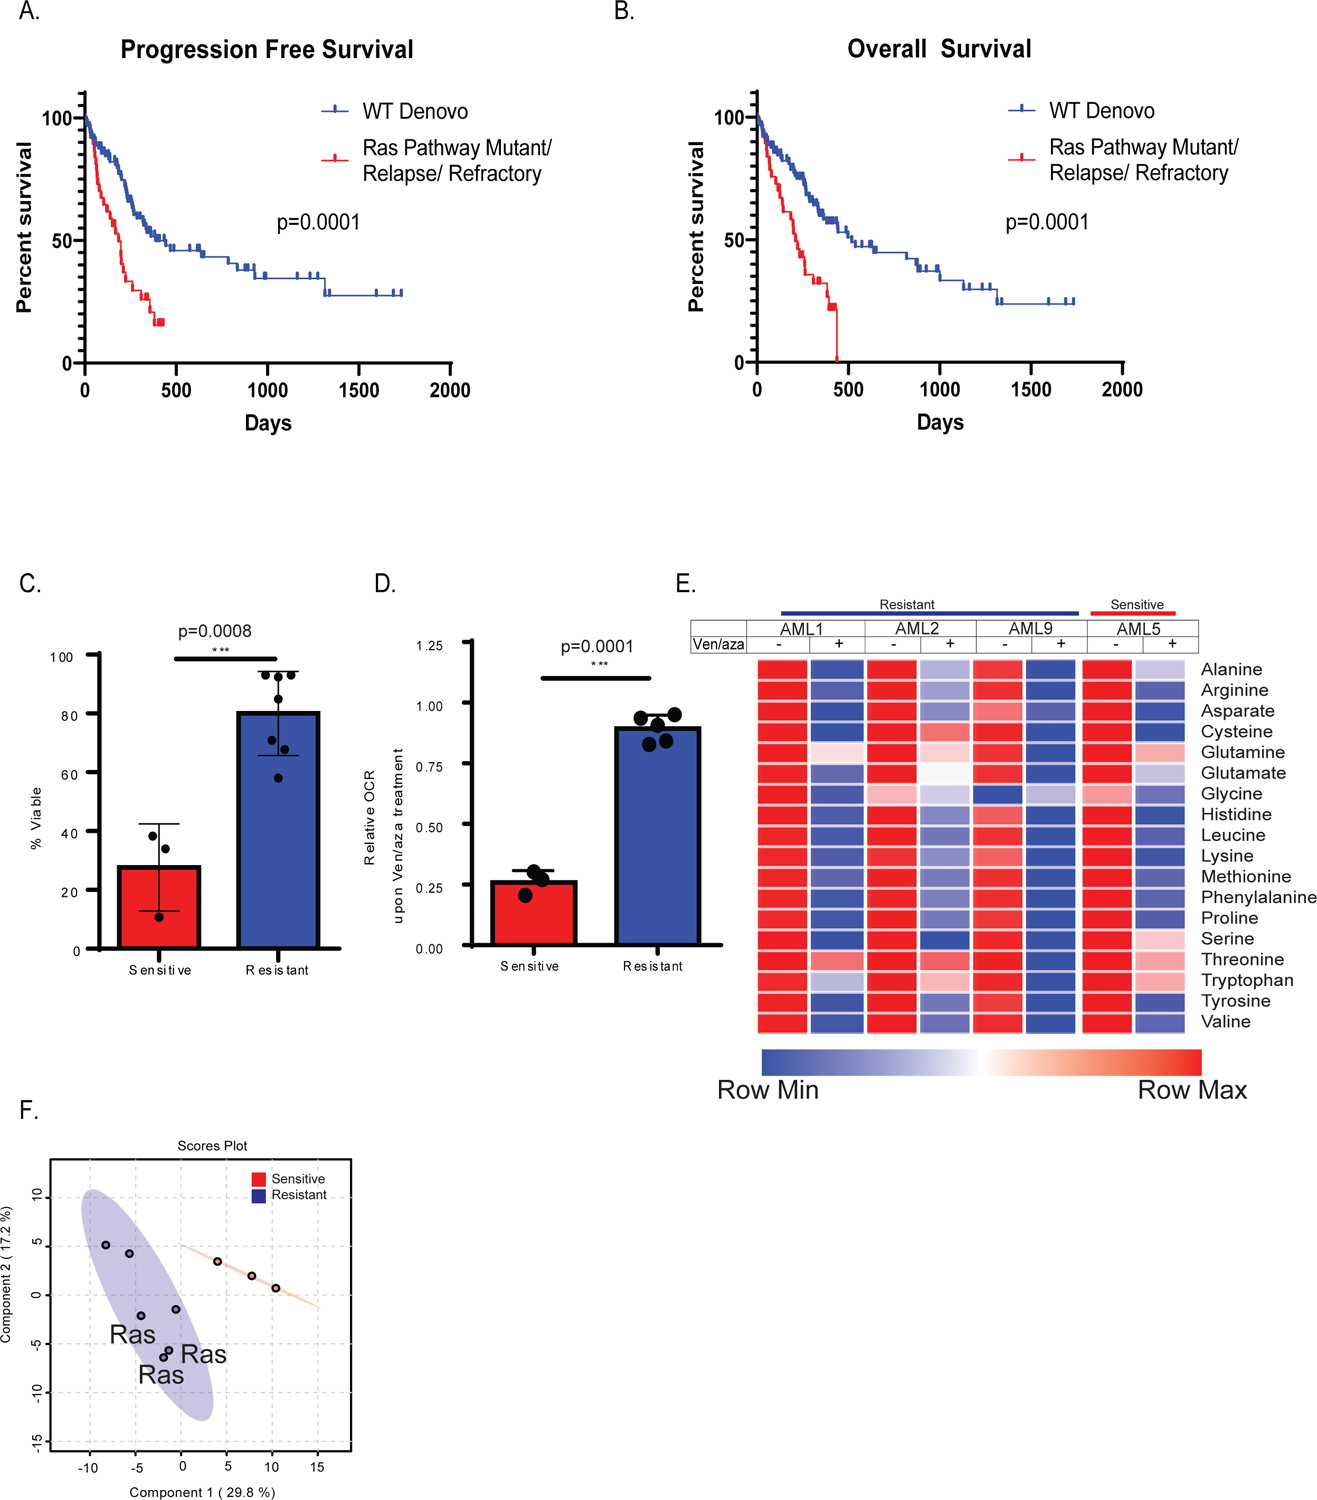
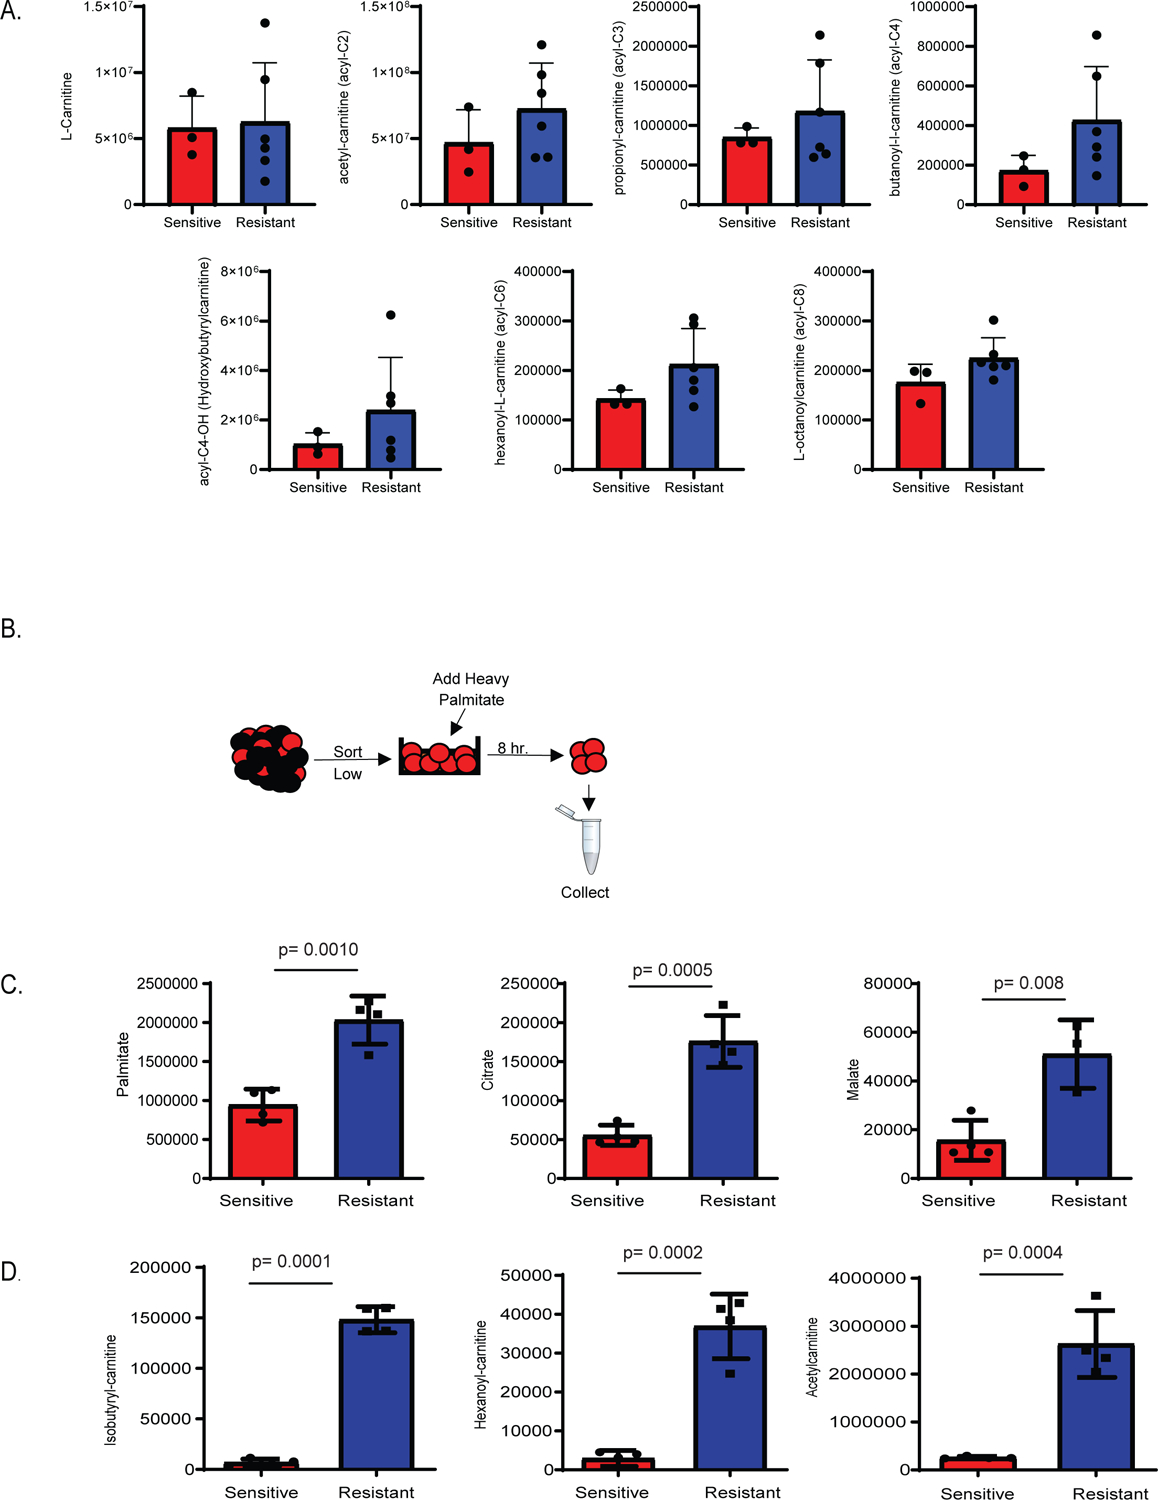
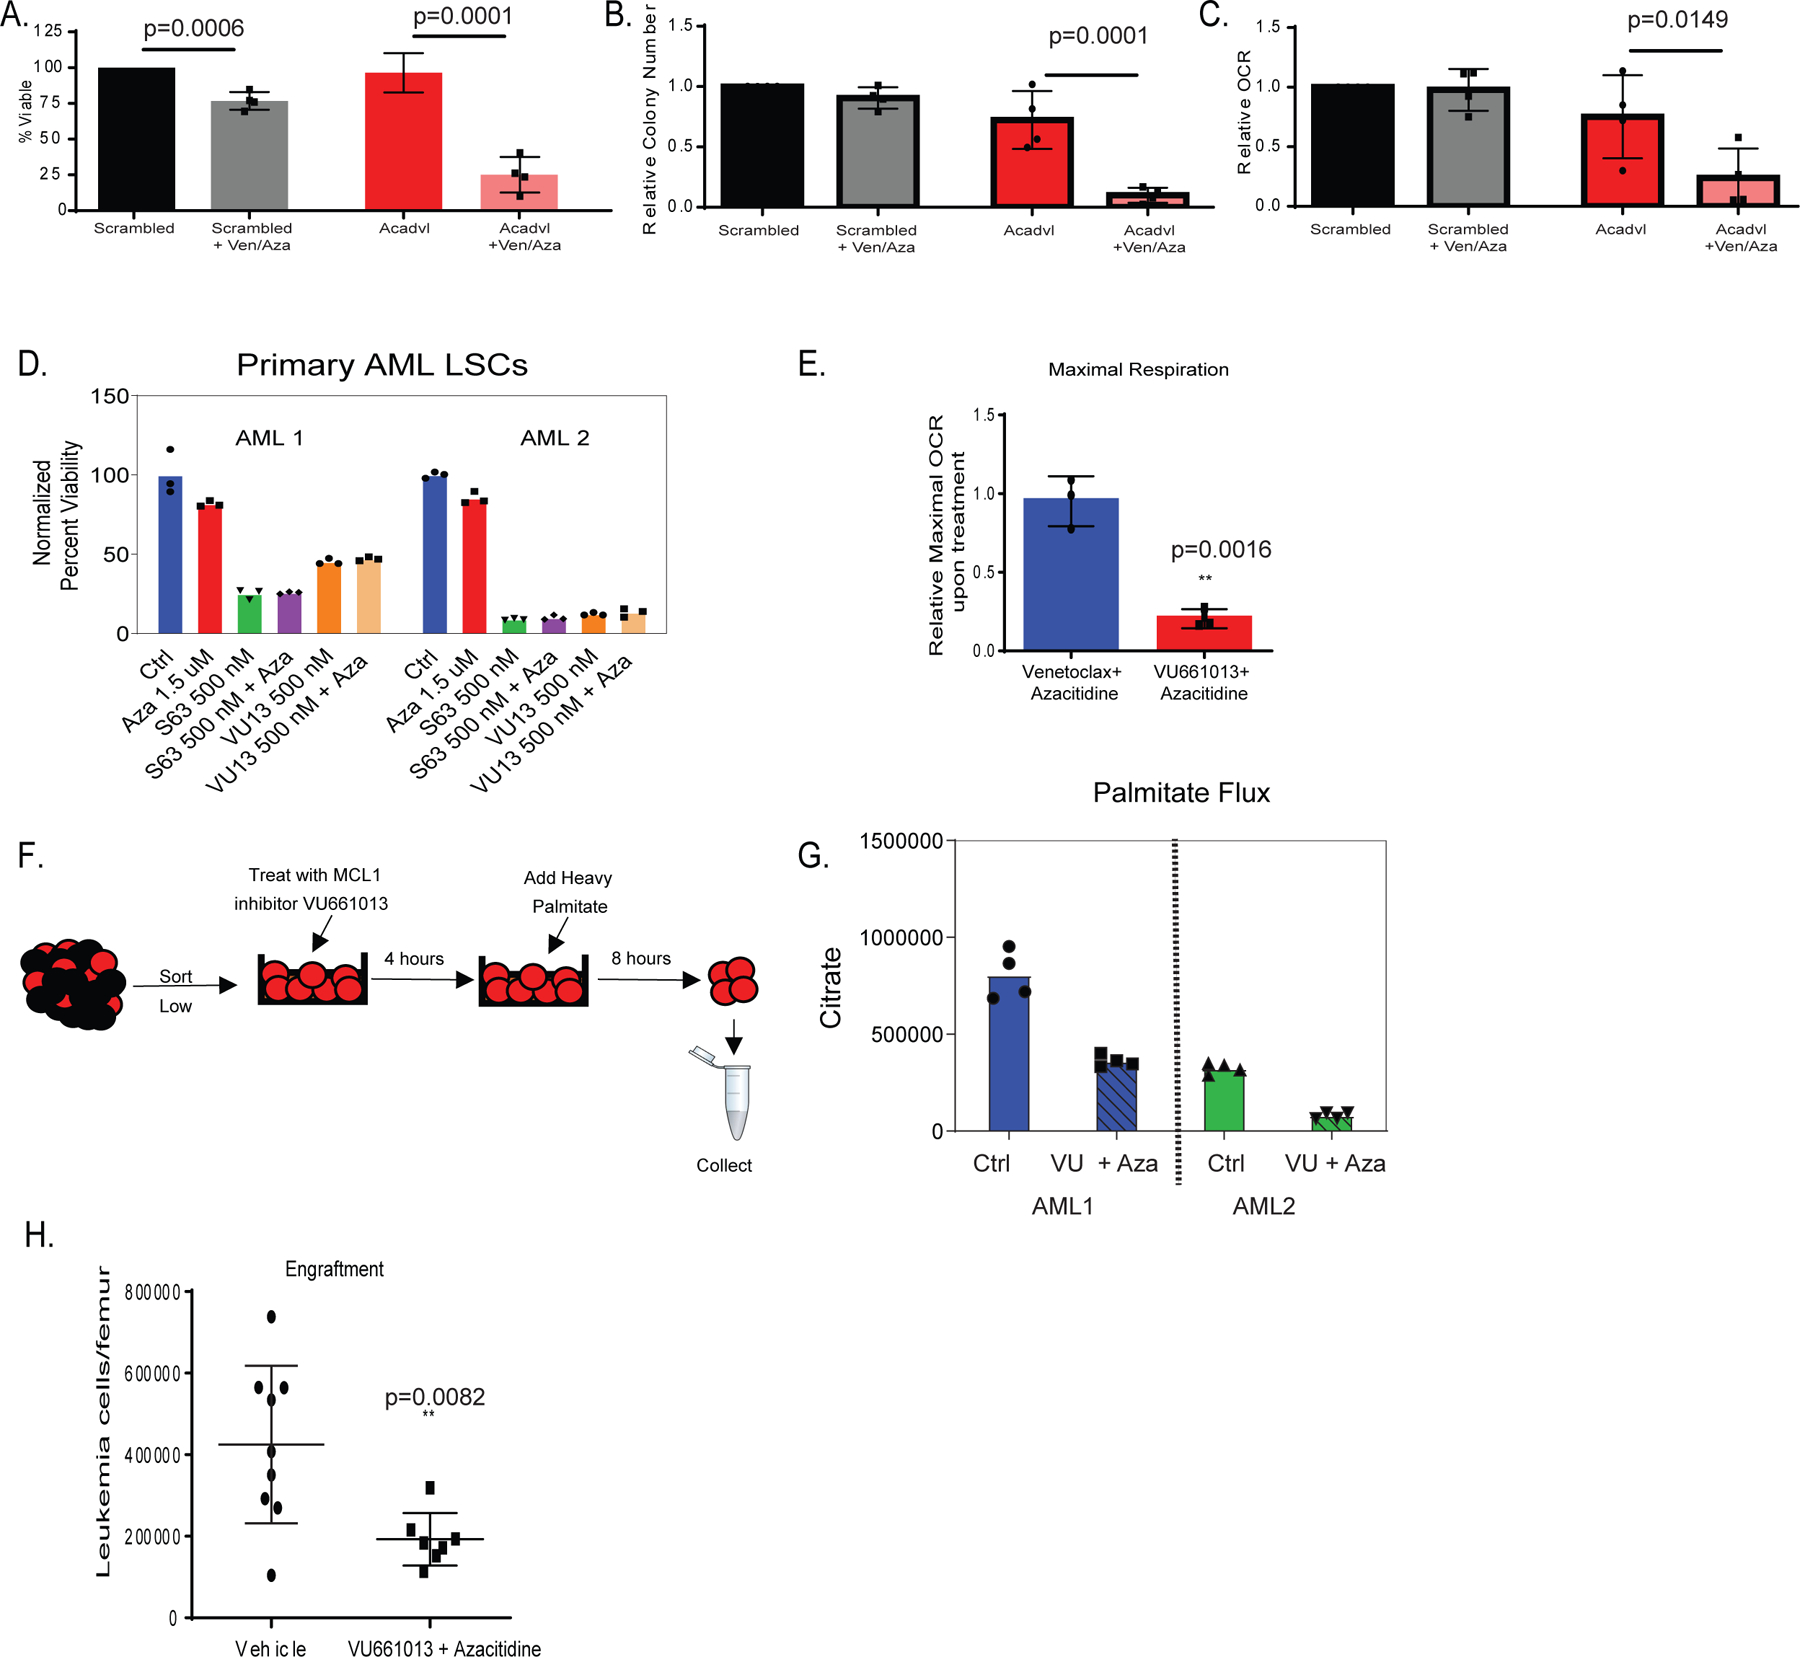
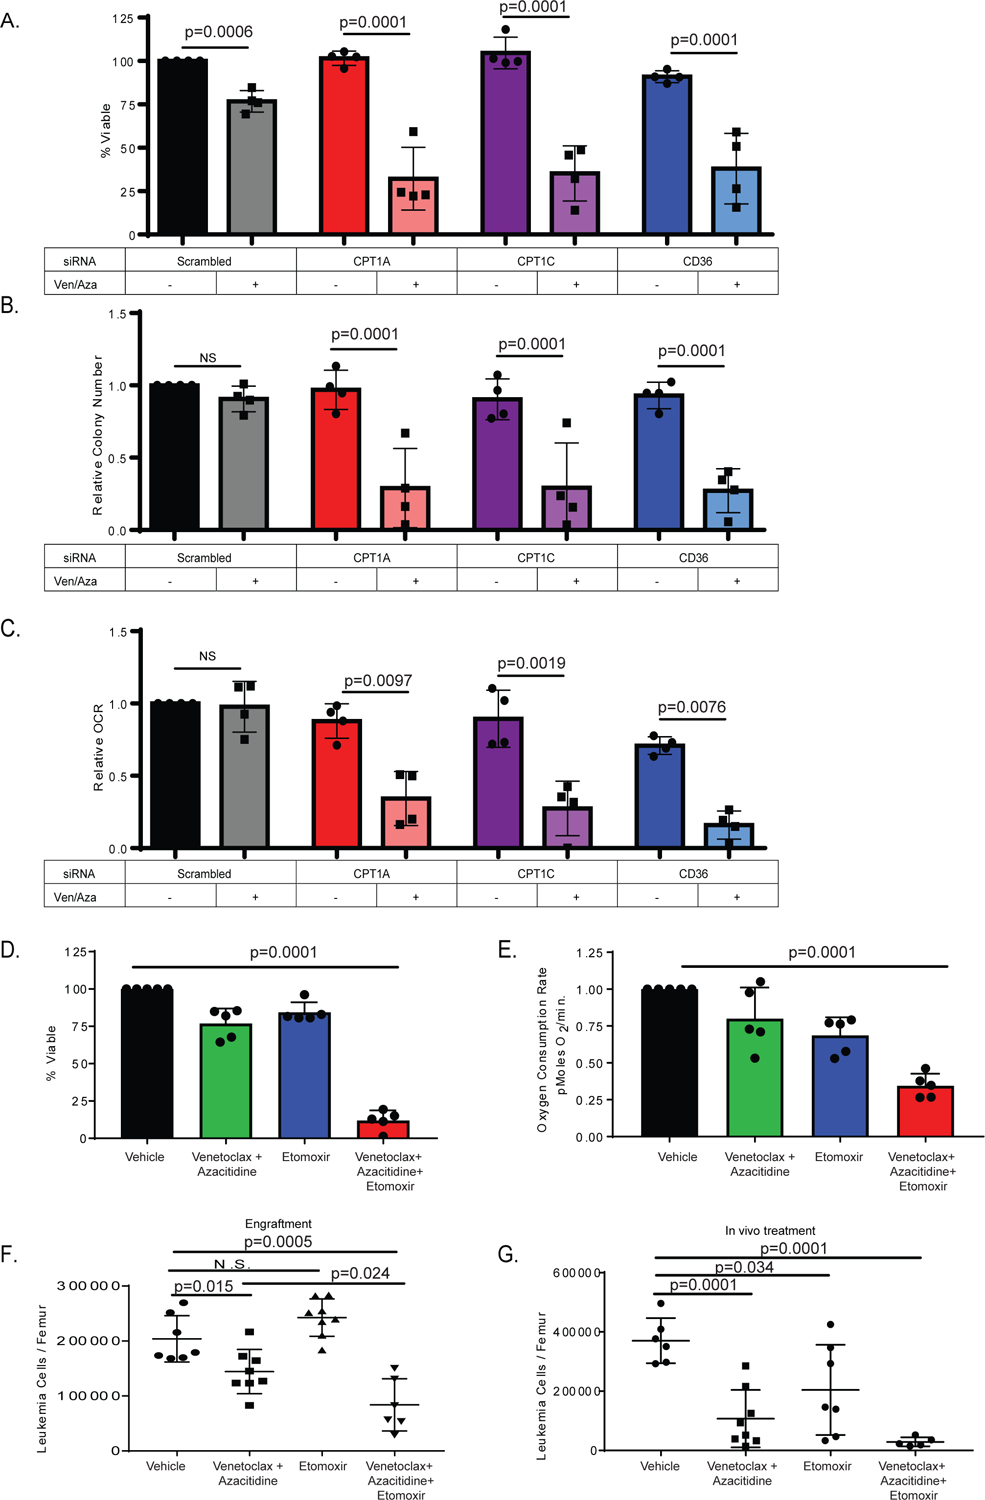
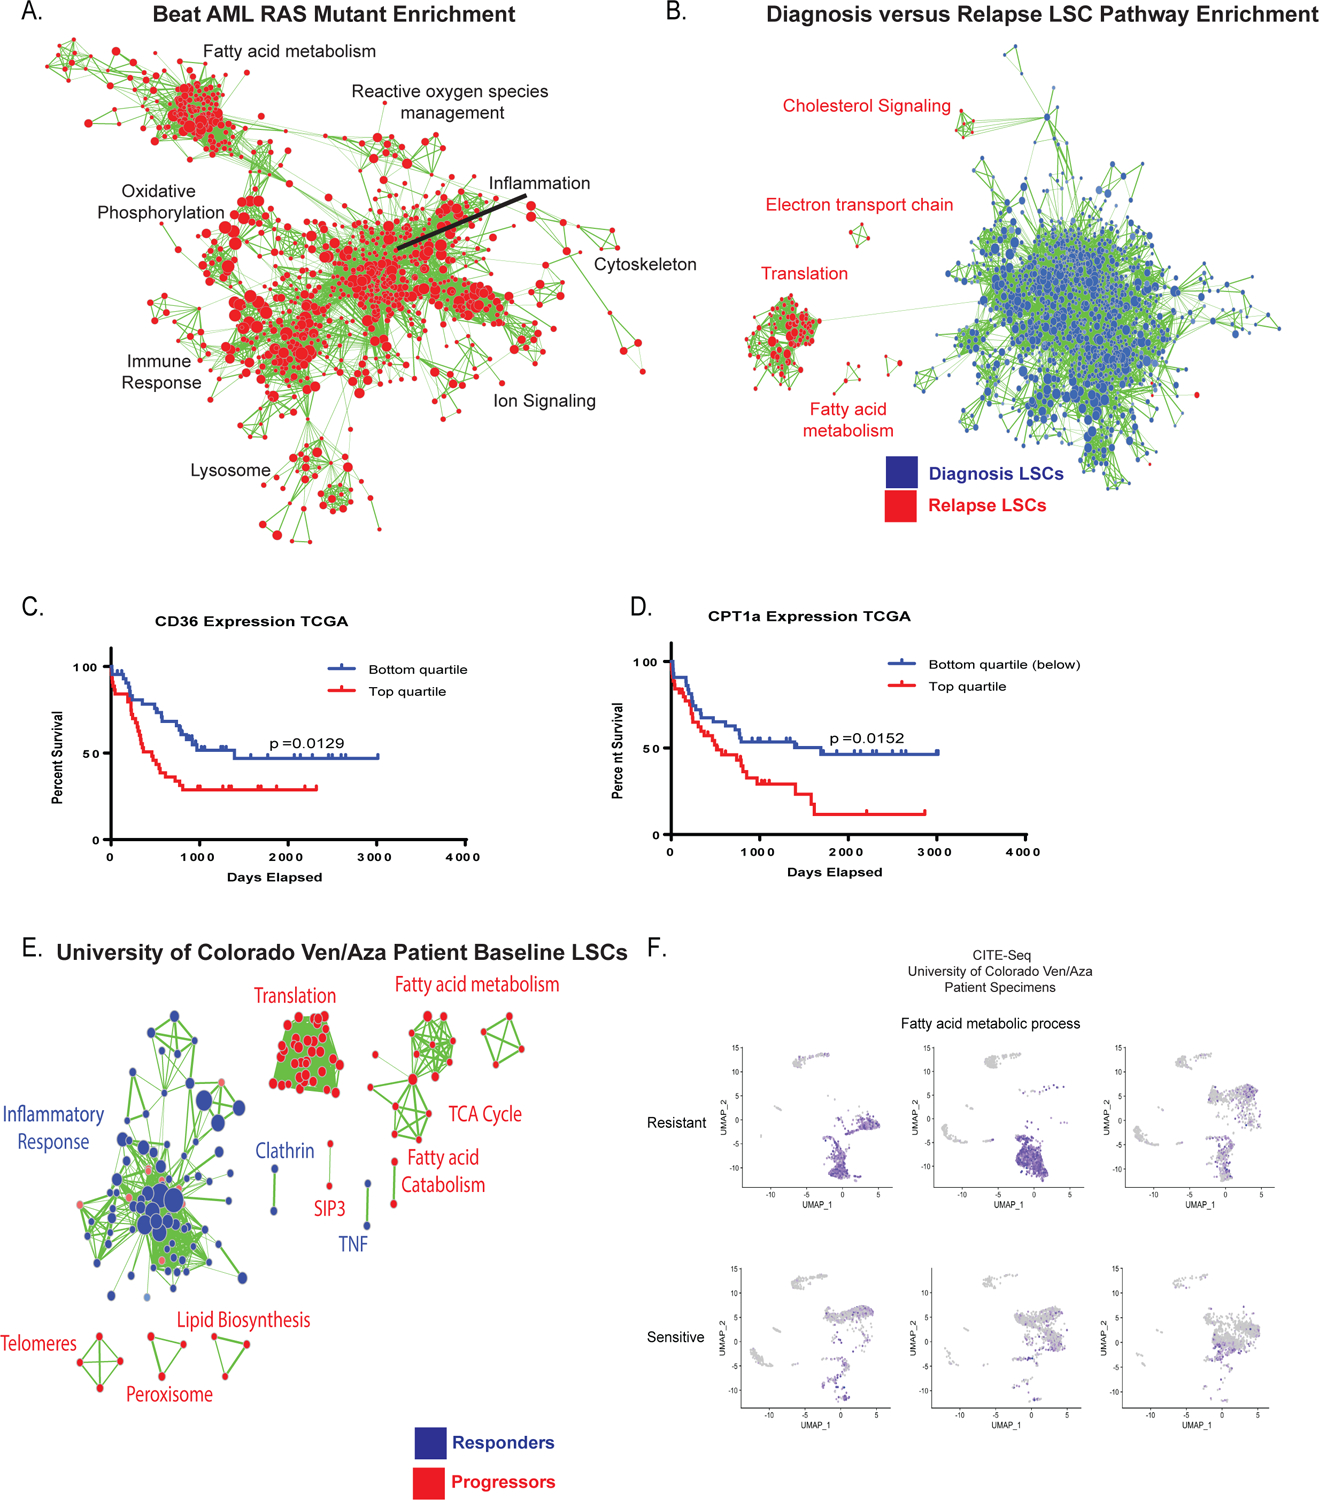
Venetoclax with azacitidine (ven/aza) has emerged as a promising regimen for acute myeloid leukemia (AML), with a high percentage of clinical remissions in newly diagnosed patients. However, approximately 30% of newly diagnosed and the majority of relapsed patients do not achieve remission with ven/aza. We previously reported that ven/aza efficacy is based on eradication of AML stem cells through a mechanism involving inhibition of amino acid metabolism, a process which is required in primitive AML cells to drive oxidative phosphorylation. Herein we demonstrate that resistance to ven/aza occurs via up-regulation of fatty acid oxidation (FAO), which occurs due to RAS pathway mutations, or as a compensatory adaptation in relapsed disease. Utilization of FAO obviates the need for amino acid metabolism, thereby rendering ven/aza ineffective. Pharmacological inhibition of FAO restores sensitivity to ven/aza in drug resistant AML cells. We propose inhibition of FAO as a therapeutic strategy to address ven/aza resistance.


Conflict of interest statement

Declaration of Interests: The authors declare the following competing interests:

Figures

Extended Data Figure 1:
Metabolite analysis of sensitive versus resistant LSCs. A. Global LC/MS metabolite screen of sensitive and resistant LSCs from figure 2. Values are normalized by metabolite to median expression of row. Each data point represents the median calculated from four technical replicates. B. Metabolite pathway analysis shows increased fatty acid metabolism pathways in resistant LSCs as determined by Metaboanalyst software analysis of global metabolite levels in LSCs. P value represents adjusted P value after multiple comparison Holm test. C. Heatmap of carnitine and fatty acid levels as determined by LC/MS. The samples in panels A-C are from the same sensitive (N = 3 patient specimens) and resistant (N=7 patient specimens) AML patient samples.
Extended Data Figure 2:
Effects of PTPN11 mutation on metabolism and venetoclax sensitivity. A. Measurement of fatty acids in ven/aza sensitive and resistant LSCs from lipodomics analysis shown as box and whiskers plot with min and max represented. N= 3 sensitive patient specimens versus N=3 resistant patient specimens measured across 4 technical replicates per patient sample. Significance was measured by paired two-tailed Student’s t-test. B. Venetoclax and ven/aza viability of primary AML cells of patients with or without a PTPN11 mutation. N= 3 independent patient wild-type specimens versus N=2 (venetoclax + aza) or 3 (venetoclax alone). PTPN11 resistant patient specimens measured across 3 technical replicates per patient sample. Data are presented as mean values. C-D. Basal respiration and glycolytic rate of primary AML cells transduced with lentiviral PTPN11 E76A mutation. N= 1 independent patient wild-type specimens versus N=1 PTPN11 mutant patient specimens measured across 4–5 technical replicates per sample. Individual values in glycolytic rate consolidated in instrument software and mean value shown. Data are presented as mean values. Patient sample run as single experiment with single transduction.
Extended Data 3:
Extended Data 3:
MCL-1 inhibition decreases fatty acid metabolism in ven/aza resistant LSCs. A. Relative expression of ACADVL in siRNA knockdown samples N= 4 independent patient samples. Data are presented as mean values +/− SD. Significance was measured by paired two-tailed Student’s t-test. B. Basal respiration in ACADVL siRNA knockdown cells with or without VU and VU+ Aza. N=3 patient specimens with N=5 technical replicates for each experiment. Data are presented as mean values. Patient samples run as single experiment with 3 unique patients. C. SiRNA knockdown of ACADVL and viability with or without VU and VU+ Aza. N=3 independent patient samples for each experiment. Data are presented as mean values +/− SD. Significance was measured by unpaired two-tailed Student’s t-test. D. Global metabolite measurement in sensitive and resistant LSCs after VU+ Aza treatment relative to control. N= 6 independent patient specimens versus N=3 sensitive patient specimens measured across 4 technical replicates per patient sample. Heat map shows the ratio of VU660103 treated to untreated control. E. Global carnitine and fatty acid levels after 4 hours of VU + Aza in ven/aza resistant (R) and sensitive (S) specimens. Metabolites that show selective decrease upon drug treatment in ven/aza resistant specimens are indicated by a red X. N= 6 independent patient specimens versus N=3 sensitive patient specimens measured in across 4 technical replicates per patient sample.
Extended Data Figure 4:
A. Global amino acid metabolite levels after 4 hours of VU + Azacitidine. N= 3 independent patient specimens measured across 4 technical replicates per patient sample. B. Global TCA cycle metabolite levels after 4 hours of VU + Azacitidine. N= 3 independent patient specimens versus N=3 sensitive patient specimens measured across 4 technical replicates per patient sample. Data are presented as median values +/− SD. Significance was measured by unpaired two-tailed Student’s t-test. C. Resistant LSCs exhibit increased palmitate contribution to fatty acid transport metabolites and TCA cycle intermediates as measured through stable isotope labelled palmitate flux. N= 2 resistant specimens measured across 4 technical replicates per specimen per condition. Data are presented as median. D. Palmitate abundance in TCA metabolites after 1 hour or 8 hours of VU660103 treatment. Stable isotope labeled amino acid flux into TCA cycle intermediates after 1 hour or 8 hours of treatment. N= 1 independent patient sample measured across 4 technical replicates. Patient sample run as single experiment. E. Engraftment of resistant LSCs is decreased after ex vivo treatment with VU/Aza as measured by human CD45 labelled cells per femur. N= 8 independent animals in vehicle and N= 6 independent animals in VU treated for 1 independent patient derived xenograft. Data are presented as mean values +/− SD. Significance was measured by unpaired two-tailed Student’s t-test.
Extended Data Figure 5:
Quantification of CD36, CPT1A, CPT1C after siRNA. A. Relative MFI from flow cytometry of CD36 after siRNA. N= 4 independent patient samples B. RNA levels of CPT1A, CPT1C, and CD36 24 hours post transfection in primary AML specimens. N= 4 independent patient samples. Data are presented as mean values +/− SD. C. Western blot quantification of CPT1A, CPT1C or CPT1A and CPT1C after siRNA in 4 specimens. N=4 independent patient samples. Western blots representative of at least 2 experimental replicates per patient sample. D. SiRNA for CPT1A and CPT1C alone and in combination and the effects on viability after 24 hour treatment with ven+aza. N=3 independent patient samples. Data are presented as mean values +/− SD. Significance was measured by paired two-tailed Student’s t-test. E. Etomoxir addition in resistant LSCs. Viability measured after etomoxir treatment in the presence or absence of amino acids. N=5 independent patient samples. Data are presented as mean values +/− SD. Significance was measured by paired two-tailed Student’s t-test. F. Oxygen consumption rate measured after etomoxir treatment in the presence or absence of amino acids via Seahorse analysis. N=5 independent patient samples. Data are presented as mean values +/− SD. Significance was measured by paired two-tailed Student’s t-test.. G-H Viability and oxygen consumption rate of LSCs after ven/aza, etomoxir, and octanoic acid addition. N=3 independent patient samples. Data are presented as mean values +/− SD. Significance was measured by paired two-tailed Student’s t-test. I. Viability of LSCs after cytrabine, etomoxir, and octanoic acid addition. N=3 independent patient samples. Data are presented as mean values +/− SD. Significance was measured by paired two-tailed Student’s t-test. J-K Viability and oxygen consumption rate of LSCs after ven, etomoxir, or ven+ etomoxir. N=3 independent patient samples. Data are presented as mean values +/− SD. Significance was measured by paired two-tailed Student’s t-test.
Extended Data Figure 6
A. Fold change of amino acids after 4 hour treatment with ven+aza, VU + aza, VU + ven+ aza, or Eto+ ven+ aza. N= 3 independent patient specimens versus N=3 sensitive patient specimens measured across 4 technical replicates per patient sample. Data are presented as median values. B. Fold change over control of TCA metabolites after 4 hour treatment with ven+aza, VU + aza, VU + ven+ aza, or Eto+ ven+ aza. N= 3 independent patient specimens versus N=3 sensitive patient specimens measured across 4 technical replicates per patient sample. Data are presented as median values. C. Viability of normal human CD34+ cells 24 hours after ven/aza and etomoxir addition. N=3 independent patient samples. Data are presented as mean values +/− SD. Significance was measured by paired two-tailed Student’s t-test. D. Colony forming units of normal human CD34+ cells after ven/aza and etomoxir addition. N=3 independent patient samples. Data are presented as mean values +/− SD. Significance was measured by paired two-tailed Student’s t-test. E. Etomoxir and ven+aza treatment in patient derived xenograft. Counts per femur measured with human CD45+ and human CD45+/ CD34+/ CD38-/CD123 via flow cytometry. N =3 mice for the vehicle, venetoclax + azacitidine, and etomoxir groups and N = 4 for the venetoclax + azacitidine + etomoxir group for 1 independent patient sample derived xenograft. Data are presented as mean values +/− SD. Significance was measured by unpaired two-tailed Student’s t-test. F. Mouse weight average across in vivo ven/aza/eto combination therapy experiment. N= 12 control, N=11 eto, N=12 ven+aza, and N=12 ven+aza+eto mice per dose for 1 independent patient sample derived xenograft. Data are presented as mean values +/− SD. Significance was measured by unpaired two-tailed Student’s t-test. G. Hematoxylin and eosin staining of mouse liver sections from ven/aza/eto combination compared to vehicle control - 10x and 20x magnification. Images representative of 3 individual mice per treatment group.
Extended Data Figure 7:
Transcriptional analysis of CPT1 and fatty acid metabolism in multiple data sets and patients that progress on ven/aza. A-B. Analysis of CPT1 in paired diagnosis versus relapse LSCs. N=11 paired patient specimens. A. Overall expression compared between diagnosis and relapse. B. Expression between paired specimens with lines linking same patient. Data are presented as mean values +/− SD. Data are presented as median with lower hinges and upper hinges at 25th and 75th percentile with upper whisker to largest value and lower whisker to smallest value. C. Analysis of diagnosis and relapse paired LSCs for CPT1a. N=35 sorted cell populations from 12 patients with following subpopulation numbers: N= 6 HSC cell populations, N=5 non-lsc cell populations, N= 9 DX LSC cell populations, and N=15 RI LSC cell populations. Data are presented as median with lower hinges and upper hinges at 25th and 75th percentile with upper whisker to largest value and lower whisker to smallest value D. Flow cytometric measurement of ACADVL in RAS mutant and RAS WT patient samples. N=4 mutant versus N=4 wildtype patient specimens. E. Transcript levels of CD36 and ACADVL from Beat AML database for RAS mutant and RAS WT patient samples. N=21 mutant patient specimens versus N=256 wildtype patient specimens. Data are presented as mean values +/− SEMF. Flow cytometry of ven/aza sensitive and resistant LSCs for CD36. N=3 sensitive versus N= 5 resistant patient specimens. Data are presented as mean values +/− SD. G. Enrichment plot of fatty acid metabolism from University of Colorado ven/aza patient. N= 9 patients (6 responders/3 progressors). LSCs shown to be enriched in patients that progress on therapy. H. UMAP projection of CITE Seq data of 6 patient specimens including n = 3 ven+aza clinical resistant and n = 3 ven+aza sensitive patients with blast cluster identification on UMAP projection. I. UMAP projection colored for CD36 antibody level of 6 patient specimens.
Figure 1:
Figure 1:. Patients with mutations in RAS pathway genes or prior therapy for AML are more resistant to ven/aza and exhibit altered energy metabolism in the LSC compartment
Progression free survival (A) and overall survival (B) of newly diagnosed AML patients who are wild type (WT) for RAS pathway mutations (blue line) in comparison to newly diagnosed AML patients bearing RAS pathway mutant patients (RAS/PTPN mutant) or are relapsed AML patietns (red line). RAS pathway mutations and refractory/relapse patients show significantly shorter survival than wild type de novo patients. N= 38 mutant or relapse and 98 WT patients. Log-rank (Mantel Cox) test p=0.0001 (A) and p=0.0002 (B). C. AML LSCs from RAS pathway mutant specimens or prior therapy patient specimens (combined and termed resistant) exhibit significantly less sensitivity to ven/aza (sensitive = 3 newly diagnosed AML specimens, and resistant = 7 RAS pathway or relapsed/refractory specimens. Data are presented as mean values +/− SD. Significance was measured by unpaired two-tailed Student’s t-test for N=3 sensitive versus N=3 RAS or N=4 relapsed (combined and termed resistant for N=7) biological replicates compared across the mean of three technical replicates of each independent sample. D. Resistant LSCs do not decrease oxygen consumption rate with addition of ven/aza in contrast to sensitive LSCs. Data are presented as mean values +/− SD. Significance was measured by unpaired two-tailed Student’s t-test for N=3 sensitive versus N=2 RAS or N=3 relapsed (combined and termed resistant for N=5) compared across the mean of five technical replicates of each independent specimen. E. Resistant and sensitive LSCs exhibit inhibition of amino acid uptake upon ven/aza treatment as measured by stable isotope labelled amino acids (please see Jones et al, Cancer Cell 2018 for additional examples of amino acid reduction upon ven/aza treatment). N=1 sensitive versus N=3 resistant independent patient specimens compared across the median of four technical replicates of each independent sample. F. Global LC/MS metabolite analysis reveals differences in resistant vs sensitive LSCs as shown in partial least squares (PLS) plot N= 3 sensitive specimens and 6 resistant specimens each with four technical replicates. Specimens bearing RAS pathway mutations are indicated).
Figure 2:
Figure 2:. Fatty acid metabolism is upregulated in resistant LSCs.
A. Steady state levels of metabolites involved in fatty acid transport are upregulated in resistant LSCs. N= 3 sensitive specimens and 6 resistant specimens with 3 of the resistant specimens being RAS pathway mutants and other 3 WT refractory. Data are presented as median values. B. Schematic representation of stable isotope labelled palmitate flux experiment performed on LSCs. C and D. Resistant LSCs exhibit increased palmitate contribution to TCA cycle intermediates and fatty acid transport metabolites (N= 4 sensitive specimens and 4resistant specimens). Data are presented as median values +/− SD of four patient replicates. Significance was measured by unpaired two-tailed Student’s t-test.
Figure 3:
Figure 3:. Fatty acid beta oxidation contributes to ven/aza resistance and MCL-1 inhibition decreases fatty acid metabolism.
A-C. siRNA knock-down of very long-chain specific acyl-CoA dehydrogenase (ACADVL) in combination with ven/aza decreases viability of resistant LSCs (panel A), colony-forming ability (panel B), and oxygen consumption rate (OCR)(panel C). N= 4 resistant specimens with 3 RAS pathway mutants. Data are presented as mean values +/− SD. Significance was determined using 2-way Anova analysis. D. MCL-1 inhibitors, S63845 and VU661013, decrease viability of resistant LSCs alone and in combination with azacitidine. This experiment was performed in 2 AML specimens both of which were RAS pathway mutants. N=3 technical replicates are shown. Data are presented as mean values. E. MCL-1 inhibitor VU661013 and azacitidine but not ven/aza decreases OCR in resistant LSCs. N=3 individual patient specimens (all RAS pathway mutants) Data are presented as mean values +/− SD. Significance was measured by unpaired two-tailed Student’s t-test. F. Schematic representation of stable isotope labelled palmitate flux experiment performed on LSCs in presence of MCL-1 inhibitor VU661013 and azacitidine. G. Representative plot for palmitate flux into TCA cycle intermediates (citrate shown, others in extended data figure 3D) in resistant LSCs in the presence of MCL-1 inhibitor. Experiment repeated in 2 individual patient specimens, each with a RAS mutation, reproduced with four technical replicates. Data are presented as median values of four technical replicates. H. MCL-1 inhibitor VU660103 and azacitidine significantly decrease engraftment potential of resistant LSCs after transplantation into immune deficient mice. AML cells were incubated in presence of 500 nM VU660103 and 1.5 uM Azacitidine for 24 hours prior to transplant. Data are presented as mean values +/− SD. Significance was measured by unpaired two-tailed Student’s t-test N= 9 independent animals in vehicle and N= 8 independent animals in VU treated for 1 independent patient derived xenograft.
Figure 4:
Figure 4:. Fatty acid transport genes mediate ven/aza resistance of LSCs
A. siRNA knock-down of Cpt1A, Cpt1C, and CD36 in combination with ven/aza decreases viability of resistant LSCs. N= 4 resistant primary AML specimens (2 RAS pathway mutants). Data are presented as mean values +/− SD. Significance was measured by unpaired two-tailed Student’s t-test. [B]. colony-formation assays and [C] oxygen consumption rates for the same specimens and conditions shown in panel. Data are presented as mean values +/− SD. Significance was determined using 2-way Anova analysis. D. Etomoxir in combination with ven/aza decreases viability of resistant LSCs. N= 5 resistant specimens (1 RAS pathway mutant). Data are presented as mean values +/− SD. Significance was measured by unpaired two-tailed Student’s t-. E. Etomoxir in combination with ven/aza decreases OCR of resistant LSCs. N= 5 resistant specimens (1 RAS pathway mutant). Data are presented as mean values +/− SD. Significance was measured by unpaired two-tailed Student’s t-test. F. A ven/aza resistant LSC specimen was treated ex vivo for 24 hours with the indicated conditions and transplanted into immune deficient NSG-S mice. Cells were dosed with 50 uM Etomoxir, 500 nM Venetoclax, and 2.5 uM Azacitidine in the combinations indicated. At 6 weeks post-transplant, the levels of human leukemia cells in the bone marrow was determined (N = 7 mice in vehicle group, N = 8 mice in the venetoclax with azacitidine group, N = 8 mice in the etomoxir group, and N = 6 in the venetoclax + azacitidine + etomoxir group. Data are presented as mean values +/− SD. Significance was measured by unpaired two-tailed Student’s t-test. G. In vivo treatment with etomoxir in combination with ven/aza significantly decreased tumor burden in patient derived xenograft. (N = 6 mice in vehicle group, N = 8 mice in the venetoclax with azacitidine group, N = 7 mice in the etomoxir group, and N = 5 in the venetoclax + azacitidine + etomoxir group. Data are presented as mean values +/− SD. Significance was measured by unpaired two-tailed Student’s t-test.
Figure 5:
Figure 5:. Transcriptional analysis of fatty acid metabolism genes correlates with clinical resistance to ven/aza.
A. Transcriptional analysis of RAS pathway mutant specimens from Beat AML data shows enrichment of gene sets involved in fatty acid metabolism, oxidative phosphorylation, lysosome, and reactive oxygen species management (red colored nodes indicate genes/pathways upregulated in RAS pathway mutations). N= 451 total patients with 78 mutant patients and 373 WT patients. B. Transcriptional analysis of diagnosis and relapse paired specimen LSCs shows enrichment of gene sets involved in fatty acid metabolism and TCA cycle. N= 8 diagnosis LSC samples and N= 15 relapse samples C. Survival analysis of lowest and highest quartile expression of CD36 in the TCGA data set. Significance was measured with Log- Rank (Mantel-Cox) test. N= 45 patients in top and N=46 patients in bottom quartile. D. Survival analysis of lowest and highest quartile expression of CPT1a in TCGA data set. Significance was measured with Log- Rank (Mantel-Cox) test. N= 45 patients in top and N=46 patients in bottom quartile. E. Transcriptional analysis of baseline LSCs from patients undergoing ven/aza therapy shows enrichment of gene sets involved in fatty acid metabolism and TCA cycle in patients that progress on therapy versus long term responders N= 9 patients (6 responders/3 progressors). F. CITE-seq analysis of 3 ven/aza sensitive and 3 ven/aza resistant patients reveals significantly different transcriptional profiles with enrichment in fatty acid metabolism in non-responder patient cells.

References

    1. Pollyea DA & Jordan CT Therapeutic targeting of acute myeloid leukemia stem cells. Blood 129, 1627–1635, 10.1182/blood-2016-10-696039 (2017). - DOI - PubMed
    1. DiNardo CD et al. Venetoclax combined with decitabine or azacitidine in treatment-naive, elderly patients with acute myeloid leukemia. Blood 133, 7–17, 10.1182/blood-2018-08-868752 (2019). - DOI - PMC - PubMed
    1. Jones CL et al. Inhibition of Amino Acid Metabolism Selectively Targets Human Leukemia Stem Cells. Cancer Cell 34, 724–740 e724, 10.1016/j.ccell.2018.10.005 (2018). - DOI - PMC - PubMed
    1. Pollyea DA et al. Venetoclax with azacitidine disrupts energy metabolism and targets leukemia stem cells in patients with acute myeloid leukemia. Nat Med 24, 1859–1866, 10.1038/s41591-018-0233-1 (2018). - DOI - PMC - PubMed
    1. Lagadinou ED et al. BCL-2 inhibition targets oxidative phosphorylation and selectively eradicates quiescent human leukemia stem cells. Cell stem cell 12, 329–341, 10.1016/j.stem.2012.12.013 (2013). - DOI - PMC - PubMed

Publication types

MeSH terms